
- Tweets 5,447
- Following 60
- Followers 7,914
- Likes 2,266


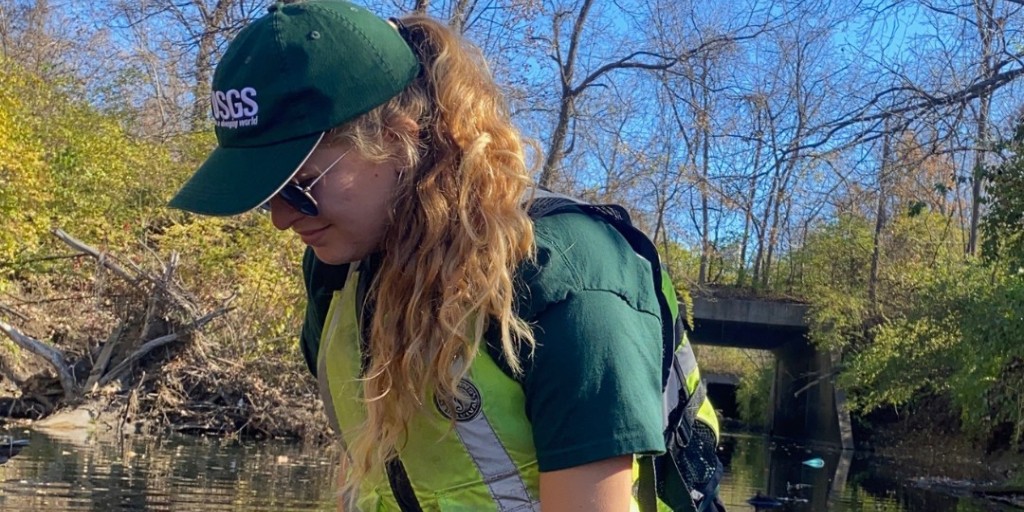

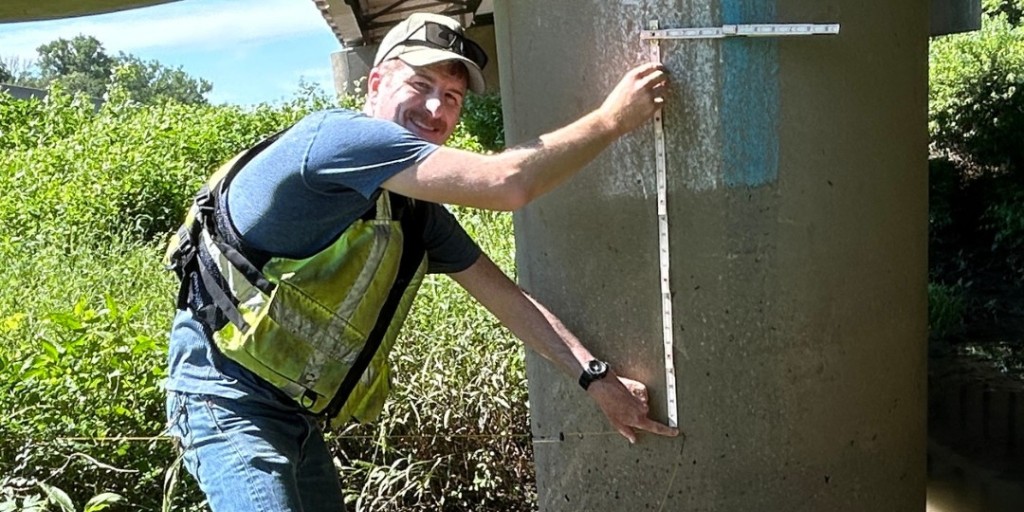
ALT A USGS hydrologic technician holds the level rod during an annual set of levels at the historic Cataloochee Creek near Cataloochee, North Carolina. Photo by Jessica Moore, USGS

ALT USGS hydrologic technicians log data at Gunpowder Falls at Glencoe, Maryland.

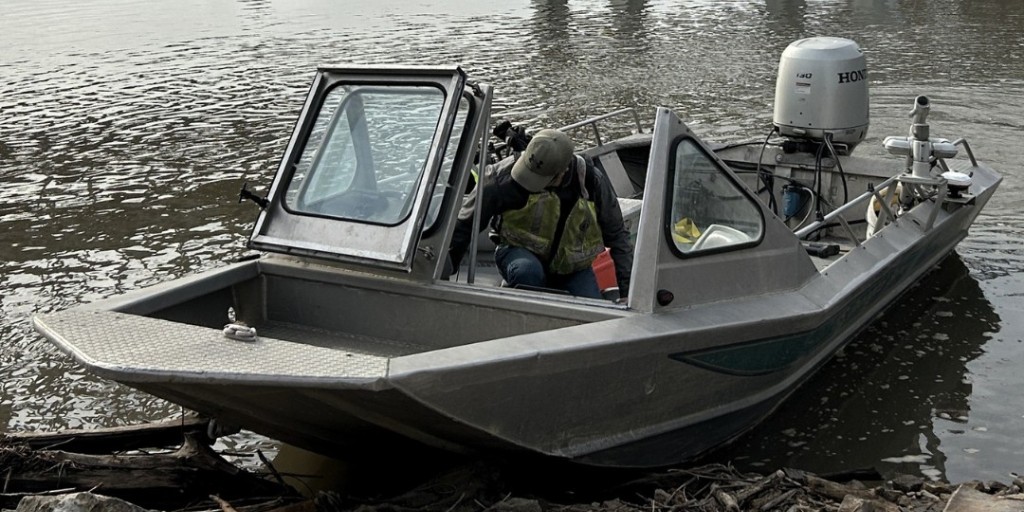
ALT USGS staff prepare to drop a current meter overboard from the research boat, Muddy Waters, offshore of Wellfleet, Massachusetts.
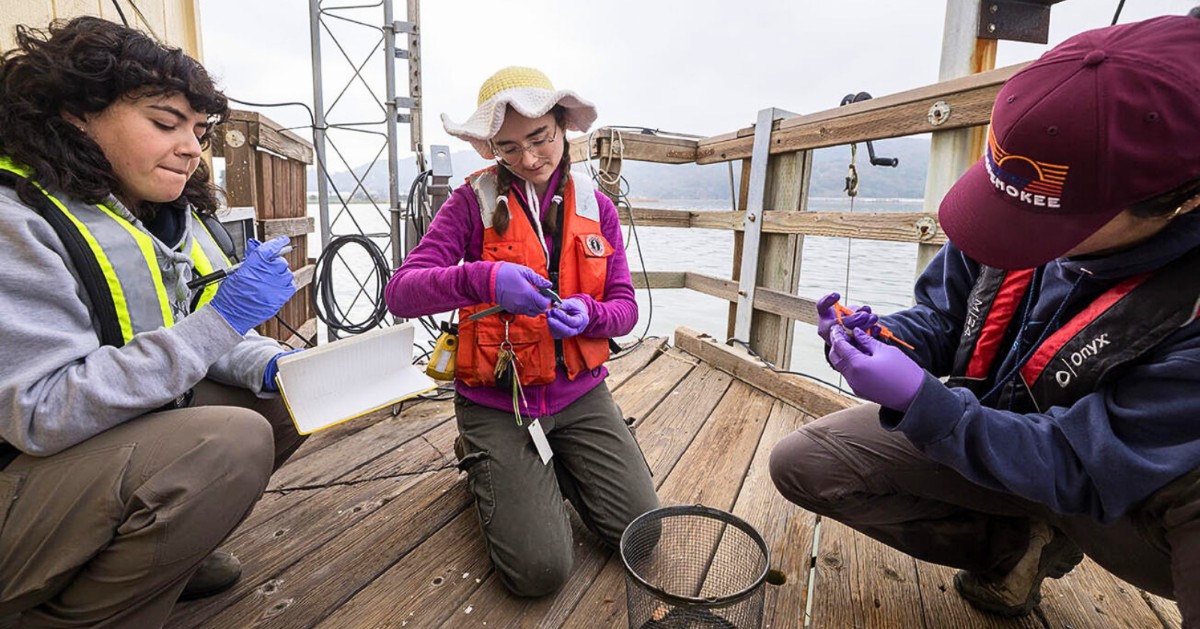
ALT USGS staff gather and measure shellfish samples collected at Martinez Harbor, Contra Costa County, California. Photo by California Department of Water Resources
ALT USGS scientists sampling groundwater near the top of the water table in a corn field in Concord, New Hampshire. Photo by Joseph Ayotte, USGS.

ALT A view of Coakley Landfill in Northampton, NH. Pipes used to vent landfill gases can be seen in the distance. Photo by Philip Harte, USGS.

ALT Scientists work in the Leetown, WV Eastern Ecological PFAS Lab. Photo by David Fisher, USGS.
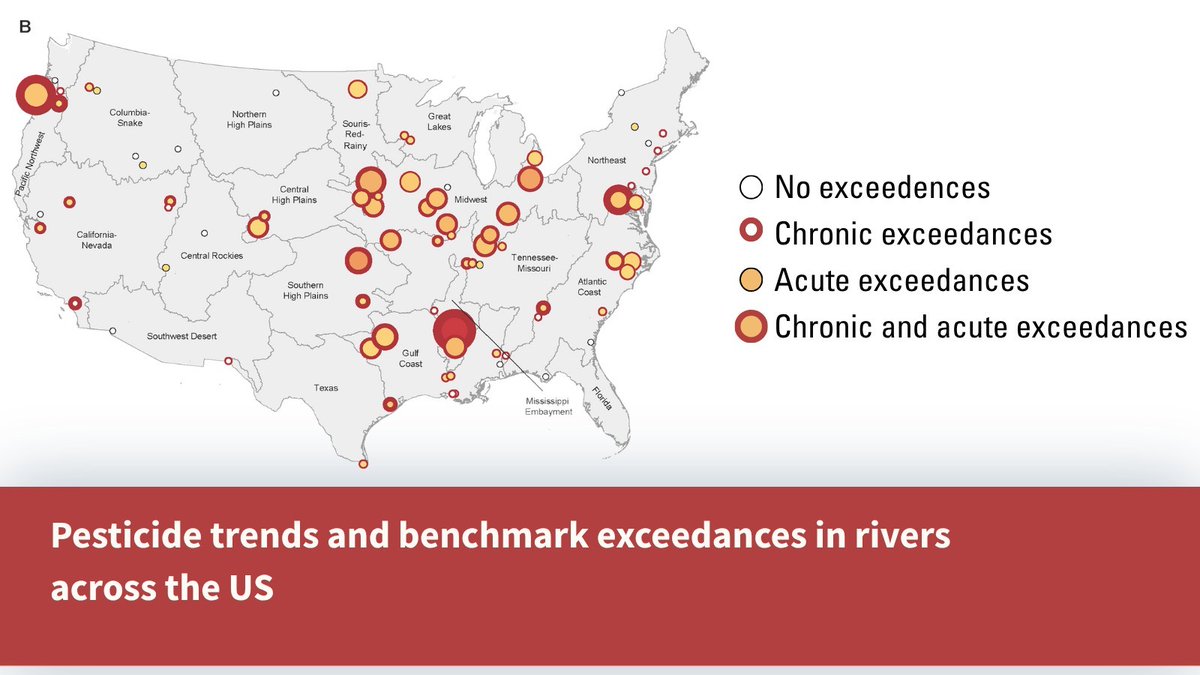
ALT Map from publication showing acute and chronic aquatic life benchmark exceedances at USGS National Water Quality Network riverine sites (2013–2022). Inner circle size shows how many pesticides exceeded acute benchmarks; red outline thickness shows how many exceeded chronic benchmarks. Inner circle color indicates how many acute exceedances occurred (yellow for low, red for more than 150).
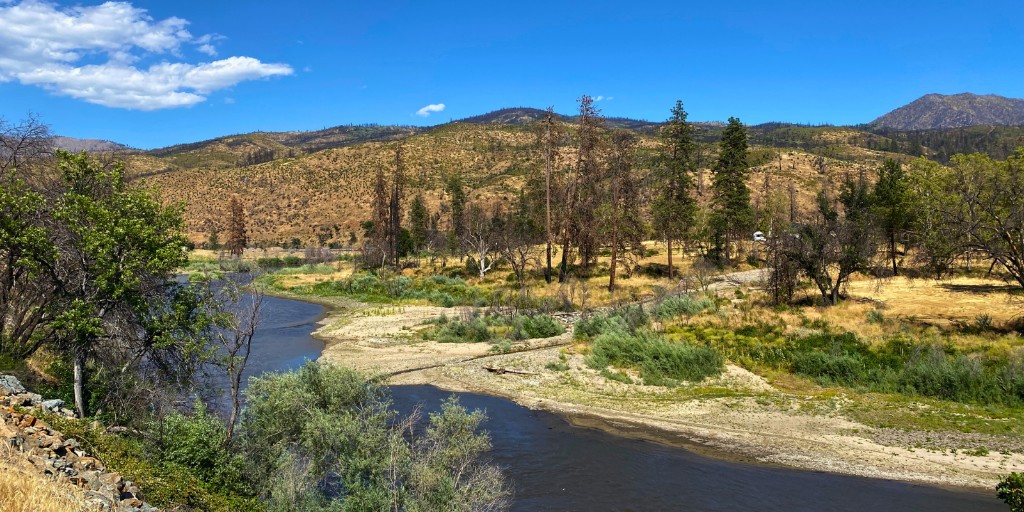
ALT The Klamath River following the 2022 McKinney Fire, with burned areas visible along the distant ridgeline and a debris fan in the foreground near the confluence of Little Humbug Creek and the Klamath River. The photo documents sediment and debris deposited from burned landscapes into the river corridor following wildfire and storm runoff. Photo by Jennifer Curtis, USGS
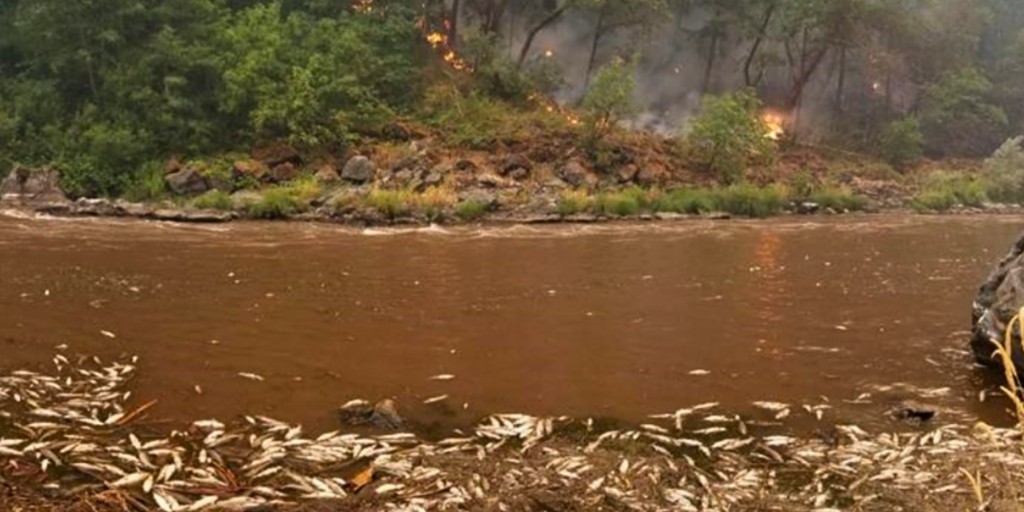
ALT Active fire and fish kill. Photo by the Karuk Tribe
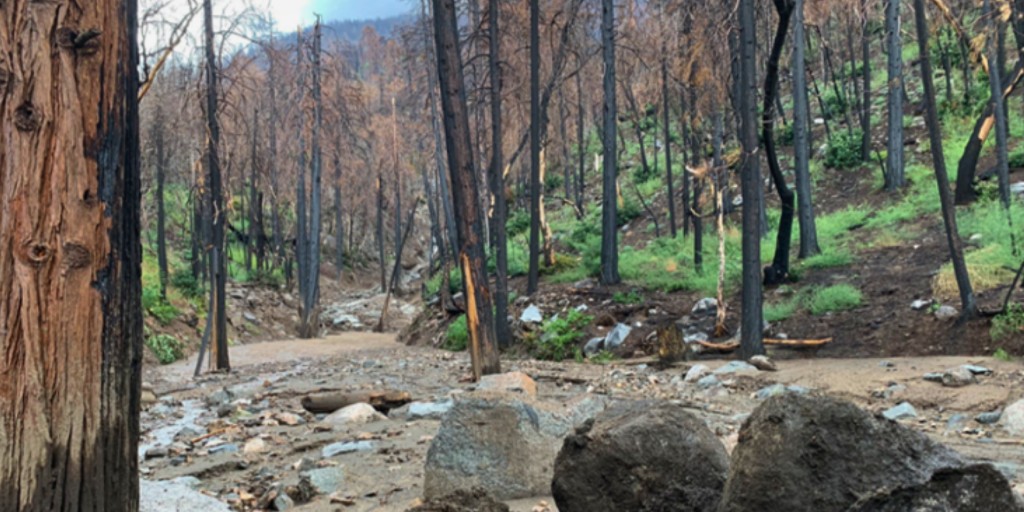
ALT A post-fire debris flow (PFDF) scar in the headwaters of Vesa Creek. Photo by California Department of Fish and Wildlife
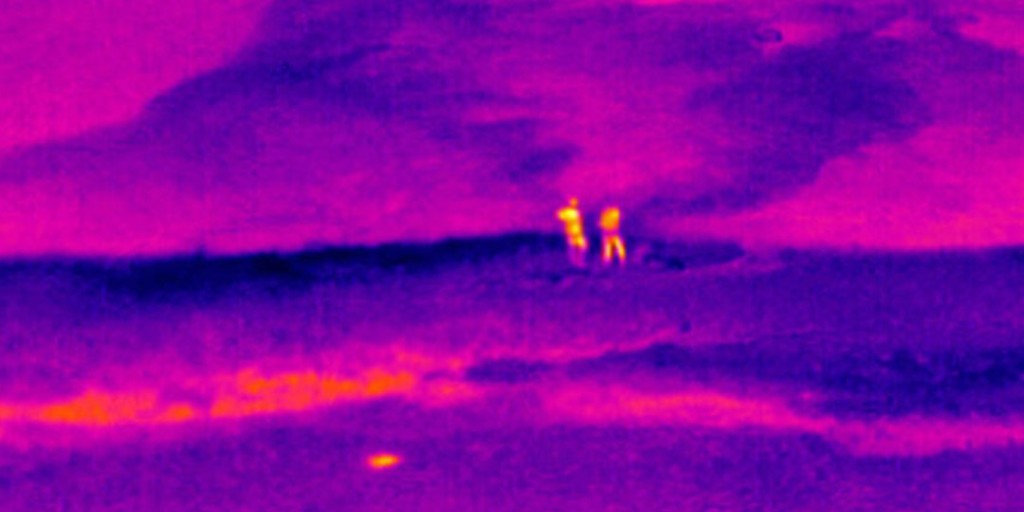
ALT Thermal infrared image of two USGS researchers standing on the coast and looking up over a coastal groundwater plume that is non-visible to the naked eye but is shown in this thermal image from temperature differences between the cooler (blue) groundwater and warmer (pink) ocean water over the coral reefs.
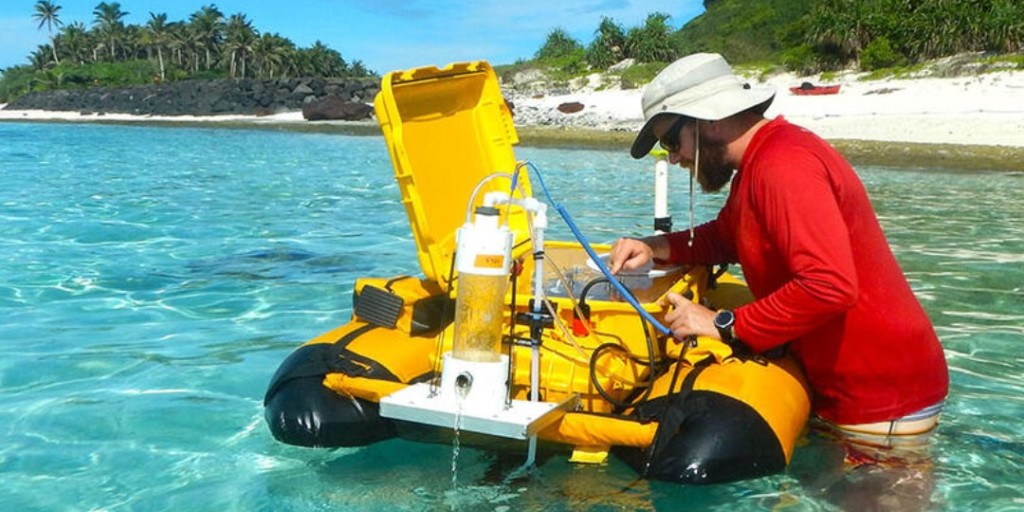
ALT USGS physical scientist installs a special buoy in the waters of the National Park of American Samoa on Ofu in the Manuʻa Islands Group. The special buoy, developed by USGS scientists, measures radon on the reef, which is a marker of submarine groundwater.
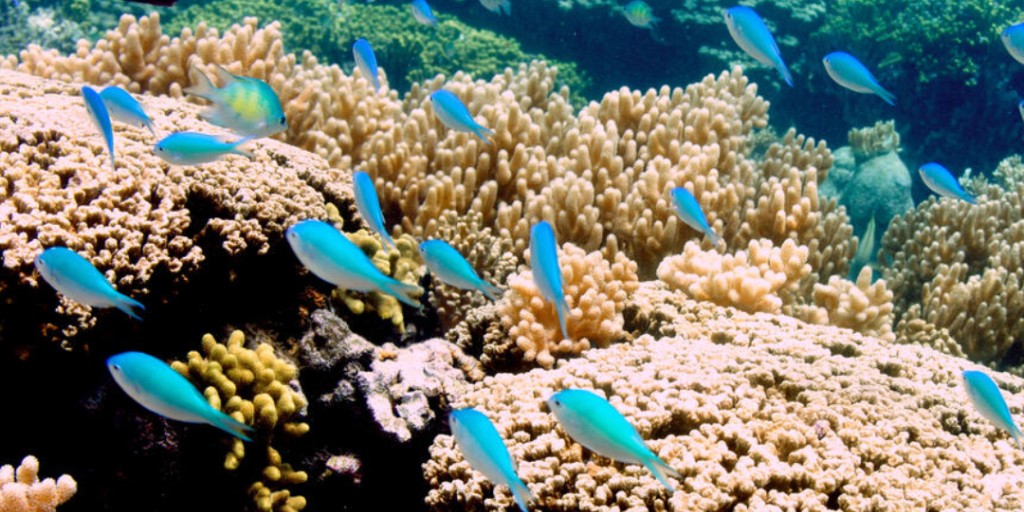
ALT A healthy coral reef in the Tumon Bay Marine Preserve off Tumon, Guam, showing several different species of fish swimming over a high coral cover reef composed of hard and soft coral species.
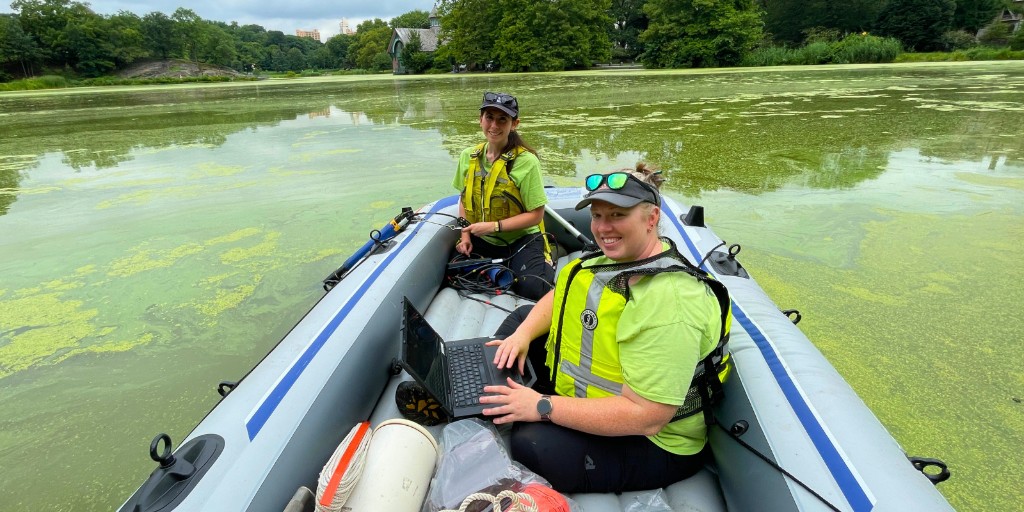
ALT USGS staff use an inflatable rowboat to conduct water quality sampling in 6 different lakes of Central Park in New York City during summer 2025. Photos by Rebecca Gorney, USGS
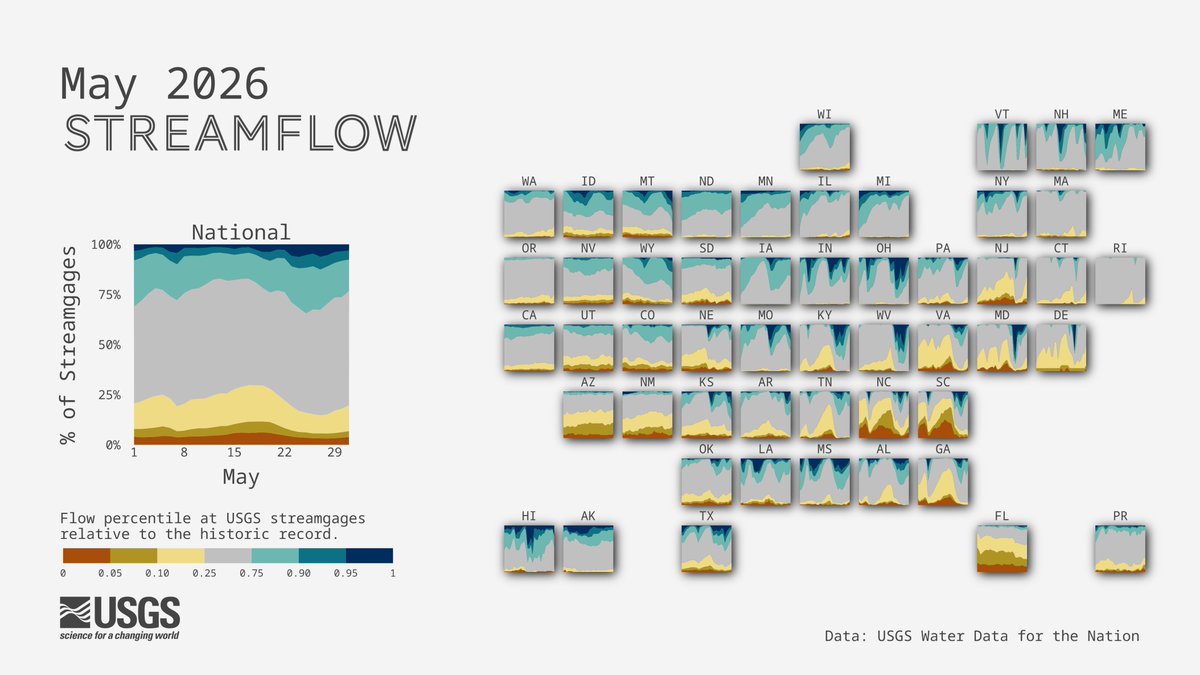
ALT 📸: Tile charts showing national streamflow conditions for May 2026 by flow percentiles at USGS streamgages relative to the historic record across the U.S. Flow percentiles are broken up into seven bins from 0-100% where increased percentiles indicate wetter conditions.
ALT GLRI large river sampling on the Canadian side of the St. Lawrence River near Morristown, New York, on board the new Research Vessel Osprey. Photo 1 by Andrew Kowalczk, USGS
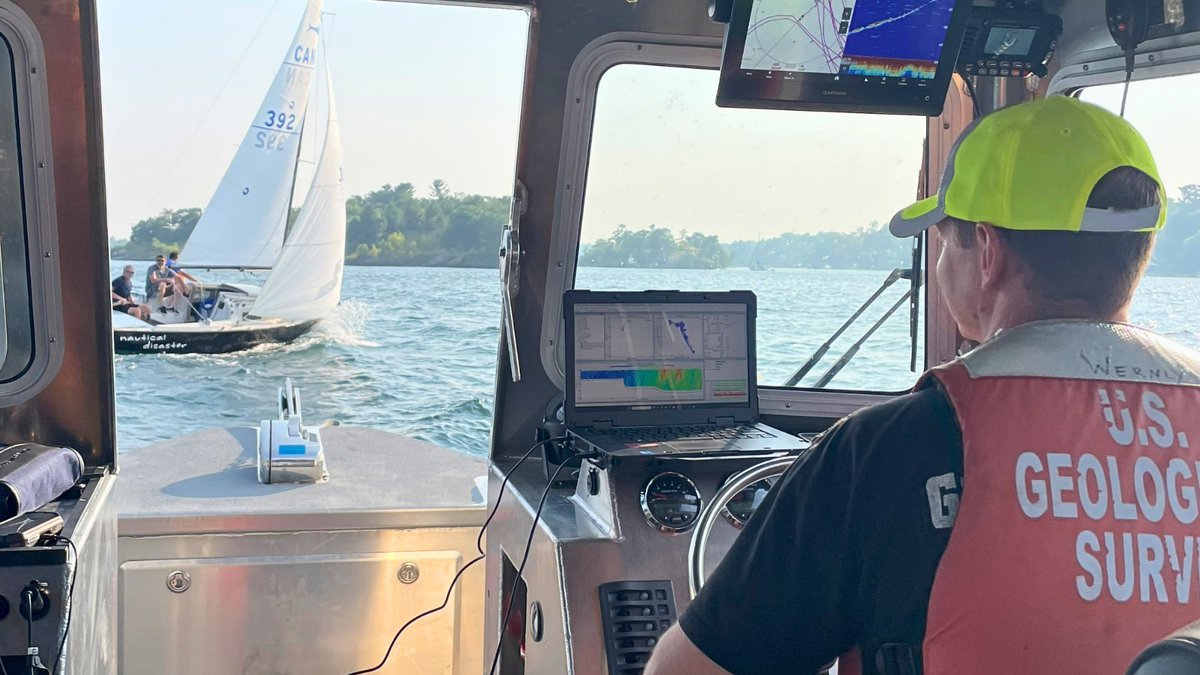
ALT GLRI large river sampling on the Canadian side of the St. Lawrence River near Morristown, New York, on board the new Research Vessel Osprey. Photo by Andrew Kirby, USGS
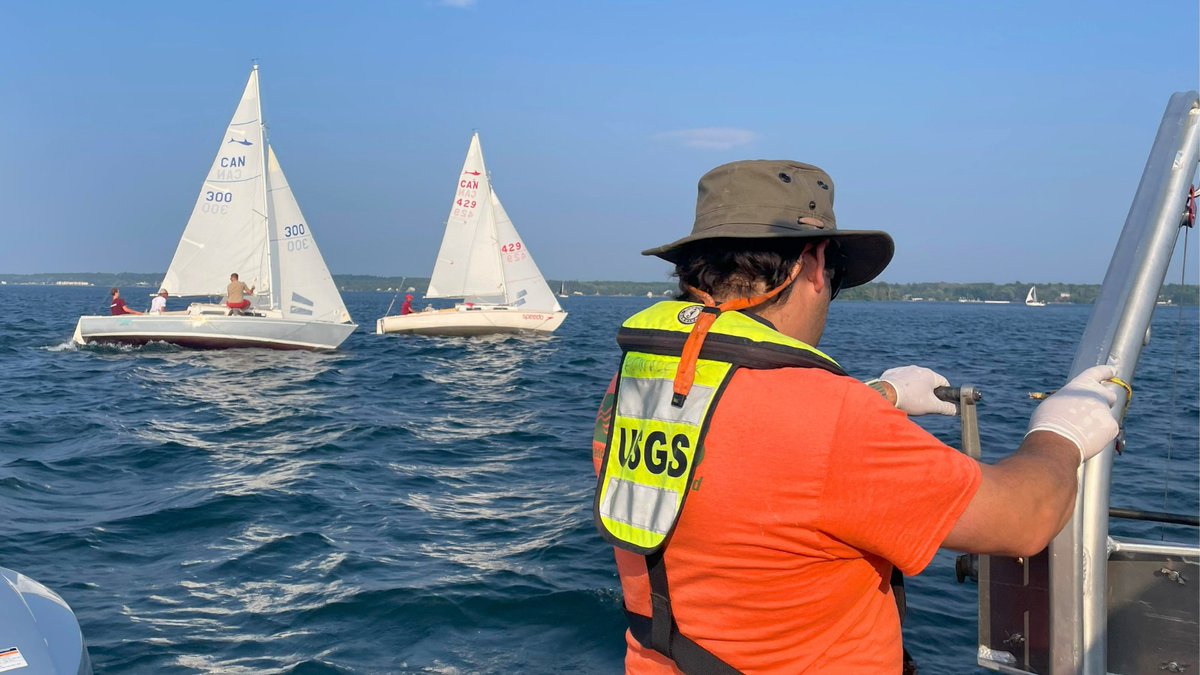
ALT GLRI large river sampling on the Canadian side of the St. Lawrence River near Morristown, New York, on board the new Research Vessel Osprey. Photo by Andrew Kirby, USGS
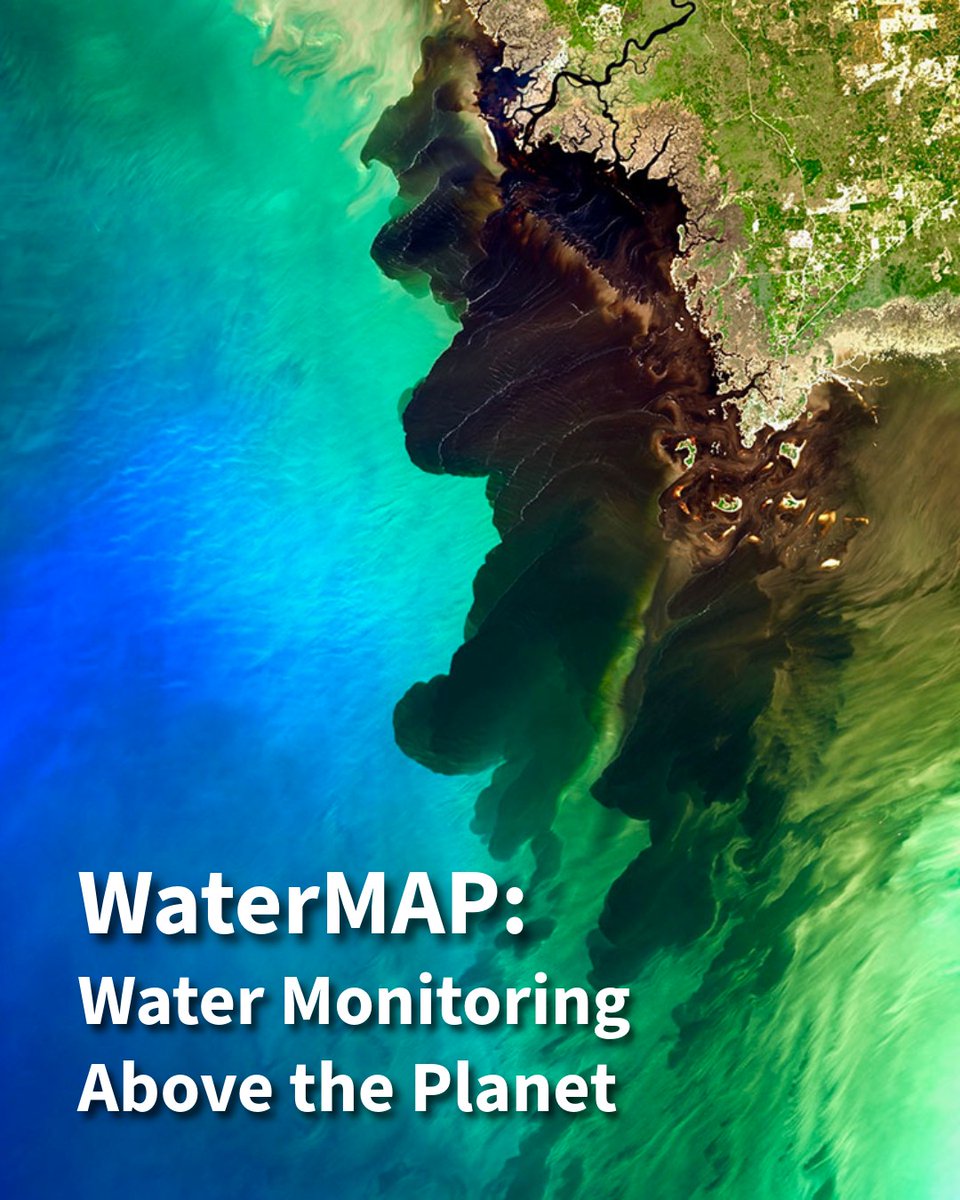
ALT In this image from the NASA-U.S. Geological Survey Landsat 8 satellite, the dark-brown waters of the Suwannee River meet the blue-green Gulf of America along Florida’s Big Bend (where the state’s panhandle curves to meet its peninsula). Credit: @nasa /USGS/A. Alonso
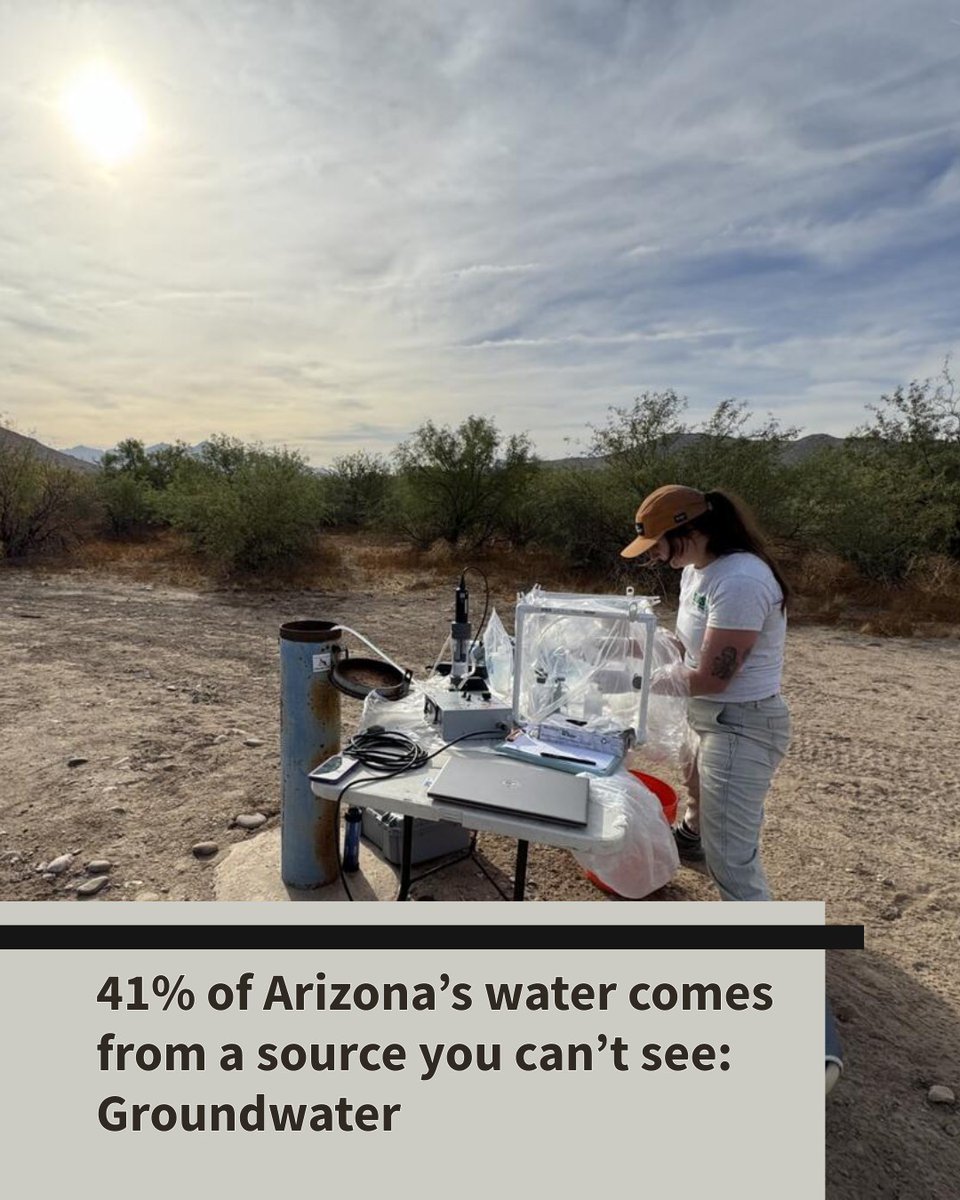
ALT USGS hydrographer collecting water quality samples for a salinity monitoring project along the Lower Gila River, AZ, December 2024. Photo by Jessica Anderson, USGS.
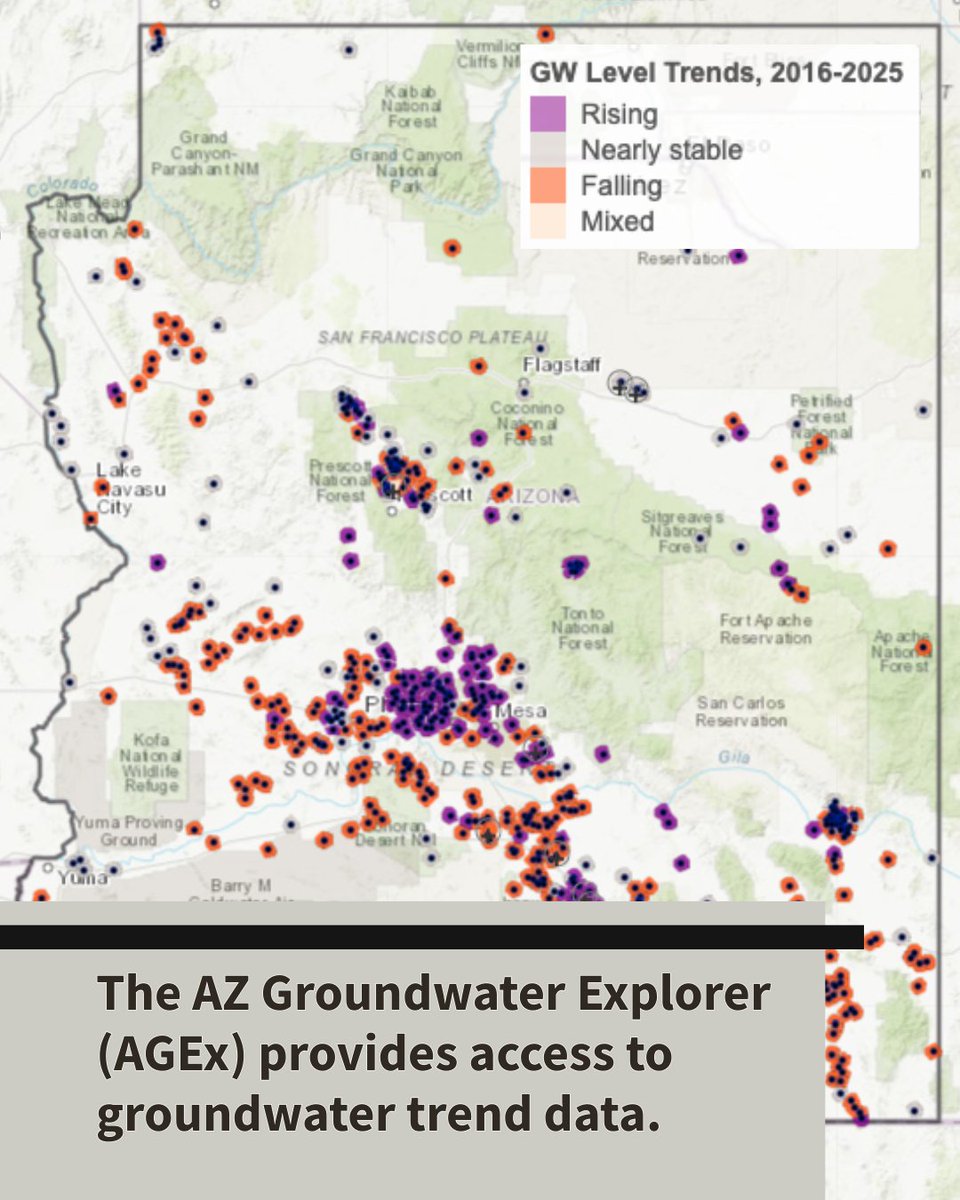
ALT Screenshot of groundwater trends data from AGEx.
ALT Montana is known for its fishing opportunities, especially its cold-water trout fishing. Here, someone is fishing in Big Hole River, Montana.
ALT Stopping to smell the flowers during routine water quality sampling at Canajoharie Creek, New York. The gage, visible in the background, is part of the USGS NQWN sampling network. Photo by Sabina Gifford, USGS

ALT Routine water quality sampling at Canajoharie Creek, New York. Photo by Sabina Gifford, USGS

ALT Routine water quality sampling at Canajoharie Creek, New York. Photo by Sabina Gifford, USGS

ALT A USGS hydrologist stands along the bank of Canajoharie Creek, a tributary of the Mohawk River in New York. Photo by Sabina Gifford, USGS
ALT Following recent rainfall, USGS hydrotech collects a storm sample from the Susquehanna River at Conowingo, MD. Photo by David Fisher, USGS.
ALT A USGS hydrologist conducts horizontally-integrated synoptic water sampling of the James River at Cartersville as part of the USGS's nontidal network monitoring efforts. Photo by Rowan Johnson, USGS
ALT Discrete water quality, bacteria, and microbial sample collection for the Independence Storm Water project in Missouri on Adair Creek.
ALT Preparing to launch a boat on the Missouri River at Jefferson City, MO.
ALT Processing a bacteria sample collected from the Grand River near Sumner, MO, to determine Total Coliform and E. Coli concentrations in the river.
ALT A high-water mark captured using a known elevation from the CSG for the peak rainfall event of the year at Little Osage River near Horton MO.
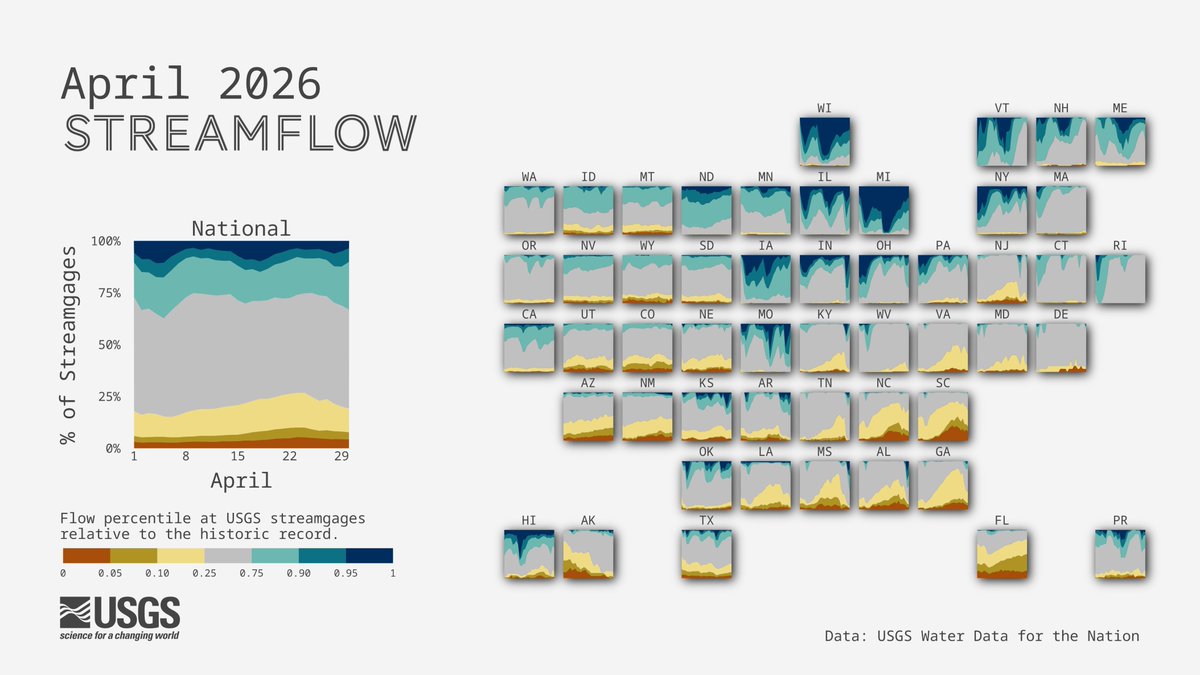
ALT Tile charts showing national streamflow conditions by flow percentiles at USGS streamgages relative to the historic record across the U.S. Flow percentiles are broken up into seven bins from 0-100% where increased percentiles indicate wetter conditions.
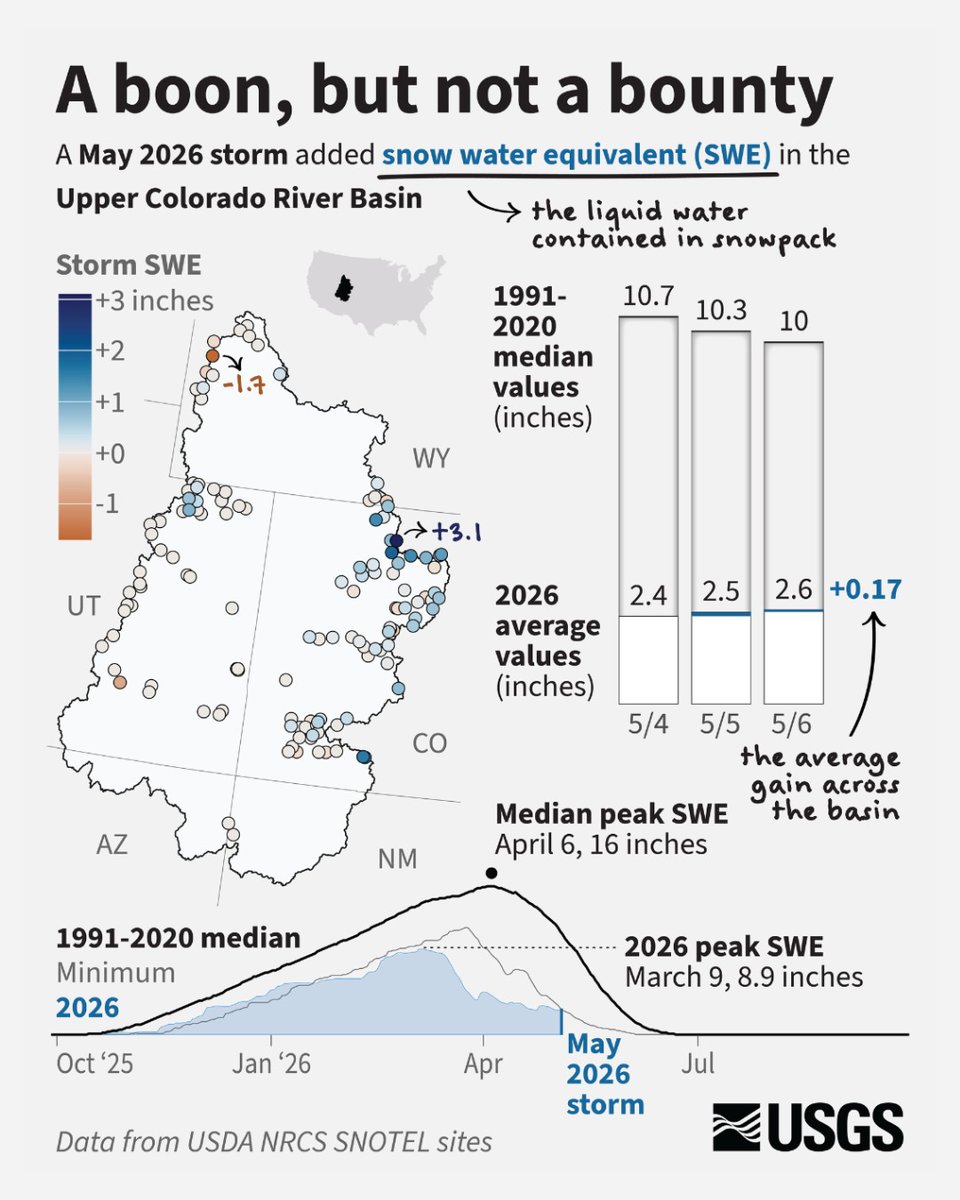
ALT Infographic showing added Snow Water Equivalent in the Upper Colorado River Basin as a result of the May 2026 snowstorm. Data from USDA NRCS SNOTEL sites.