
Scientist, Theorist, Father, Memphian, he/him
Joined March 2018
- Tweets 1,709
- Following 639
- Followers 647
- Likes 4,313
39 Photos and videos


May 22
“Second thoughts about first principles in biology”: Trends in Ecology & Evolution. Thought-provoking paper to be part of that was fun to work on with since heart other scientists. cell.com/trends/ecology-evol…
1
69
Van Savage retweeted

Mar 26
The brain has evolved a voracious appetite for energy, consuming about 20% of our daily total. So what makes that cost worth it?
At a recent SFI working group, researchers from across disciplines examined how the high energetic cost of intelligence is balanced against its evolutionary advantages, and began charting a mathematical foundation for understanding that tradeoff.
santafe.edu/news-center/news…

12
32
135
9,698
Feb 6
New work on fitting temperature respsonses using minimal parameters w/ easily biologically interpretable & intuitive parameters for most any observed shape: A flexible model for thermal performance curves - Cruz‐Loya - 2026 - Ecology - Wiley Online Library esajournals.onlinelibrary.wi…
1
1
56
Feb 6
Research and paper led by the fantastic Mauricio Cruz Loya @monochrome_keys and with the wonderful Erin Mordecai @morde
47

Buttigieg: In a country that amended its constitution so you could not purchase a beer and then realized it was a bad idea and amended it back, surely we can have an amendment clarifying that a corporation is not a person and money is not speech.
806
9,984
68,093
2,437,401
Van Savage retweeted
30 Dec 2025
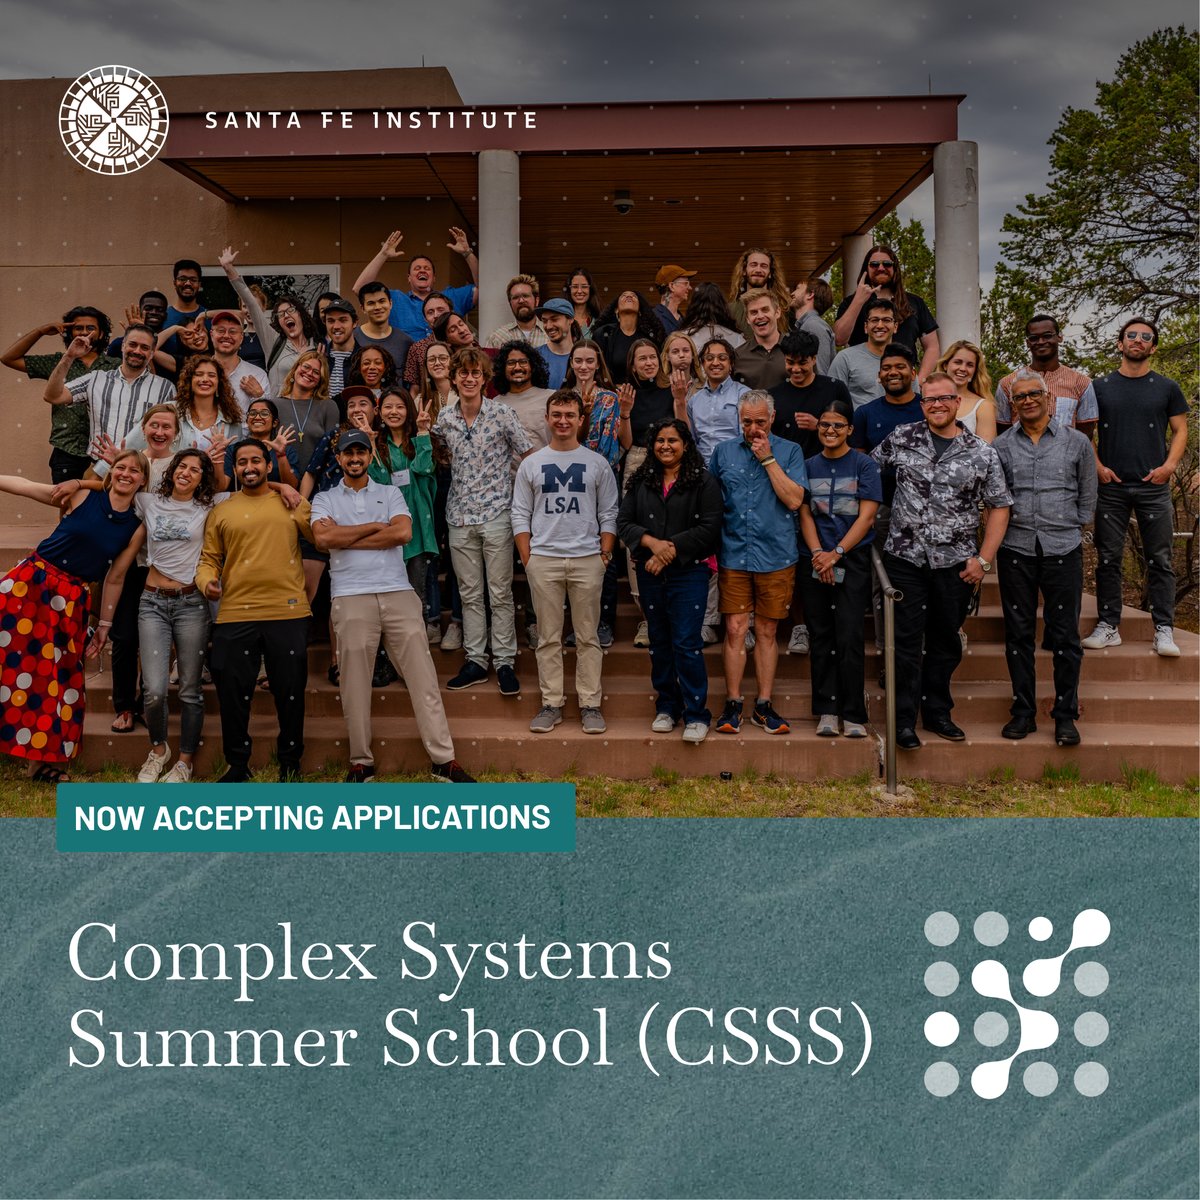
Now accepting applications for SFI’s 2026 Complex Systems Summer School (CSSS).
CSSS is a three-week experience that brings together graduate students, postdoctoral fellows, and professionals to explore foundational theory and methods, engage in collaborative projects, and connect with a global research community.
Deadline: February 4, 2026
Apply here: santafe.edu/csss
1
28
101
9,080
Van Savage retweeted
5 Dec 2025
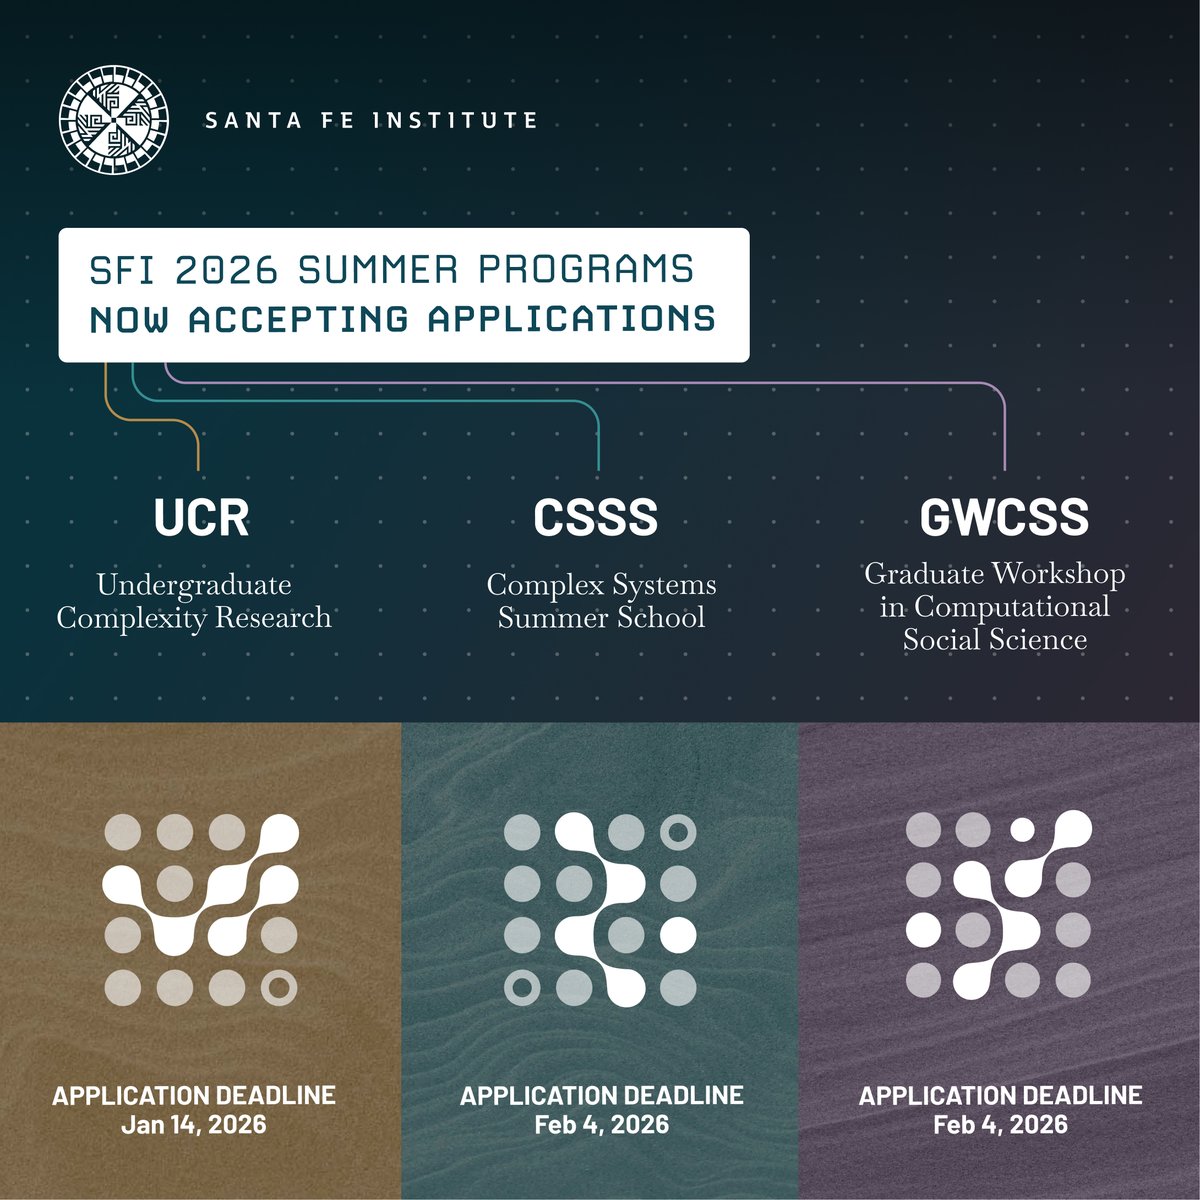
Applications are open for SFI’s 2026 summer education programs.
Three residential programs in Santa Fe, NM, offering research and training opportunities in complexity science:
– Undergraduate Complexity Research (UCR) / Ten-week research experience for undergraduates.
Apply by Jan 14, 2026
– Complex Systems Summer School (CSSS) / Three-week intensive program for grad students, postdocs, and professionals.
Apply by Feb 4, 2026
– Graduate Workshop in Computational Social Science (GWCSS) / Two-week workshop for Social Science Ph.D. students and early-career researchers.
Apply by Feb 4, 2026
Learn more: santafe.edu/engage/learn/pro…
1
16
51
5,452
Van Savage retweeted

1 Dec 2025
I understand that p in ideal cases --> 0 as N --> inf. But that is not the issue. With real data collected from real experiments these values - for reasons others have explained - are likely massive overestimates of the confidence in rejecting the null. This is almost certainly the case with the example I was pointing to.
x.com/mbeisen/status/1995154…
30 Nov 2025

I spent time on the plane home yesterday looking at the details of this p-value calculation, and here's what I'd say.
1) I don't think the authors erred in a literal sense in reporting this number. A p-value of p < 1×10⁻³⁰⁰ isn't narrow sense insane. With ~300,000 individuals, ~9,000 CAD events, a hazards ratio of 1.59 and a very small confidence interval [1.55–1.62], gets you a test statistic of 42 ish, which if you use a normal approximation produces an absurdly small tail probability.
2) However, that calculation is conditioned on a number of assumptions - proportional hazards, independence of errors, correct variance estimation, absence of residual confounding, absence of residual population structure, that the polygenic score is known without error, and others. Even minor departures from these assumptions, coupled with uncertainty in the construction of the PRS, would swamp the nominal tail probability. (This paper makes this point arxiv.org/pdf/2412.20611).
3) So, in general, I think we would be well-served by being more numerically humble and accepting that high-dimensional prediction induces substantial uncertainty that classical p-values do not capture well. And while I think we can all agree that the odds that the observed relationship was the result of a sampling error are very low, reporting this as p < 10⁻³⁰⁰ exaggerates that strength of the evidence for that claim, and more importantly adds false weight to the more relevant quantities: the effect size (HR per SD), its robustness across models and populations, and the limited incremental predictive utility of PRSs in the clinical settings.
4) I stand by my claim that this p-value - while primarily a byproduct of large sample size - also represents the use of a model that is not fit for the task. And the fact that a model that would produce an "accurate" p-value (whatever that means) doesn't justify reporting values from one that are both not likely to be correct, and which are of no practical value.
4
2
23
4,454
Van Savage retweeted
29 Nov 2025
Biology is not random. And so if you measure any aspect of it a lot of times and compare your data to a random model you will eventually rederive this fact. The problem with absurdly small p-values is that, because you can essentially always get them by juicing your sample size, when you see something like p < 10^-300 what it’s really saying is THAT biology is non-random, which we already knew, and not HOW it is non-random, which is what we really care about.
28 Nov 2025
The first rule of Data Science - if your p-value is less than 1 over the number of atoms in the universe, you're using the wrong model.
16
21
251
42,838
Van Savage retweeted
17 Nov 2025
As an undergraduate researcher at SFI in 2018, Sahana Subramanyam encountered a place where ideas moved freely between disciplines and mentors encouraged exploration. Her experience in the Undergraduate Complexity Research (UCR) program helped shape her path to a Ph.D. at Stanford and a research career focused on social inequality.
For undergraduates curious about complex systems research, applications are now open for the 2026 UCR program — a fully funded, 10-week summer research experience at the Santa Fe Institute.
- Read Sahana’s essay: santafe.edu/news-center/news…
- Apply by Jan. 14, 2026: santafe.edu/ucr

5
24
4,121
30 Oct 2025
Shark Data Suggests Animals Scale Like Geometric Objects quantamagazine.org/shark-dat… via @QuantaMagazine
1
2
181
5 Sep 2025
Piece in The Scientist about the remarkable new sleep paper by @RafSarnataro with quotes from yours truly. the-scientist.com/animals-sl…
1
2
13
436
13 Aug 2025
I also want to highlight work (1 in JTB and 1 abt to appear in AmNat) that I found right before my PNAS commentary came out that I wish I’d referenced. Shout out to Kevin Archibald, Stephanie Dutkiewicz, Charlotte Laufkötter, and Holly Moeller @mixotrophe on this fantastic work!
1
2
177
13 Aug 2025
This one starts w/ similar equations to understand how environment (e.g. temperature) drives tradeoffs in plasticity, memory, & nutrient storage to let mixed metabolic strategies coexist thru seasons, thus going beyond equilibrium/optimal physiology sciencedirect.com/science/ar…
1
112
13 Aug 2025
And this deep follow-up that adds in evolution and focuses on temperature. These papers show that intermediate plasticity can be best (even without an explicit physiological cost to plasticity), and how plasticity and evolution can work together. journals.uchicago.edu/doi/pd…
119
13 Aug 2025
My new commentary extolling a new PNAS paper about temperature and phenotypic memory in phytoplankton by Anderson, Fey, Meier, Vasseur, and Kremer! Remembrance of phytoplankton’s past | PNAS pnas.org/doi/full/10.1073/pn…
7
209
Van Savage retweeted

22 Jul 2025
1/ 🚨 Our new paper is online in @Nature !
As its first author, I’m enthusiastic to finally share it with you all!🎉
🧠 We discovered a mechanistic link between cellular energy metabolism and the control of the need to sleep 💤
👉 nature.com/articles/s41586-0…
@OxfordDPAG 🧵👇
13
129
690
51,719
Van Savage retweeted

18 Jul 2025
I can’t get this line out of my head since reading it at the end of the abstract for this paper:
“Sleep, like aging, may be an inescapable consequence of aerobic metabolism.”
nature.com/articles/s41586-0…
13
42
260
20,851
Van Savage retweeted

16 Jul 2025
Thank you to organisers Dustin Marshall and Craig White and everyone who joined us for this week's Workshop 'Why Are Cells the Size They Are?'
biologists.com/workshops
#BiologistsWorkshops

5
11
1,101