
Head of Humanities I Geography Teacher | Subject Lead | MA Leadership in Learning 🌳
Joined August 2018
- Tweets 809
- Following 642
- Followers 832
- Likes 2,423
99 Photos and videos


Pinned Tweet

25 Nov 2023
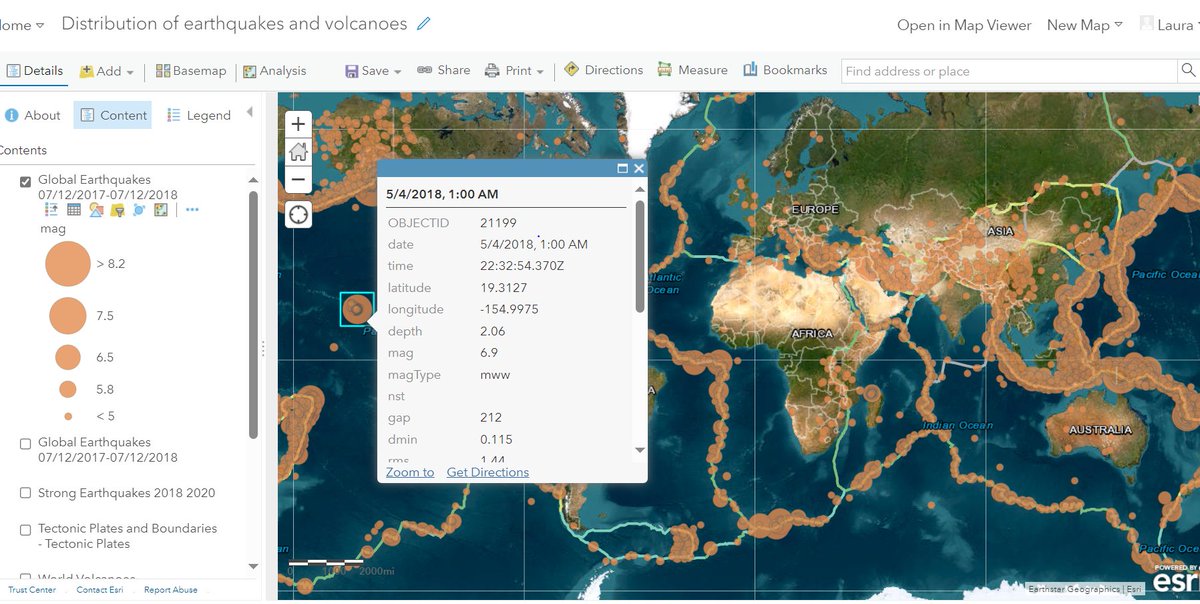
I used to print maps to teach the distribution of earthquakes and volcanoes. Not only did this cost money (colour printing😆) but I never really felt that students grasped what I wanted them to. So after watching videos mainly @lcgeography (thank you!) I now use GIS! 🧵
6
26
148
38,232
Jan 19
How does everyone teach the strategies for reducing the development gap? I need inspiration!! #geographyteacher
1
3
72
16 May 2025
How do you teach river processes? I find it is so abstract for my pupils. We do a river study for our fieldwork so this does help. However any tips?!! I need ideas. #geography #geographyteacher
2
1
415
Laura Wells retweeted

20 Mar 2025
20 local geography school teachers from Preston, Lytham, Lancaster, Blackpool and Chorley meeting up to research AQA GCSE geography’s pre-release on the proposed Morecambe Bay Barrage Scheme. Can anyone help us bring the issue to life for our students? @timfarron @CatSmithMP
4
7
14
2,457
4 Mar 2025
Today Y7 used GIS to explore the distribution of biomes across Asia. In Y7 we focus on adding layers, interpreting the legend and using the location tool. This helped us to develop our knowledge of latitude from a previous unit. We had some fab descriptions! #GIS

1
2
27
848
6 Jan 2025
Putting on the work trousers was a humbling experience this morning 😂😆🤣
4
432
Laura Wells retweeted
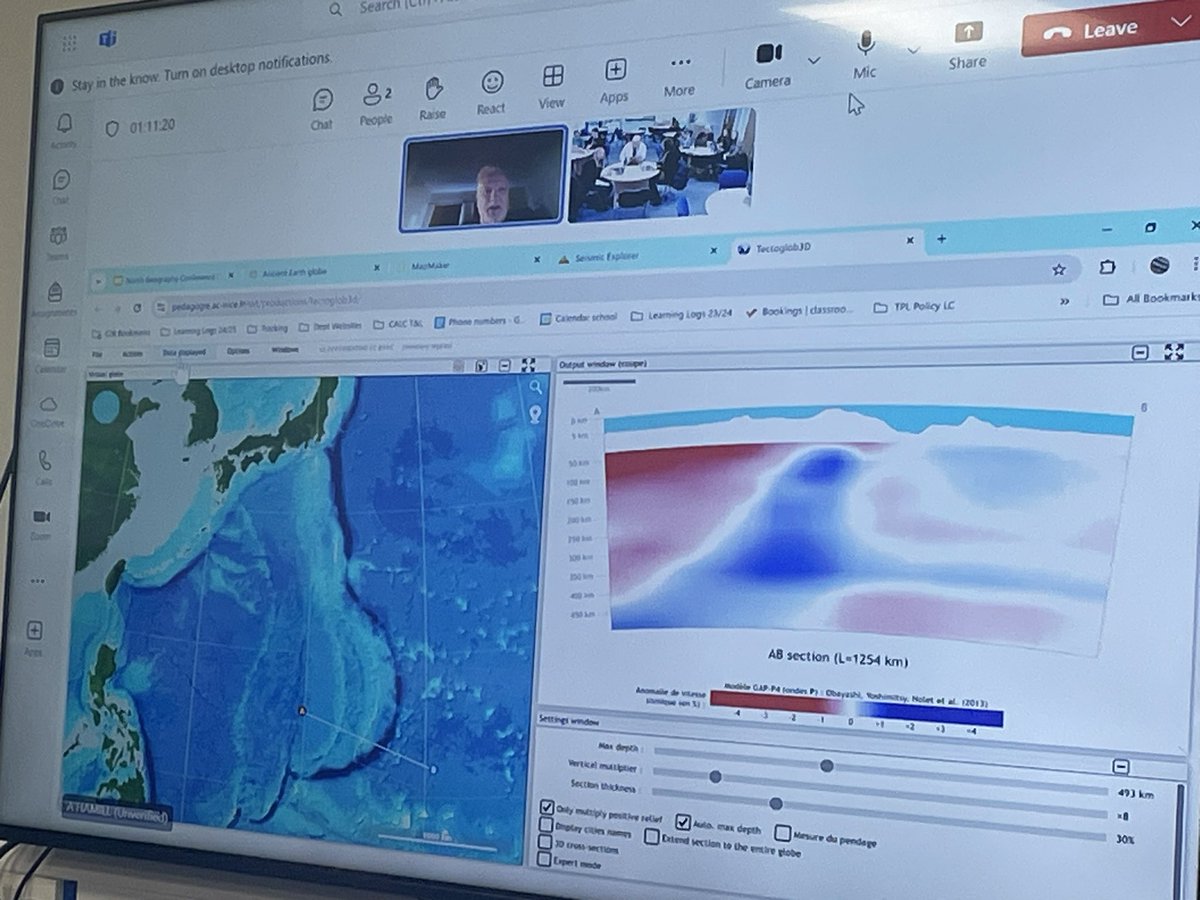
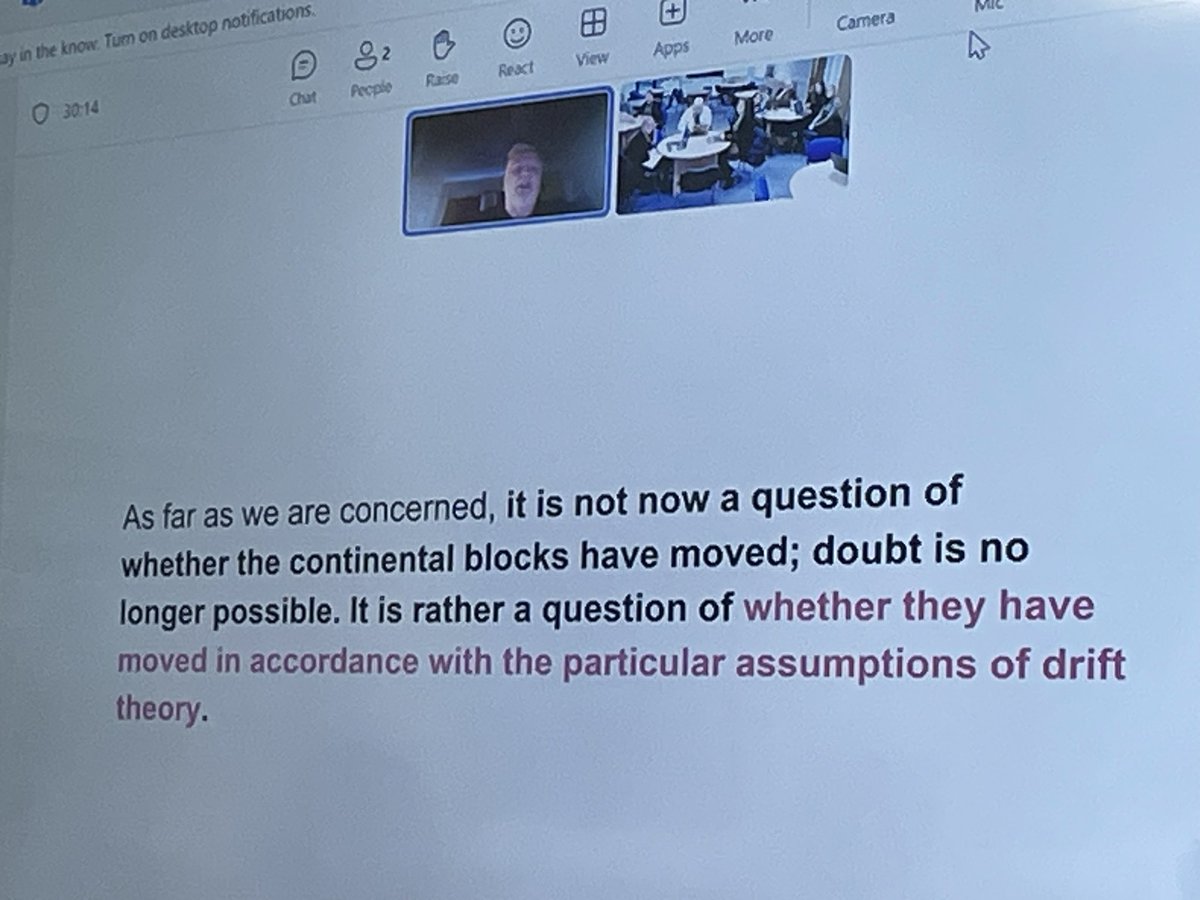
31 Oct 2024
Best start to the day. Superb CPD on current tectonics theory and GIS wizardry from the wonderful @lcgeography. Thank you for interrupting your holiday for us again! @WellsGeog @JoannaJvr81 @MrsT_Geography @chrislordgeog #geographyteacher
2
2
5
1,586
26 Oct 2024
Geography planning shout out 📣 ….. Can anybody help? I need some resources on the challenges/opportunities created by urbanisation in Kenya. Does anyone have anything good?! Thank you in advance #geographyteacher
1
1
466
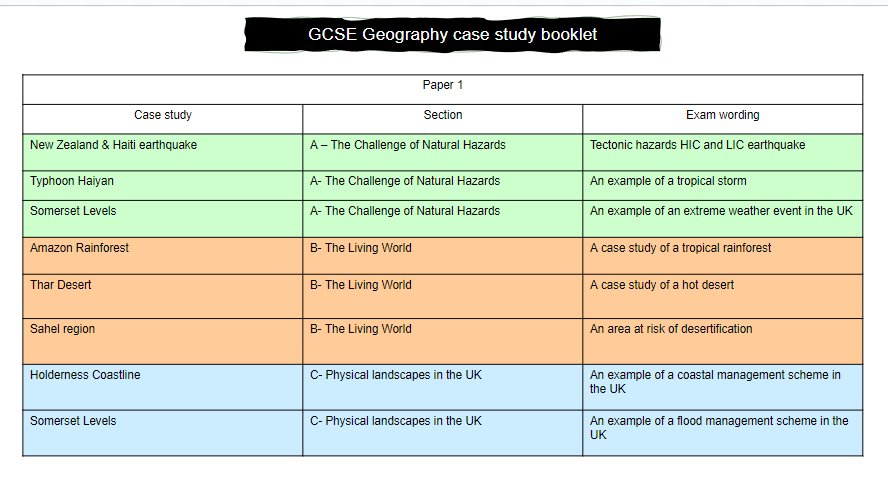
22 Oct 2024
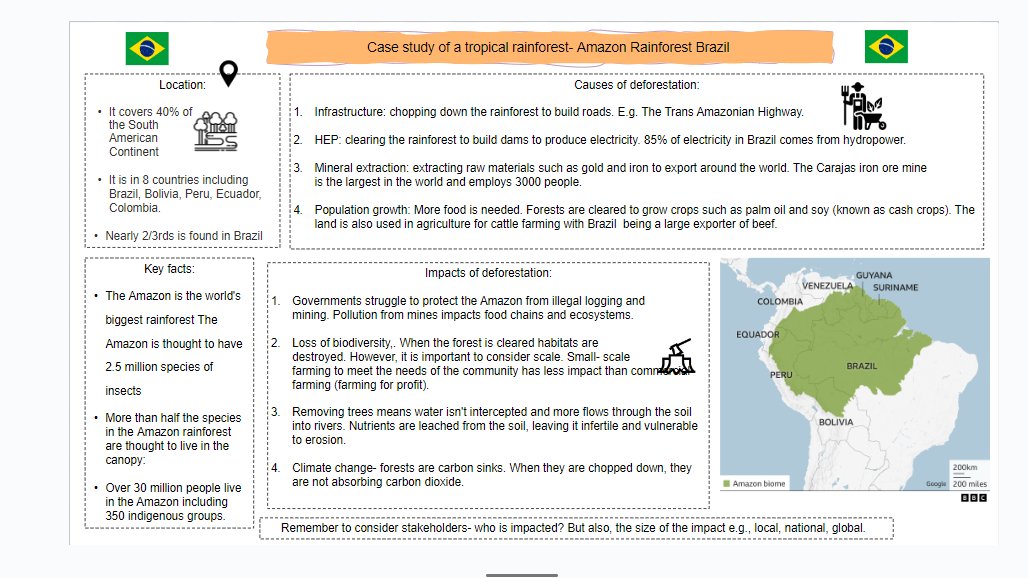
I have put together a case study booklet for our GCSE Geographers to hopefully help with studying for their mock exams. I know these can be a pain to put together! #geography #geographyteacher
docs.google.com/presentation…
4
6
97
7,072
21 Oct 2024
Here are some of the GIS resources I used this half term with my classes! Many of them ready to go and already made! #GIS #ArcGIS #geographyteacher
2
9
73
10,146
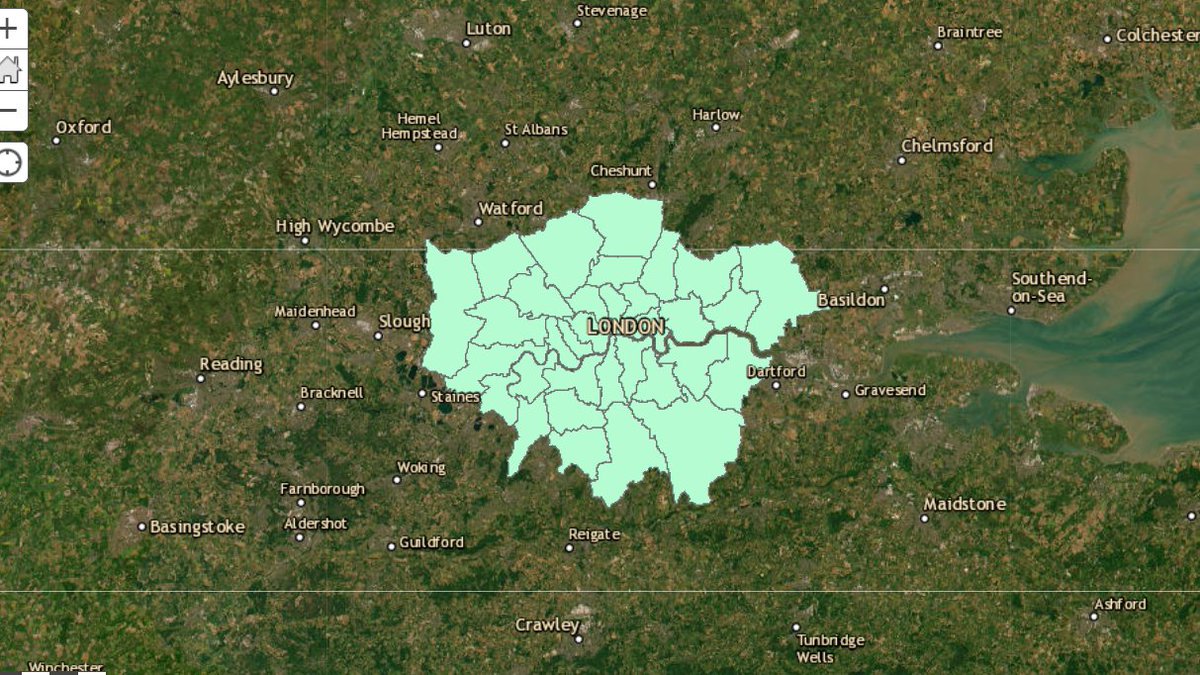
21 Oct 2024
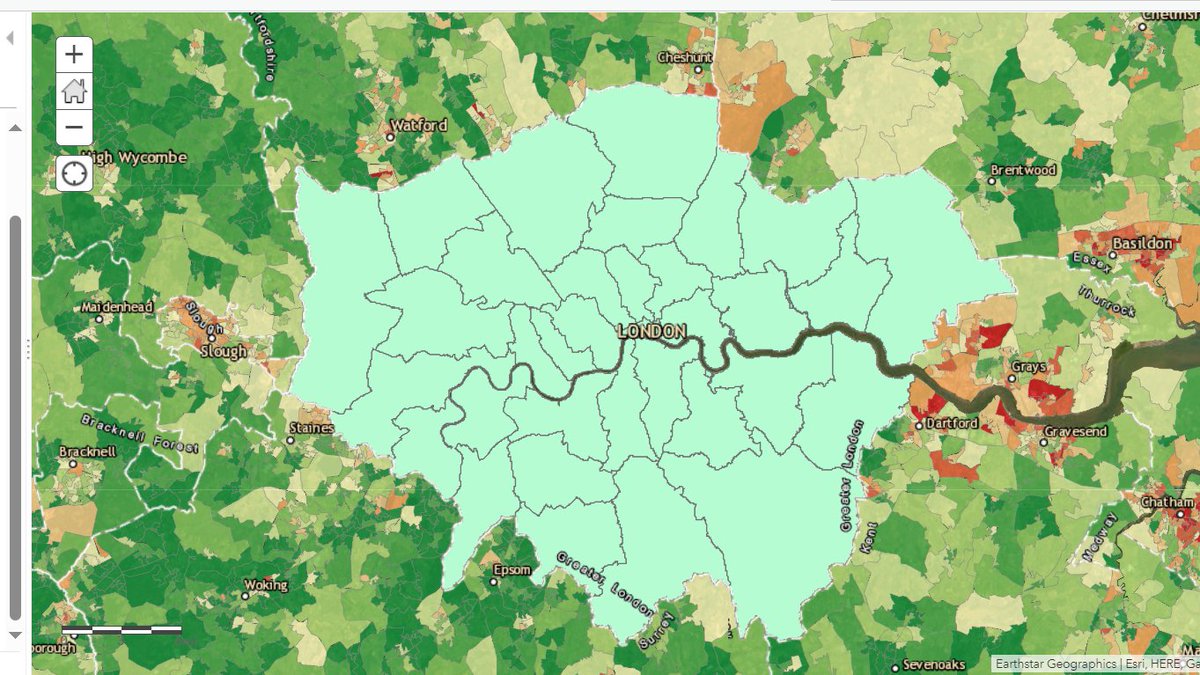
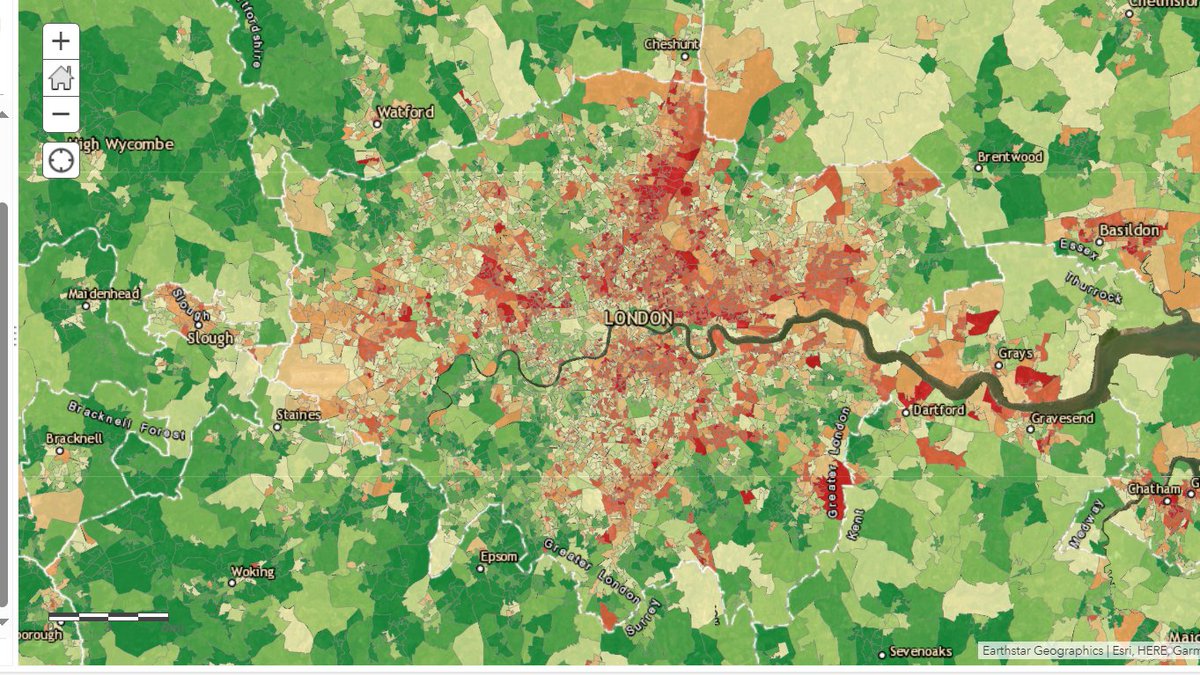
This year I decided to use GIS to teach the challenges in London created by urban change. By flicking between the map of London boroughs and IMD map. We could make comparisons about levels of deprivation between boroughs but also within boroughs.
2
8
790
Laura Wells retweeted

5 Aug 2024
The Islamophobia and racism we are seeing are abhorrent. I agree that as a community Geographers should stand with those experiencing violence and discrimination. Geographical education can be a tool to challenge ignorance and the politics of hate to build more hopeful futures.
5 Aug 2024

Can we have some solidarity #geography community? Muslim, Black and Global Majority people are under attack. Education hasn't worked. Children are impacted the most. You know when you have privilege.
12
25
2,503
Laura Wells retweeted

7 Jul 2024
@mildthing99 @WellsGeog @geojosie @geogwortley @GeogAndy @SteveBraceGeog @MrLGeo @sarahlarsen74 @geography_DAF @DoctorPreece
Please retweet!
2
4
3
913
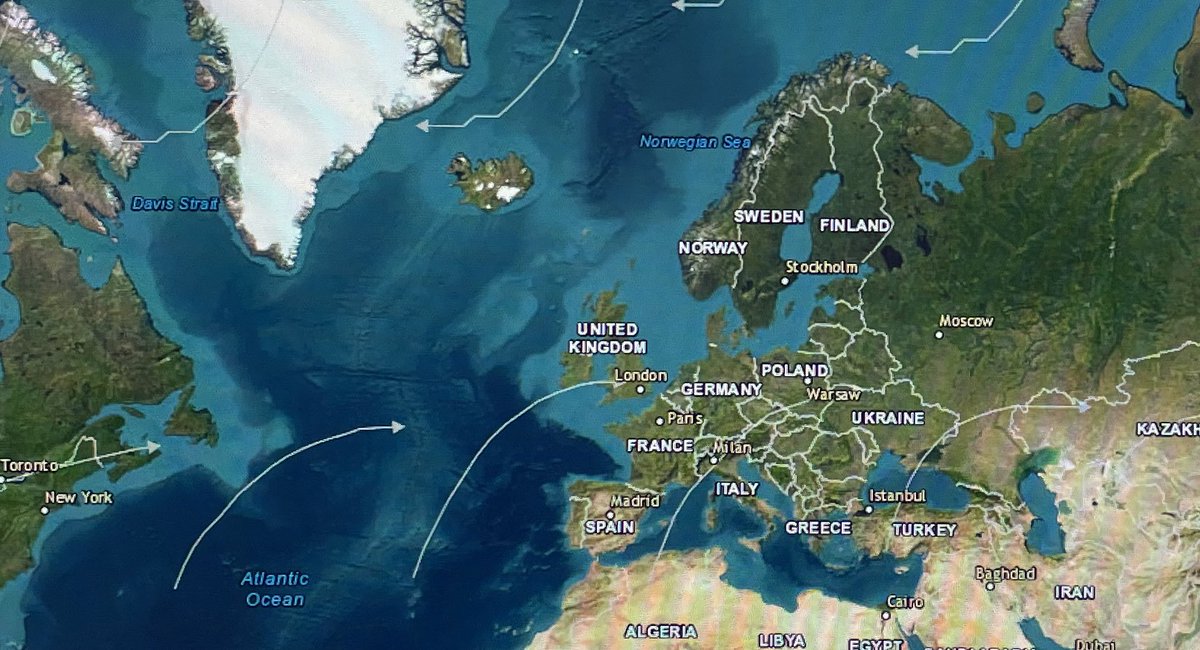
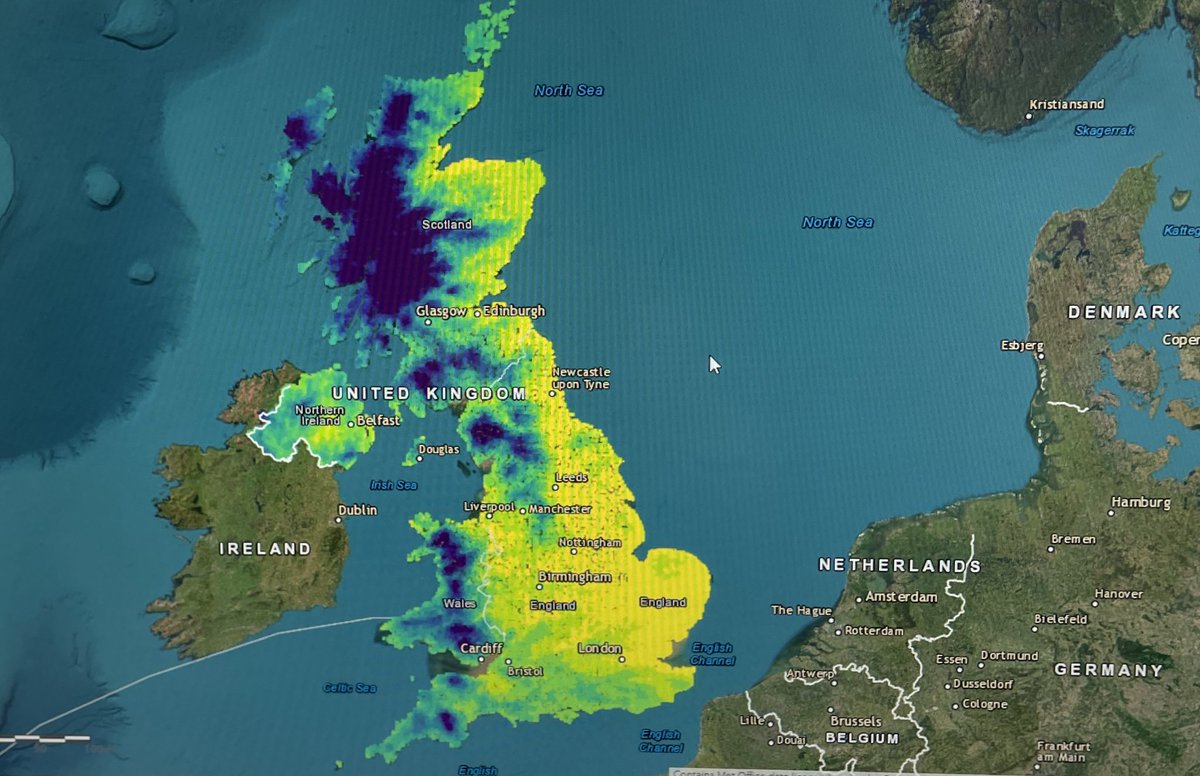
5 Jul 2024
Teaching from the front with GIS today…. Relief rainfall with Y7. Students noticed highest levels of precipitation in the north and west of the UK. We zoomed in and explored specific places that have the highest/lowest levels of precipitation.
5
9
59
8,248
5 Jul 2024
But then we explored why this is….. By removing the layer and exploring the satellite base map pupils predicted that these areas were upland areas. So I said let’s see if you’re right….. (jumps over to scene-viewer) ……I zoomed in and there were even gasps from my class!
1
1
8
657
5 Jul 2024
It was great! As I zoomed into the Scottish Highlands I could feel their curiosity! Right on cue for an explanation of relief rainfall 😂 #GIS #geographyteacher
1
5
542
Laura Wells retweeted

2 Jul 2024
An absolute pleasure to share #GIS lesson ideas resources with exciting 🆕 #LancashireGISNetwork
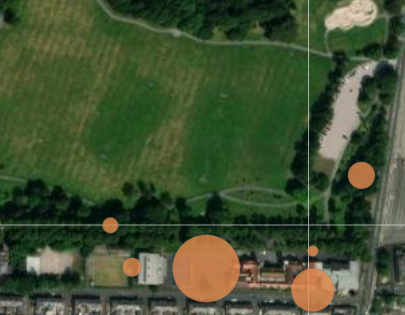
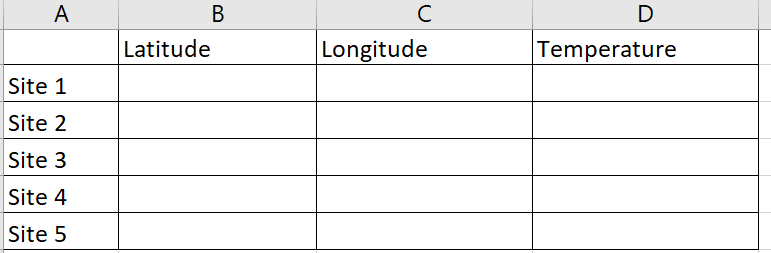
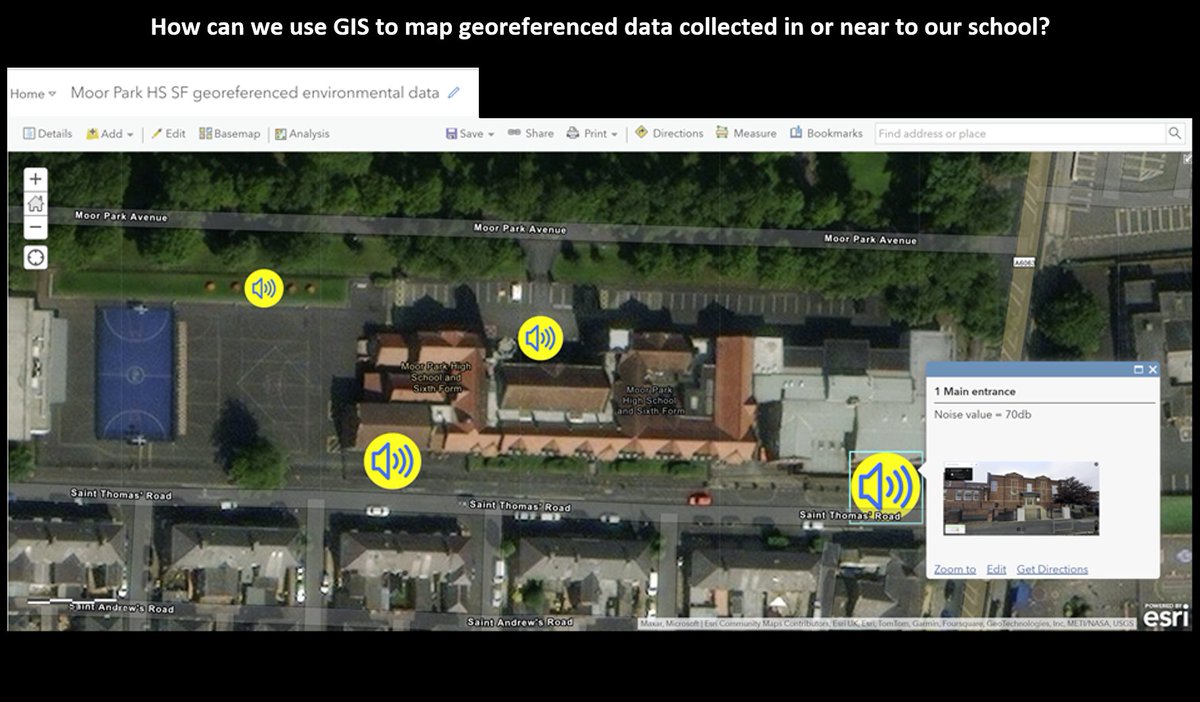
e.g. How can we use GIS to map georeferenced data collected in or near to our school?
Congratulations and thanks to @WellsGeog @GeogWortley for organising such a superb event!
4
7
350