
Visualizing the invisible shifts in the global economy. 🌍 Tracking the signal in the noise. 📊 Economics | Geopolitics | Future Trends
Joined December 2013
- Tweets 410
- Following 363
- Followers 220
- Likes 370
97 Photos and videos


Pinned Tweet

27 Aug 2017
Which Netflix series should you watch? 🍿 Dive into #FeaturedAuthor @singh_rahul0404's viz tabsoft.co/2us11Zq

1
It is rare to see a national economy shrink by 75% without an active war.
Venezuela did it in just 10 years.
From 2012 to 2021, oil production collapsed, inflation hit 130,000%, and $300B in GDP evaporated.
Here is the visualization of the crash. 📉
2
7
This video concludes my 3-part series on the "Global Economy Flip" (Guyana 🚀, G7 vs E7 🔄, Venezuela 📉).
I have compiled the full analysis and the cleaned datasets for all three trends into one report.
Read the full story and download the data here
vizzingdata.com/global-econo…
9
To put this scale into perspective:
During the U.S. Great Depression (the worst economic disaster in modern history), the economy contracted by roughly 30%.
The Venezuelan collapse was more than double that severity.
It is a statistical anomaly in modern records.
3
The "West" is no longer the biggest economic bloc.
Data from the IMF shows the "Emerging 7" (China, India, etc.) overtook the G7 in purchasing power back in 2011.
We are living in a new world order, we just haven't updated our maps yet.
7
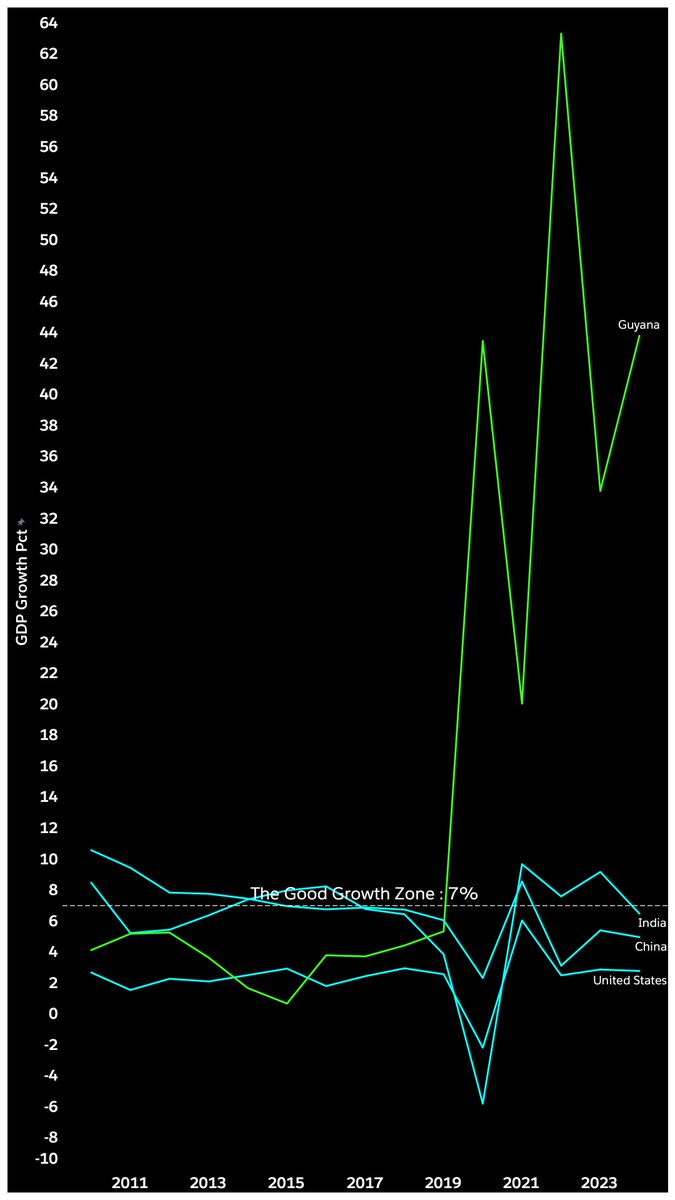
Stop looking at China. You are looking at the wrong map. 🗺️
While the West fights for 2% growth, one tiny nation just hit 40% in a single year.
It is the economic equivalent of winning the lottery.
3
18
To put 40% growth in perspective:
🇺🇸 USA: ~2.5%
🇨🇳 China: ~5%
🇮🇳 India: ~7%
Guyana is growing 5x faster than the fastest major economy. But history tells us this speed is dangerous. "Dutch Disease" is a real risk.
6
The Hidden Giant 🇬🇾
This is Guyana. Population: ~800k.
In 2015, massive offshore oil reserves were discovered. Since then, their GDP has gone vertical.
I analyzed 30 years of World Bank data to visualize this anomaly. Look at the spike:
8
18 Oct 2022
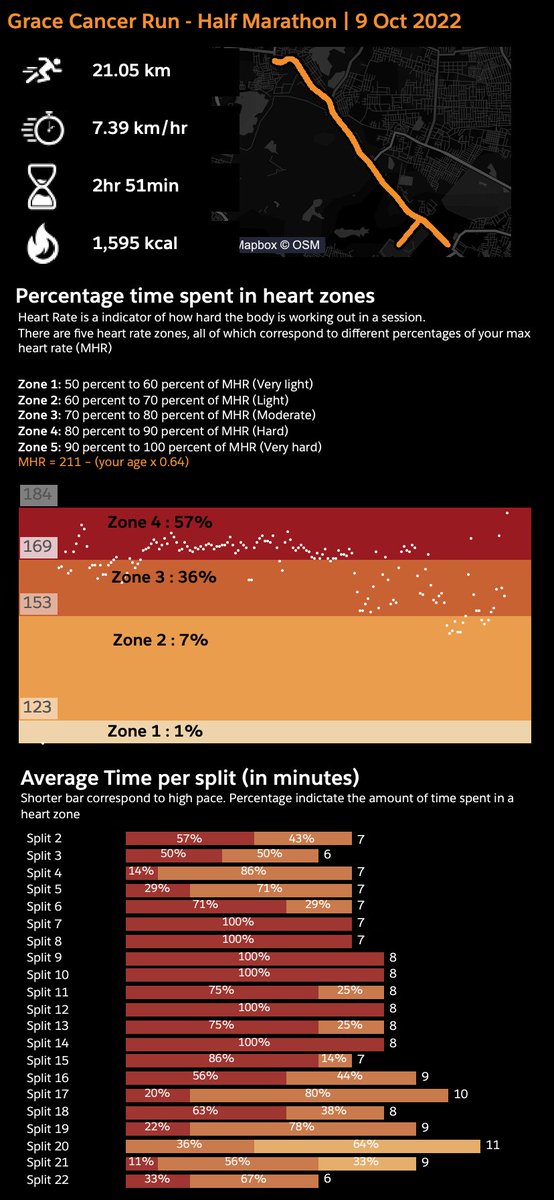
No fun in using apps to track exercise stats until you get you hands dirty. Extracted my last 21km run data and used tableau public to visualise it.
@tableaupublic #datafam #healthdata #21km #halfmarathon #storytelling
tabsoft.co/3yReGbU
25 Dec 2020
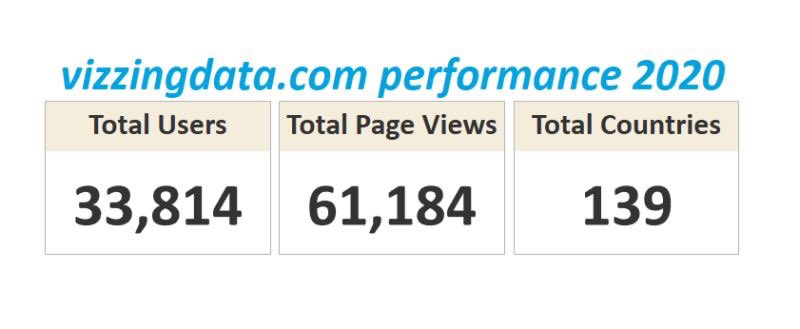
2020 had been a great year for vizzingdata. Our users came from all across the globe and the website had 100 users per day. Thanks to all of you out there for this.
Well 2020 was great and 2021 will be awesome , we have onboarded writers and now #DataFam @tableau @tableaupublic
18 May 2020
Here is the recording for our first virtual meetup on Parameter Actions !!
Many more in pipeline!
@tableau @tableaupublic #datafam
vizzingdata.com/vizzing-data…
1
2
12 May 2020
New vlog section added to our website under tableau tutorial.
vizzingdata.com/category/tab…
@tableau #datafam @dheerajpoojari
12 May 2020
Join us in our first meetup where we discuss about parameter action in Tableau.
Registration is free but seats are limited. Book yours now eventbrite.com/e/vizzing-dat… #datafam @tableaupublic
8 May 2020
It's time for a mobile resume.
Here's my interactive resume on a phone layout created in Tableau .
Interactive Link : tabsoft.co/2WDVIl9
@tableau #datafam #mobileresume #interactiveresume #phonelayout
6 May 2020
New vlog “Intoduction to parameter actions in Tableau”
youtu.be/SrxoMDFBOLY Subscribe to our channel and follow us for upcoming blogs !! @tableau @tableaupublic

1
1
5 May 2020
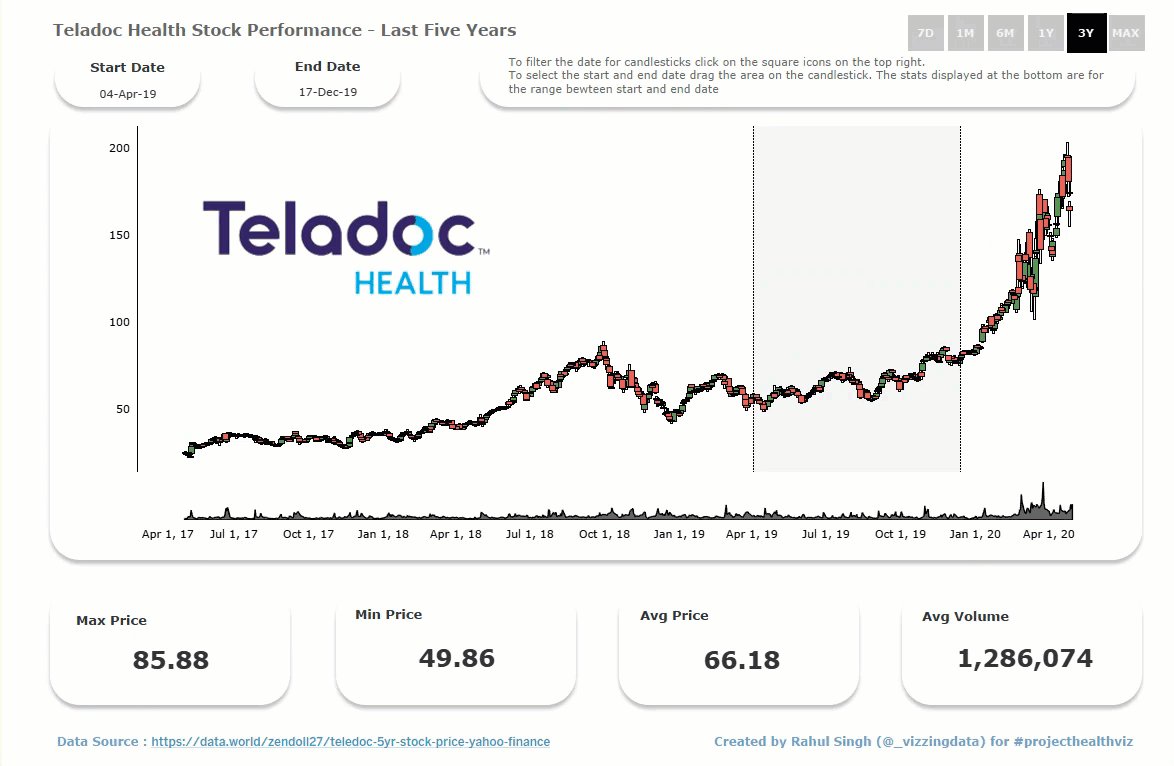
Had been thinking of visualizing stock charts since long. Here was the opportunity.
My submission for May #projecthealthviz #candlestickchart
@ZenDollData @tableau @tableaupublic #datafam @TeladocHealth
Interactive Link: tabsoft.co/2xDy9Rd
1
13
28 Apr 2020
Historical Fuel Prices
For This week #MakeoverMonday I used #parameteractions and #animations. @tableau @tableaupublic
Tableau public Link : tabsoft.co/3cZ1rZz
1
4

Coronavirus updates:
- Iran: 966 new cases, 123 new deaths
- Belgium: 558 new cases, 30 new deaths
- Austria: 278 new cases
- Israel: 178 new cases
- Malaysia: 153 new cases, 1 new death
- Thailand: 89 new cases
- Philippines: 77 new cases
bnonews.com/index.php/2020/0…
182
1,876
3,650
18 Mar 2020
Have been using Tableau Public for the last three year and todays #makeovermonday viz was my 111th viz on Tableau Public. @tableaupublic @tableau #datafam
2
11
18 Mar 2020
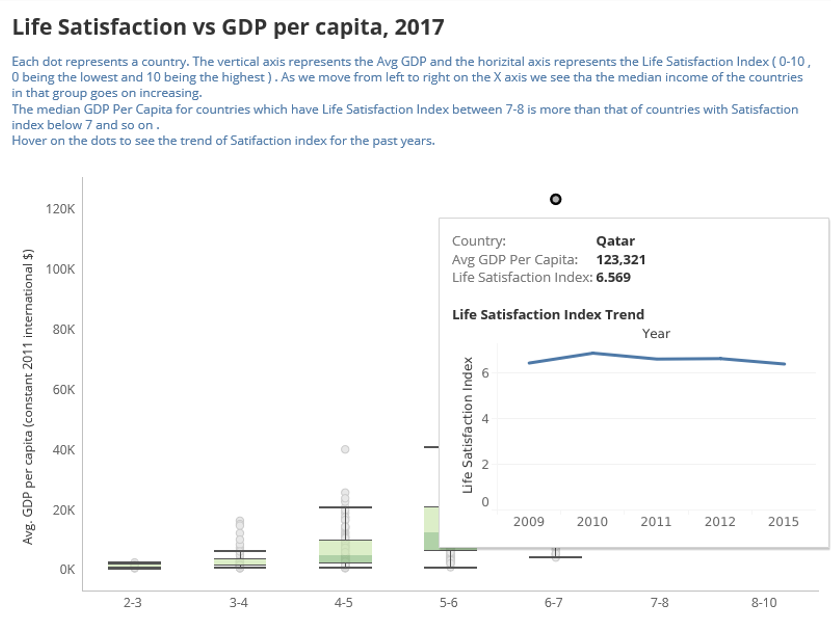
Life Satisfaction vs GDP
Rich countries are generally happier than poor ones.
Here is my submission for #makeovermonday W11
#vizintooltip #boxplots
@tableau @tableaupublic
Interactive Link : tabsoft.co/2w4TFgZ