Founded and engineered the technology we use to dominate markets at @ElixirTrading
Joined December 2020
- Tweets 3,064
- Following 603
- Followers 2,905
- Likes 3,409
532 Photos and videos


Was pretty obvious
Jun 13

As a result of a US government directive, we are suspending access to Claude Fable 5 for all users. You can continue to use all other Claude models.
Here’s what this means for you:
Across Claude products, new sessions will run on your selected default model or Opus 4.8, and existing Fable 5 sessions will end with an error.
On the Claude Platform, requests to Fable 5 will also return an error. Please update your integrations to other Claude models.
We know this is a disruption to your workflows; we appreciate your patience and support.
2
296


2
5
158

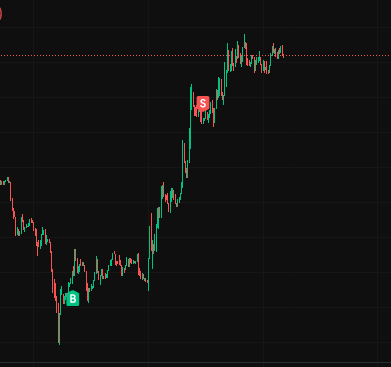
been cooking behind the scenes recently with the folks in @ElixirTrading but also in @mmmatt cord
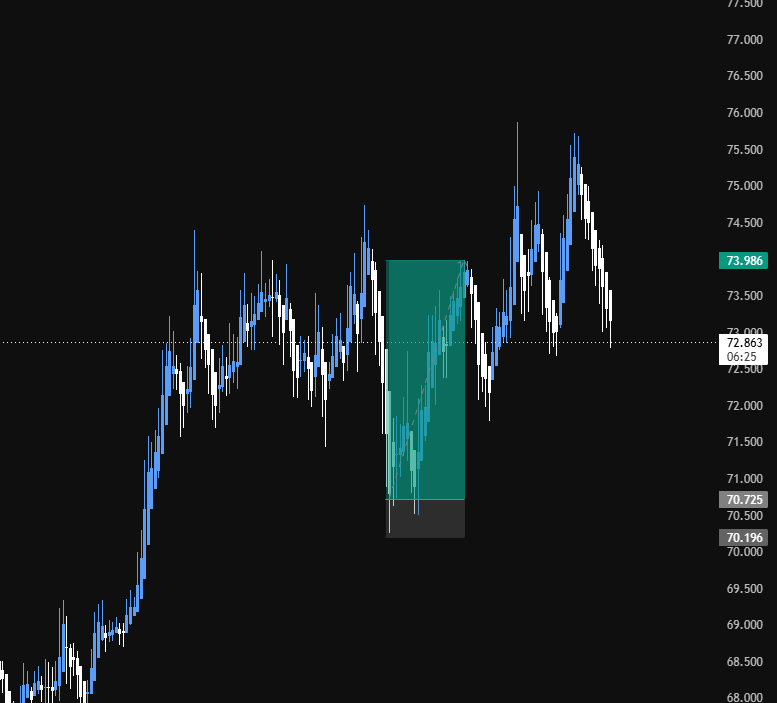
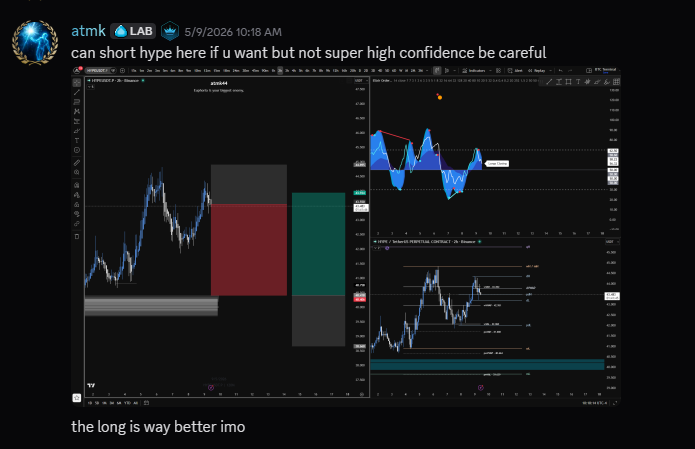
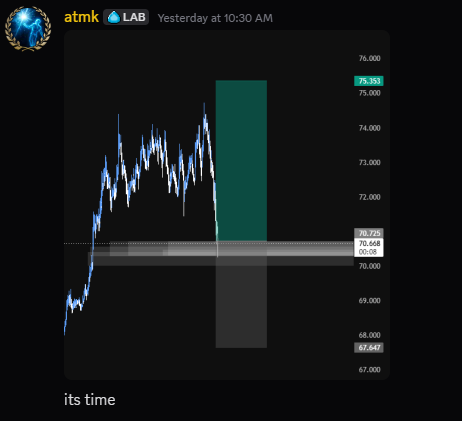
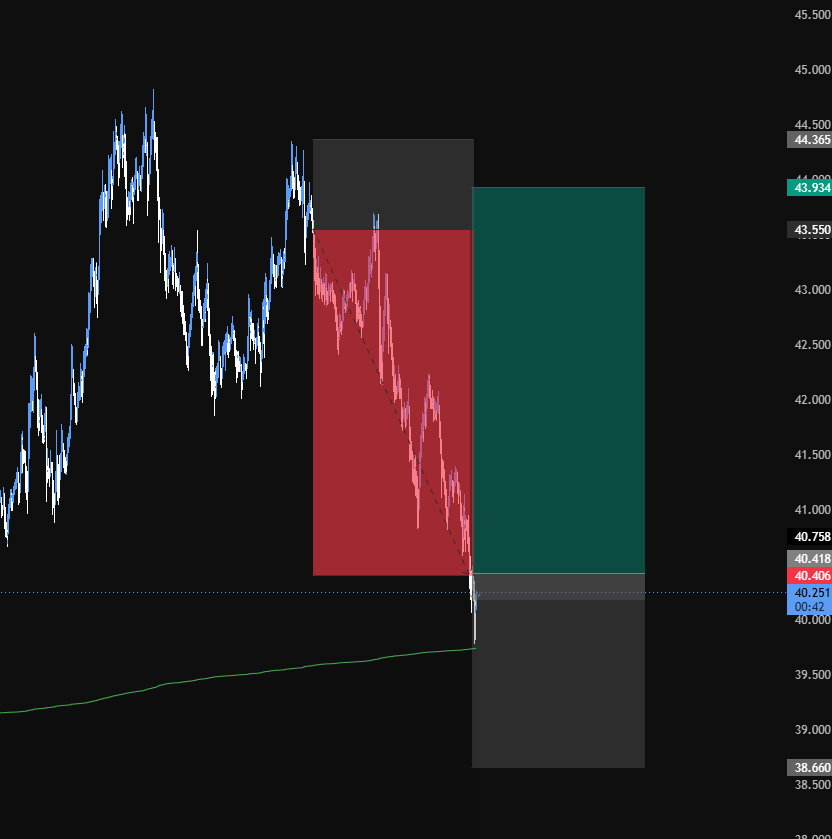
caught this nice $hype long :o
1
1
6
474

Excited to come on stage!
May 26

ELIXIR & TOP TIER SIGNALS X SPACE
Come join us Thursday, May 28th @ 12PM EST
Topics:
- Current Market Conditions
- Opportunities Across Financial Markets
- How Retail Traders Can Better Diversify Their Money & Time With Automation
- And More...
Both @atmk44 and @Cirmit will be on stage. Let's talk trading!

1
2
295
atmk retweeted

May 25
It’s finally here! The Elixir Orderflow GOLDEN DOT
No more guessing tops & bottoms, the oscillator now pre-calculates the best confluences for you.
• Scalping
• Day trading
• Swing trading
The Gold Dot works on any time frame.
One signal, One direction. Directly on your chart.
Sign up now ↓
discord.gg/cryptotrading

8
12
30
3,973


Trade any market 24/7.
Get institutional-grade news before the market moves, automate entries with signals you trust, trade any market straight from your phone.
Download Rift on the App Store.
apps.apple.com/app/id6746291…
44
30
140
79,540
Signal fired at 66,000
Current price: 80,400
What did I tell you?
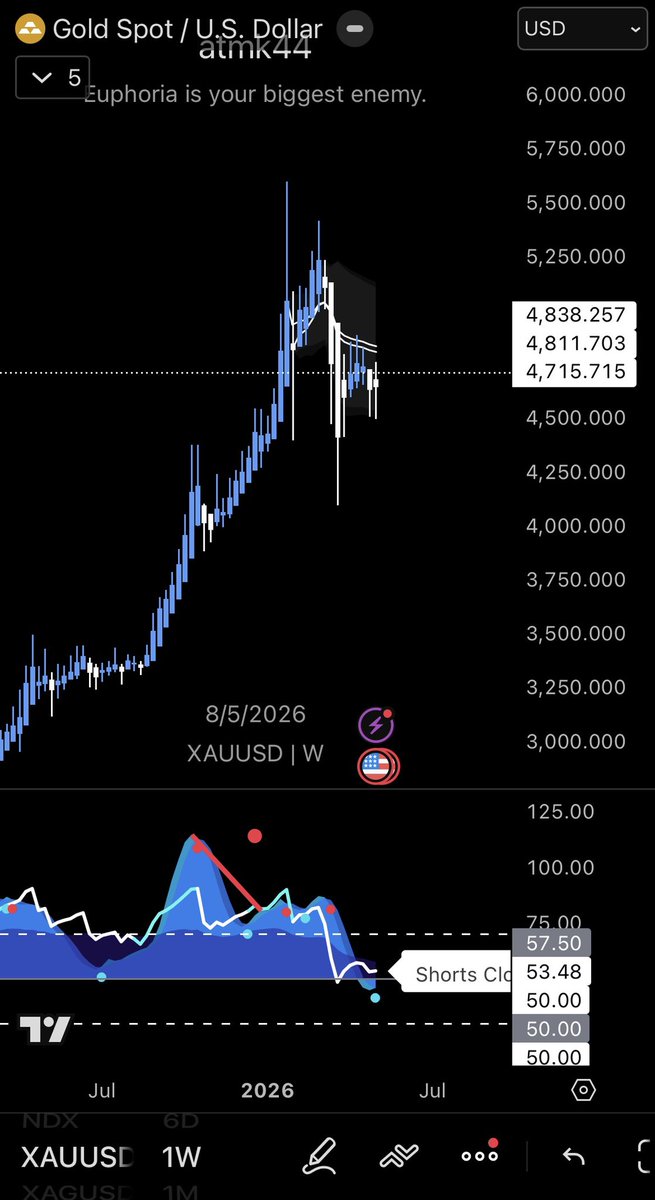
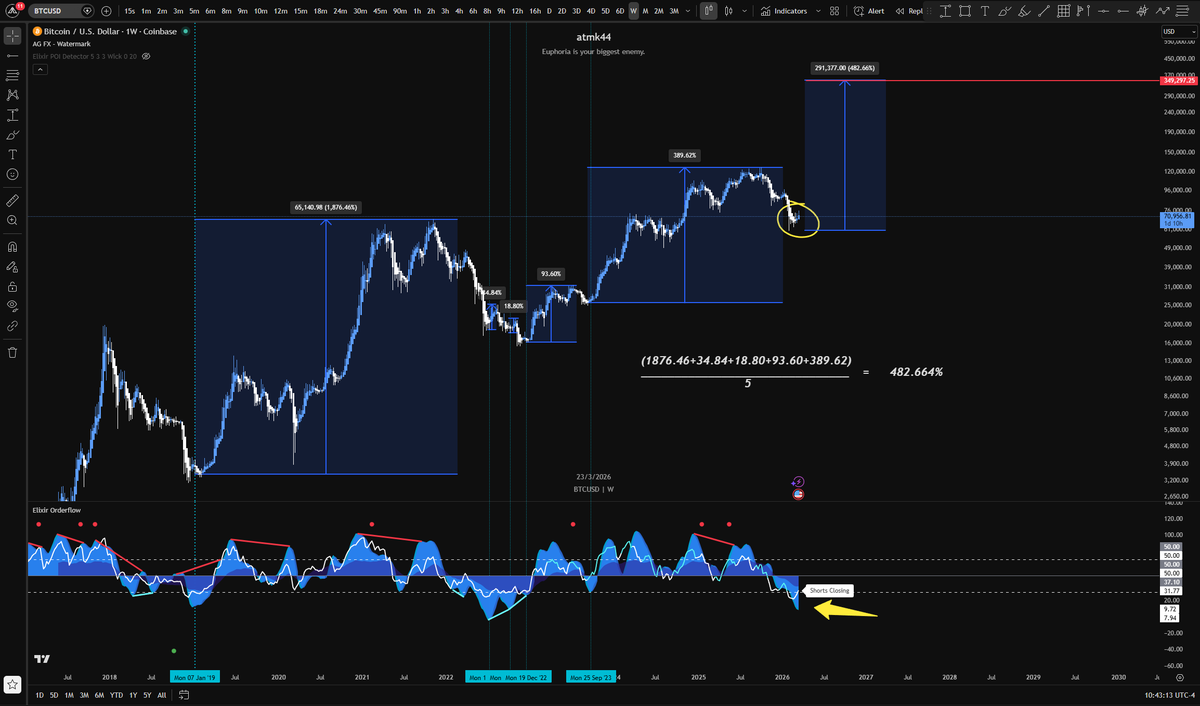
This is what the $BTC cycle bottom will look like and why we are likely going to see >$350,000 next cycle.
What I am looking for on the WEEKLY TIMEFRAME:
>Volume Waves Curving Up
Meaning the fast wave crossing into the smooth wave, showing the peak has been reached.
>Momentum Curving Up
Meaning the momentum is shifting from negative to positive. The move down will be exhausted.
>RSI Div. Green Dot (Optional)
This has been marking tops and bottoms historically, no reason to believe it won't IF it appears.
Now why do I think we will likely see $350,000 next cycle:
The equation:
(1876.46 34.84 18.80 93.60 389.62)/5 = 482.664%
*Sum of each move up in % divided by the number of iterations
>If we take every move from these signals and average each impulse up that came after, we get 482.66% average increase.
>Assuming $60K was the bear bottom, a 482.66% increase from the very bottom would mean we would reach at least $351,746 in the next Bull Market.
Now this number is subject to change if we get a lower low on the weekly timeframe, but now you know what to look for.
This is the difference between guessing and having a plan. I don't guess. I bet on what's most likely going to happen based on HARD DATA. Not feelings.
Now you know what to look for.
Happy trading to all.
1
4
480