
Joined March 2009
- Tweets 12,577
- Following 892
- Followers 1,398
- Likes 26,310
458 Photos and videos


24 Nov 2024
I'm running away from this platform. Find me on Blue sky @bitnerd.missinglink.run
bsky.app/profile/bitnerd.mis…
129
David Bitner retweeted

20 Nov 2024
Last reminder: PostGIS Day is tomorrow!
Please register! It's free and it helps us size the webinar account. crunchydata.com/community/ev…

8
16
1,031
David Bitner retweeted

18 Nov 2024
Part of maturing as an engineer is recognizing the difference between "thing you would do differently" and "thing you should comment on during code review"
5
19
325
15,145
David Bitner retweeted

29 Oct 2024
🚀 We’re hiring! Join us as a Technical Project Lead to advance open science in the cloud and help drive impactful NASA projects. Are you a proactive, independent leader with PM experience? Apply today: grnh.se/ad0fe1593us

1
7
18
1,211
David Bitner retweeted

15 Oct 2024
Can't overstate how incredibly useful and key pg_stat_statements is for every single Postgres database. Doesn't require much work and can get huge performance insights out of your database
x.com/crunchydata/status/184…
15 Oct 2024

pg_stat_statements is an extension that ships included with Postgres as part of the contrib set of extensions. It's incredibly handy for analyzing performance of your Postgres database.
If you don't already have it enabled you can enable it with:
CREATE EXTENSION pg_stat_statements
Once enabled it records all queries that are run, excluding constant values within the queries along with a lot of stats about them including number of times they're run, total time of execution, info about which blocks are written, read, dirtied, and more. This makes it easy to get a sense of performance of queries that consume the most time in aggregate or have a high average execution time.
For example this will give you the most time consuming queries in aggregate:
SELECT
d.datname, round(s.total_exec_time::numeric, 2) AS total_exec_time, s.calls, s.rows,
round(s.total_exec_time::numeric / calls, 2) AS avg_time,
round((100 * s.total_exec_time / sum(s.total_exec_time::numeric) OVER ())::numeric, 2) AS percentage_cpu,
substring(s.query, 1, 50) AS short_query
FROM pg_stat_statements s JOIN pg_database d ON (s.dbid = d.oid)
ORDER BY percentage_cpu DESC
LIMIT 5;
Want to get which queries have the highest average time of execution?
SELECT
(total_time / 1000 / 60) as total,
(total_time/calls) as avg,
query
FROM pg_stat_statements
ORDER BY 2 DESC
LIMIT 10;
If you haven't already enabled pg_stat_statements do so today. If you do have it enabled when is the last time you checked in on the query performance of your database?
1
2
29
2,679
David Bitner retweeted

Published arro3 v0.4: a minimal Python implementation of @ApacheArrow based on the @rustlang Arrow crate.
This adds zero-copy data import from Numpy, so you can use numeric Numpy-backed arrays with Rust Arrow operations without copies!
github.com/kylebarron/arro3/…
3
6
31
1,804
David Bitner retweeted

26 Sep 2024
News: PostgreSQL 17 Released! postgresql.org/about/news/po…
14
358
1,093
174,116
David Bitner retweeted

25 Sep 2024
After 1 year at Voltron Data, I found myself along with my teammates and 50 people in need of a job
I have plenty experience building OSS Python data tools, presenting at conferences and OS community management.
If you think I'd be a good fit for a job please let me know
14
47
105
24,118
David Bitner retweeted
26 Sep 2024
Postgres 17 was just released today, it offers some very real performance improvements. Here's a great deep dive with actual numbers on what the gains can look like crunchydata.com/blog/real-wo…
7
29
1,634
David Bitner retweeted

26 Sep 2024
And they're off -- PostgreSQL 17.0 is out of the gate! The rest is all up to you :-)
postgresql.org/about/news/po…
10
34
1,396
David Bitner retweeted
23 Sep 2024
Recent Postgres releases there is often "better performance", but it's easy to get numb to this.
But the real world numbers on this improvement in PG17 are pretty amazing. Awesome work on the feature @petervgeoghegan and @brandur on the benchmarking.
x.com/brandur/status/1838247…

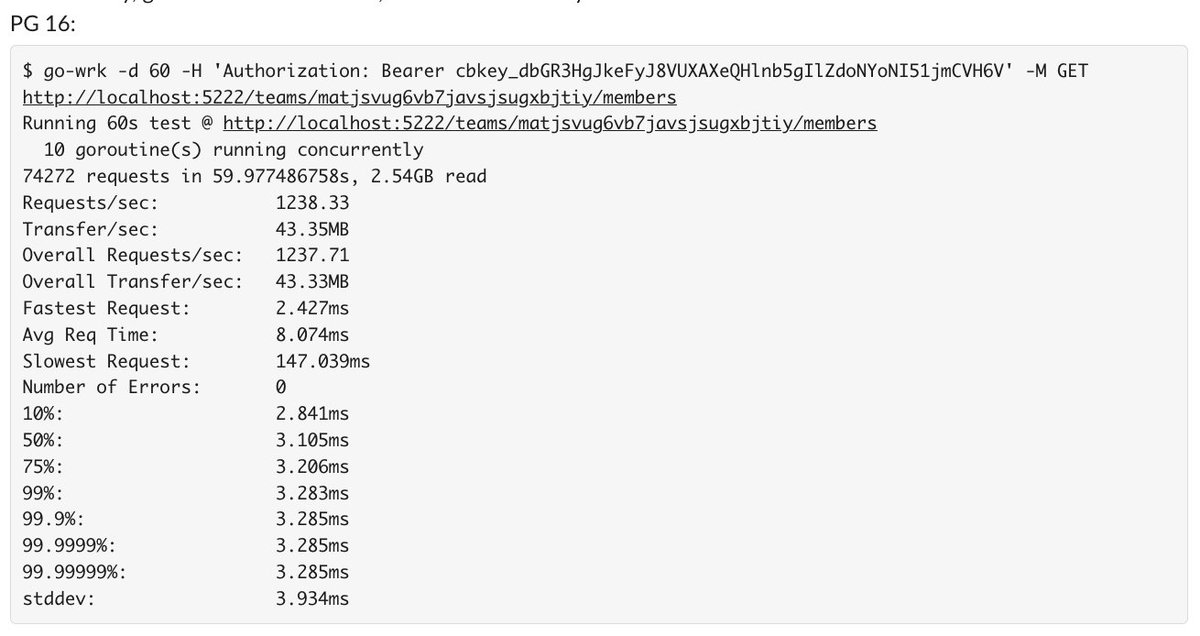
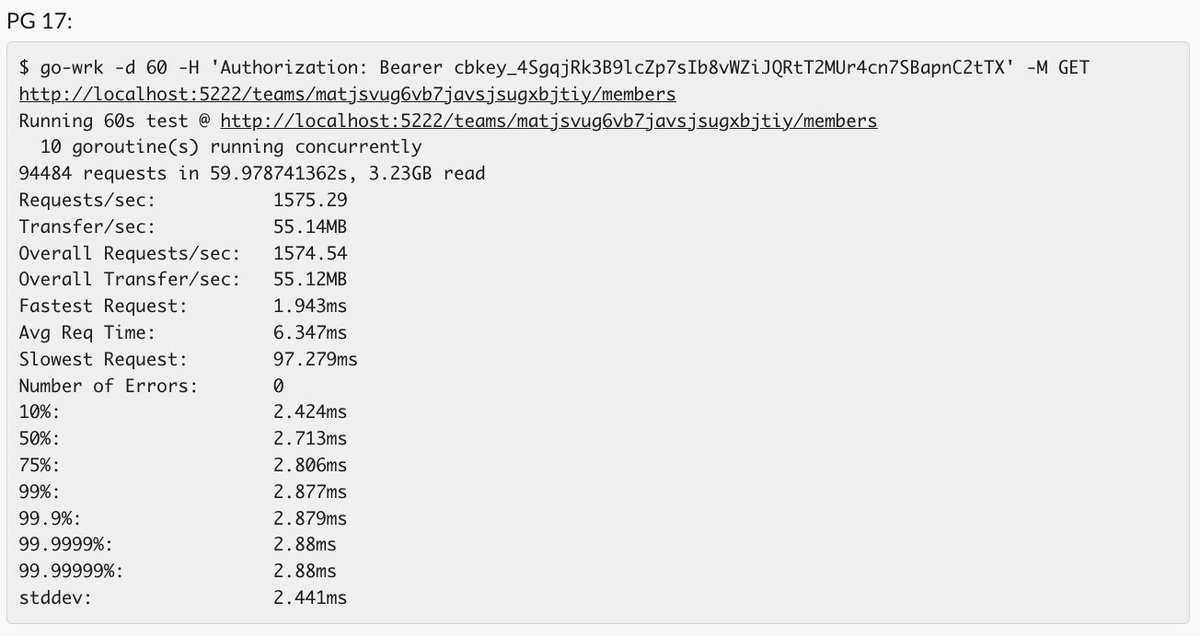
Postgres 17: Expect *serious* real world perf gains in apps making heavy use of eager loading.
We benchmarked an average complexity endpoint and saw 30% throughput and a 20% drop in request time. We're expecting that across the board on final release.
crunchydata.com/blog/real-wo…
11
56
5,745
David Bitner retweeted
20 Sep 2024
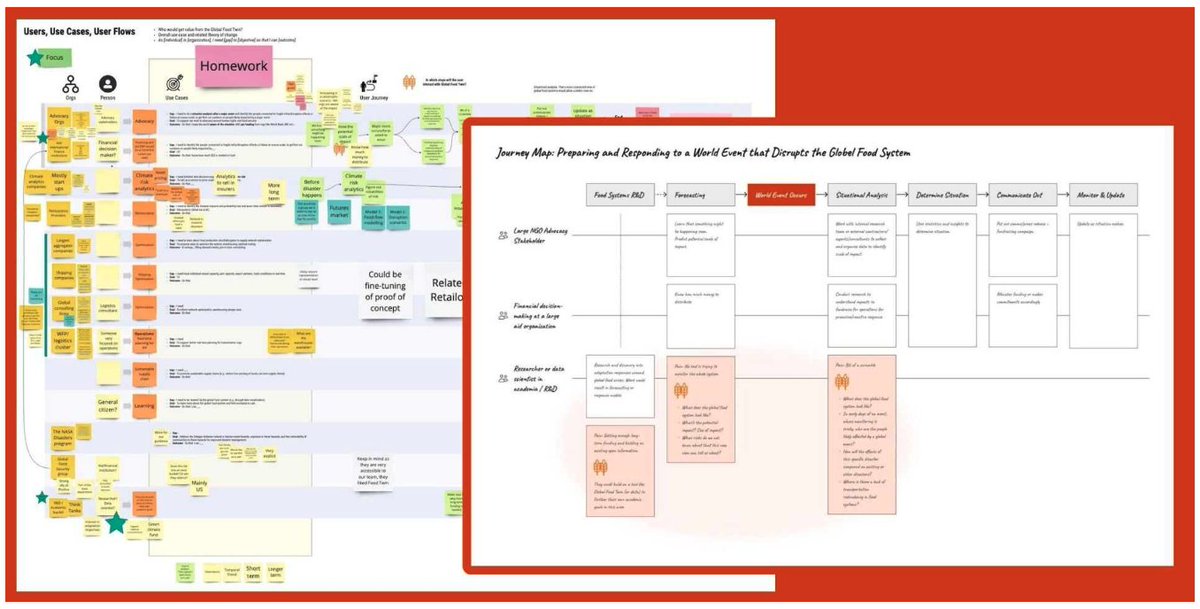
We teamed up with @EarthGenome and Better Planet Lab (@ZiaMehrabi) to tackle a complex problem: visualizing the global food system.
Our design sprint process gave us new ways to think about data modeling and collaboration. Learn more in our blog: ds.io/visualizingfood

3
14
724
David Bitner retweeted

20 Sep 2024
A collaborative approach is central to how we get things done at Earth Genome & it's a joy to work alongside partners like @developmentseed.
Here's a preview of the Global Food Twin project & the step-by-step design approach before the official launch: developmentseed.org/blog/202…
1
2
4
244
David Bitner retweeted
17 Sep 2024
Window functions in #PostgreSQL are one of those things that once you get them, they're amazing! For various types of analysis they're such a handy tool to have in your toolbox. This post by @sqlliz is such a solid walkthrough. x.com/planetpostgres/status/…

17 Sep 2024

Elizabeth Garrett Christensen (@sqlliz): Window Functions for Data Analysis with Postgres postgr.es/p/6Df
2
18
95
13,422
David Bitner retweeted
13 Sep 2024
We'd like to invite you to attend SatCamp in beautiful Boulder, Colorado, from October 1 to 3, 2024. Because of its unique nature, space is very limited. There are still a few spots left that include accommodations. satcamp.xyz/

5
11
2,225
David Bitner retweeted

7 Sep 2024
finally someone made it – tetris in @PostgreSQL, [almost] in pure SQL, with recursive CTEs github.com/nuno-faria/tetris…
HN: news.ycombinator.com/item?id…
UPD: the repo's README is amazing
5
96
422
34,224
David Bitner retweeted
youtu.be/LFzhN5wQqBk?feature… The live demo gods were in my favor!
Check out Lonboard running in @pyodide... full speed ahead to geospatial Python running in the browser!

This will be live streamed! Tune in and cast your bets for whether my live demo will work or not 🎲
youtube.com/live/TQcALWR3duU
2
6
982
David Bitner retweeted
Lonboard & GeoArrow Rust in @ProjectJupyter's JupyterLite, all running in WebAssembly right in your browser! No server required!
Try it out here: jupyterlite.ds.io/lab/index.…

4
25
122
8,244
David Bitner retweeted
29 Aug 2024
We're exploring how cloud-native technologies can transform data management for humanitarians. With @jcrowley, we're envisioning a decentralized system for sharing methods & metadata while safeguarding privacy. Let's innovate together! 🤝
🔗: ds.io/rethinking-crisis-data

4
15
1,071
David Bitner retweeted

21 Aug 2024
If you have a PhD in Hydrology, experience with coding/working in the cloud, and an enthusiasm to learn more software dev skills, please reach out! We have a really exciting job opening coming up at @NASAEarthData GES DISC.
3
86
198
27,070