
Economist. Writing about economics and personal finance. Building a financial planner that implements the lifecycle model of economics.
Joined April 2022
- Tweets 445
- Following 59
- Followers 162
- Likes 1,256
31 Photos and videos


Pinned Tweet

16 Jan 2025
I really enjoyed talking to @benjaminfelix and @MarkMcGrathCFP about financial planning using the lifecycle model of economics vs SWR.
I’ve listened to the podcast for years and it was a privilege to be on the other side discussing a topic that’s close to my heart!
16 Jan 2025

Episode 340 - Ben Mathew: The Lifecycle Model vs. Safe Withdrawal Rates (SWR)
rationalreminder.ca/podcast/…
3
2
30
8,308

The logic of the index fund is the following. If each unconstrained investor attempts to hold a mean-variance efficient portfolio, then there’s a good chance that the aggregate portfolio of those unconstrained investors is also mean-variance efficient.
A reasonable approximation to this, within a country, is the free-float weighted market.
Internationally, if some countries don’t allow the domestic investors to invest abroad in foreign stocks, then their free-float weighted market caps are likely overstated for this purpose and should likely be further down weighted.
Jun 13

How do you weight emerging market stocks in your portfolio?
Market-cap weight? Overweight for diversification/valuation? Underweight because of governance, currency, and concentration risks?
Curious where people land and why.
#Investing #Finance #PersonalFinance
1
4
41
5,893
Ben Mathew retweeted

Jun 12
Ann Carrns from the @nytimes wrote a great article about our latest findings from the Personal Finance Index and yes, the data show we are moving in the wrong direction.
nytimes.com/2026/06/12/your-…

3
8
3,477
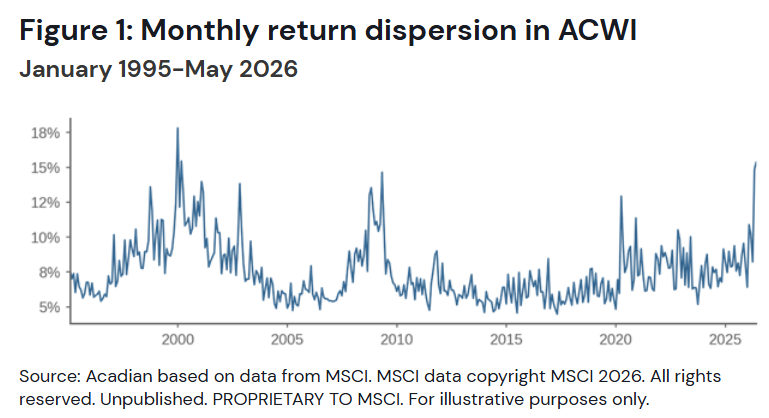
DISPERSION IS HERE
“Now this is not the end. It is not even the beginning of the end. But it is, perhaps, the end of the beginning.”
-- you know who
During the eighth step of the bubble, the flow of new investors starts shrinking while existing investors approach their risk and leverage limits. Volatility and dispersion grow, and gains become less uniform across stocks.
Now, dispersion is here.
Owen Lamont posted this graph today, which illustrates well how cross-sectional dispersion of monthly returns peaks at tops and bottoms.
My interpretation of the graph is not that high dispersion is always a sell signal, or a buy signal for that matter. To me, it's a signal that what has worked very well so far will stop working relatively soon. High beta was great during the late nineties, being short levered small caps was great going into the global financial crisis, and having just cash was great when Covid lockdowns hit. When the dispersion peaked each of those times, what worked on the way in stopped working soon, and what didn't work on the way in started working very well.
The obvious caveat is that we don't know that the dispersion has peaked yet. If this is a bubble, then we are close to the end of the beginning of it, but it's not yet clear whether the correct analogy is April 2000 or December 1999, the two alternative analogies having very different short-term return implications. To build on the analogy of the quote, the battle of El Alamein has started, but it hasn't been won (lost, if you're a Platner supporter) yet.
x.com/ptuomov/status/2054753…

THE LIFE CYCLE OF A BUBBLE
1. A genuine advancement creates real productivity gains. A real technological or economic improvement increases productivity and leads to genuine revenue and earnings growth.
2. Stock prices leak into reported profitability. Rising stock prices improve reported earnings, financing conditions, collateral values, and perceived business performance.
3. Reported profitability drives real investment. Companies increase hiring, capital spending, construction, expansion, and speculative investment because of their own or their customers’ reported profitability.
4. Bubble beliefs and abandonment of present-value discipline. Investors stop focusing on discounted cash flows and begin relying on continuing gains from the greater fool theory, believing they can sell later at a higher price.
5. Inflows from sideline investors. Previously cautious investors enter the market in large numbers. New money from existing and new investors participation drive prices higher.
6. Extreme overvaluation. Prices rise far above historical normal multiples of reported fundamentals, even ignoring the fact that reported fundamentals have been driven by rising stock prices.
7. Issuance. Companies take advantage of high valuations through IPOs, secondary offerings, stock-based acquisitions, SPACs, and insider selling.
8. Exhaustion of inflows. The flow of new investors starts shrinking while existing investors approach their risk and leverage limits. Volatility and dispersion grow and gains become less uniform across stocks.
9. Earnings disappointments from slowing price appreciation. As stock prices stop rising rapidly, the earlier boost from higher valuations into earnings weakens or reverses. Companies begin missing expectations.
10. Stock-price collapse with high volatility. Confidence in both the fundamental growth and in the greater fool theory break down and prices fall sharply. Volatility rises further as leverage unwinds.
11. Bear-market rallies and progressively greater exhaustion. Bargain hunters and frustrated latecomers repeatedly buy the dips, creating violent temporary rallies that fail. Markets make lower highs and lower lows.
12. Capitulation, abandonment, and normalization. Bubble participants eventually give up in disgust or exhaustion. Volatility falls, valuations normalize, and the market returns to more ordinary behavior.
11
21
169
73,316
STEP 2 ROCKET FUEL!!!
🚀🚀🚀🚀
The inflated stock prices leak into reported profitability in every large bubble. According to the below link, this is now happening.
(ht Owen Lamont)
Jun 9

My Substack shows how Other Income & Expense from Alphabet/Amazon/Nvidia materially boosted S&P 500's Q1 2026 earnings.
Honored to see Matt Levine discuss it in today's Money Stuff. Thanks, @matt_levine !
Bloomberg: bloomberg.com/opinion/newsle…
My article: baolianwang.substack.com/p/t…
3
3
16
11,062
CHARACTERISTICS ASSOCIATED WITH BUBBLE AFTER STEP 4
At step 4 of the bubble, investors abandon the present-value formula and shift to their "greater fool" theory of investing. I believe this will have the following cluster of consequences for the observable quantities:
- high valuation
- high analyst forecast LTG
- high duration of any remaining present-value arguments
- high share turnover
- high volatility
- high analyst forecast and recommendation dispersion, as not all analysts abandon the present value formula and learn to love the bubble at the same time
- weak anchoring of prices and stories to near-term cash flows
- less negative correlation between returns and implied volatility change
Are we seeing this?
THE LIFE CYCLE OF A BUBBLE
1. A genuine advancement creates real productivity gains. A real technological or economic improvement increases productivity and leads to genuine revenue and earnings growth.
2. Stock prices leak into reported profitability. Rising stock prices improve reported earnings, financing conditions, collateral values, and perceived business performance.
3. Reported profitability drives real investment. Companies increase hiring, capital spending, construction, expansion, and speculative investment because of their own or their customers’ reported profitability.
4. Bubble beliefs and abandonment of present-value discipline. Investors stop focusing on discounted cash flows and begin relying on continuing gains from the greater fool theory, believing they can sell later at a higher price.
5. Inflows from sideline investors. Previously cautious investors enter the market in large numbers. New money from existing and new investors participation drive prices higher.
6. Extreme overvaluation. Prices rise far above historical normal multiples of reported fundamentals, even ignoring the fact that reported fundamentals have been driven by rising stock prices.
7. Issuance. Companies take advantage of high valuations through IPOs, secondary offerings, stock-based acquisitions, SPACs, and insider selling.
8. Exhaustion of inflows. The flow of new investors starts shrinking while existing investors approach their risk and leverage limits. Volatility and dispersion grow and gains become less uniform across stocks.
9. Earnings disappointments from slowing price appreciation. As stock prices stop rising rapidly, the earlier boost from higher valuations into earnings weakens or reverses. Companies begin missing expectations.
10. Stock-price collapse with high volatility. Confidence in both the fundamental growth and in the greater fool theory break down and prices fall sharply. Volatility rises further as leverage unwinds.
11. Bear-market rallies and progressively greater exhaustion. Bargain hunters and frustrated latecomers repeatedly buy the dips, creating violent temporary rallies that fail. Markets make lower highs and lower lows.
12. Capitulation, abandonment, and normalization. Bubble participants eventually give up in disgust or exhaustion. Volatility falls, valuations normalize, and the market returns to more ordinary behavior.
1
6
34
17,315
HOW TO ABANDON THE PRESENT VALUE FORMULA IN POLITE COMPANY
While retail investors are free to completely abandon the present value formula whenever they so desire, professional sell-side research analysts do not have such freedom. The professional standards force those analysts to follow a set of complex rules and social conventions resembling a tea ceremony to do so.
The research analyst has a target price that has to be about 15% above the current price. Then he must construct a set of cash flow forecasts, long-term growth forecasts, and discount rates that mechanically justify that target price.
In a bubble, the price is unjustifiable, which means that those forecasts must also be unjustifiable, but they must appear on the surface to be as justifiable as possible. Furthermore, the near-term cash flow forecasts must actually be relatively accurate because the reality of those near-term cash flows will, by definition, be revealed in the near term.
The two main ways analysts can tune their present value formula to justify the unjustifiable target prices are (1) pushing out the earnings in the multiple and (2) increasing the long-term growth rate. The first method simply says that the front page of the report will not compute multiples based on year 2026 or 2027 earnings, but year 2030 or even year 2040 earnings. This is relatively safe, as both the analyst and the institutional investor listening to the analyst are likely pursuing other career paths by 2040, when those 2040 earnings fall short of the forecasts.
The second method is just to increase the terminal value and terminal multiple after the explicit forecast horizon by increasing the long-term growth rate forecast. Owen Lamont has recently written about this, but the observation that the analyst long-term forecasts become unrealistic in a bubble is almost as old as the field of security analysis itself as each analyst covering each stock has to stretch the long-term growth forecast higher and higher.
Although some stocks may meet these high long-term growth forecasts, at some point of the bubble they will aggregate for the whole market to a level that is almost certainly impossible for even the godliest Machine God to produce. This observation is also not original but has been made, among other people, by Cliff Asness in his “Bubble Logic” piece.
A good proxy for Step 4 of the bubble is to compute the difference between aggregated individual stock analyst long-term growth forecasts and macroeconomic analysts’ long-term GDP growth forecasts. (This may be the sole case in which macroeconomic analysts’ forecasts of anything have any utility.) When the bottom-up LTG aggregated across stocks is unusually high compared to the long-term GDP growth forecast, that is evidence of the professional investors taking the fourth step and abandoning the discipline of the present value formula in a polite way.
THE LIFE CYCLE OF A BUBBLE
1. A genuine advancement creates real productivity gains. A real technological or economic improvement increases productivity and leads to genuine revenue and earnings growth.
2. Stock prices leak into reported profitability. Rising stock prices improve reported earnings, financing conditions, collateral values, and perceived business performance.
3. Reported profitability drives real investment. Companies increase hiring, capital spending, construction, expansion, and speculative investment because of their own or their customers’ reported profitability.
4. Bubble beliefs and abandonment of present-value discipline. Investors stop focusing on discounted cash flows and begin relying on continuing gains from the greater fool theory, believing they can sell later at a higher price.
5. Inflows from sideline investors. Previously cautious investors enter the market in large numbers. New money from existing and new investors participation drive prices higher.
6. Extreme overvaluation. Prices rise far above historical normal multiples of reported fundamentals, even ignoring the fact that reported fundamentals have been driven by rising stock prices.
7. Issuance. Companies take advantage of high valuations through IPOs, secondary offerings, stock-based acquisitions, SPACs, and insider selling.
8. Exhaustion of inflows. The flow of new investors starts shrinking while existing investors approach their risk and leverage limits. Volatility and dispersion grow and gains become less uniform across stocks.
9. Earnings disappointments from slowing price appreciation. As stock prices stop rising rapidly, the earlier boost from higher valuations into earnings weakens or reverses. Companies begin missing expectations.
10. Stock-price collapse with high volatility. Confidence in both the fundamental growth and in the greater fool theory break down and prices fall sharply. Volatility rises further as leverage unwinds.
11. Bear-market rallies and progressively greater exhaustion. Bargain hunters and frustrated latecomers repeatedly buy the dips, creating violent temporary rallies that fail. Markets make lower highs and lower lows.
12. Capitulation, abandonment, and normalization. Bubble participants eventually give up in disgust or exhaustion. Volatility falls, valuations normalize, and the market returns to more ordinary behavior.
13
22
252
183,271
Ben Mathew retweeted
Season 1 finale of Econ To Go is live. I joined Neale Mahoney, Director of the Stanford Institute for Economic Policy Research, for a conversation on financial literacy, why it matters, and what we can do about it. siepr.stanford.edu/av/Econ-T…
5
6
653
Ben Mathew retweeted

May 25
In which case we're seeing expected inflation. Not as bad as a debt crisis, but not great news! Good point.
May 23

Don't get me wrong. I certainly worry about the evolution of US public debt and the size of primary deficits. But, while there is a lot of discussion/worry about the increase in nominal interest rates, the 10-year inflation indexed rate, which is the relevant one for debt dynamics, has remained surprisingly stable. fred.stlouisfed.org/series/D…
3
6
49
21,005
What I have in mind on stock returns contaminating earnings is best illustrated by Intel in the late 1990s and early 2000. Every time they were about to miss earnings expectations that were running away, they simply realized some gains from their huge venture capital portfolio. Those gain realizations transactions were easy to execute in 1999, but impossible to execute in 2022 because the market had crashed. That's the most blatant way in which stock market gains made it into earnings.
2
2
8
651
THE LIFE CYCLE OF A BUBBLE
1. A genuine advancement creates real productivity gains. A real technological or economic improvement increases productivity and leads to genuine revenue and earnings growth.
2. Stock prices leak into reported profitability. Rising stock prices improve reported earnings, financing conditions, collateral values, and perceived business performance.
3. Reported profitability drives real investment. Companies increase hiring, capital spending, construction, expansion, and speculative investment because of their own or their customers’ reported profitability.
4. Bubble beliefs and abandonment of present-value discipline. Investors stop focusing on discounted cash flows and begin relying on continuing gains from the greater fool theory, believing they can sell later at a higher price.
5. Inflows from sideline investors. Previously cautious investors enter the market in large numbers. New money from existing and new investors participation drive prices higher.
6. Extreme overvaluation. Prices rise far above historical normal multiples of reported fundamentals, even ignoring the fact that reported fundamentals have been driven by rising stock prices.
7. Issuance. Companies take advantage of high valuations through IPOs, secondary offerings, stock-based acquisitions, SPACs, and insider selling.
8. Exhaustion of inflows. The flow of new investors starts shrinking while existing investors approach their risk and leverage limits. Volatility and dispersion grow and gains become less uniform across stocks.
9. Earnings disappointments from slowing price appreciation. As stock prices stop rising rapidly, the earlier boost from higher valuations into earnings weakens or reverses. Companies begin missing expectations.
10. Stock-price collapse with high volatility. Confidence in both the fundamental growth and in the greater fool theory break down and prices fall sharply. Volatility rises further as leverage unwinds.
11. Bear-market rallies and progressively greater exhaustion. Bargain hunters and frustrated latecomers repeatedly buy the dips, creating violent temporary rallies that fail. Markets make lower highs and lower lows.
12. Capitulation, abandonment, and normalization. Bubble participants eventually give up in disgust or exhaustion. Volatility falls, valuations normalize, and the market returns to more ordinary behavior.
20
50
326
227,163
May 8
$1 billion translates to about $2.86 per person in the US and $0.12 per person in the world. Steve Jobs and Jeff Bezos and many other entrepreneurs surely have produced more value per person than that.
Scientists who make useful discoveries can produce billions of dollars of value too. But due to the public goods nature of science, scientists are not able to capture a share of that value. So we get too few scientists and too little science—the tragedy of the commons. Government funding and philanthropy try to fix this, but there is still far less research than there would have been if scientists had earned a fraction of the value they produce.
The fact that entrepreneurs, unlike scientists, are able to capture a share of the value they create, is a good thing.
May 7

AOC: “There’s a certain level of wealth and accumulation that is unearned. You can’t earn a billion dollars. You just can’t earn that. You can get market power, you can break rules, you can abuse labor laws, you can pay people less than what they’re worth, but you can’t earn that”
127
May 6
Technology has made it easy to invest well—you can buy a diversified portfolio of stocks with the click of a button. It has also made it easy to gamble away your wealth on risky bets with negative expected returns.
The return on financial education has never been higher.

Bettors expect to break even. They actually lose 7.5 cents per dollar wagered. A new IFDM policy brief on sports betting, behavioral bias, and what consumer protection in this space should look like:
ifdm.stanford.edu/publicatio…
1
80
Ben Mathew retweeted
Bettors expect to break even. They actually lose 7.5 cents per dollar wagered. A new IFDM policy brief on sports betting, behavioral bias, and what consumer protection in this space should look like:
ifdm.stanford.edu/publicatio…
2
2
301
Ben Mathew retweeted

May 6
Yes, the Democrats are the tax and spend party, and the Republicans are the don't tax and spend party.

If there is ever a social phenomenon that needs to be studied, it is how the GOP has been able to hoodwink people for decades into thinking that they the party of “fiscal responsibility” when there is absolutely ZERO evidence to support that claim.
And I mean ZERO.
21
14
353
15,478
Ben Mathew retweeted

May 4
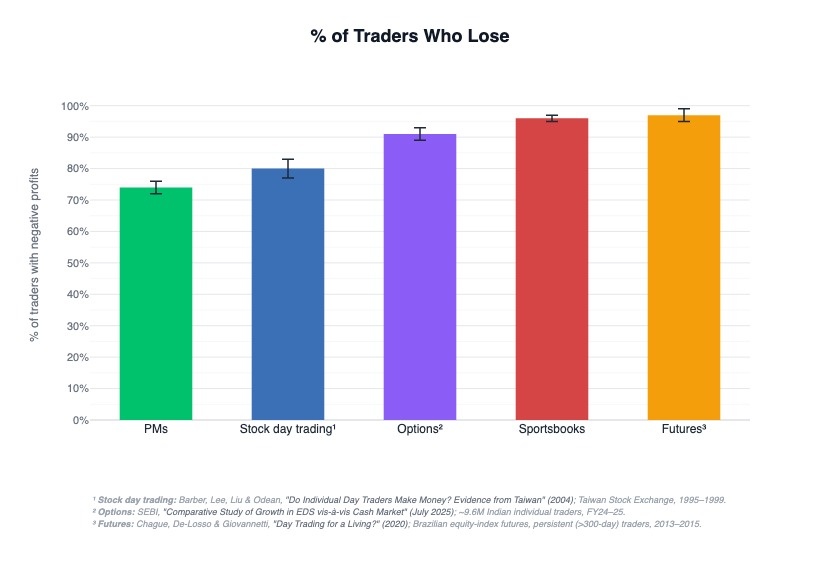
I think people should be allowed to lose money however they like, and I resent the rising trend of lowest-common-denominator temperance thinking. But I'm not sure "less likely to lose money than options day trading" is an ironclad position
May 4

Prediction market users are less likely to lose money than people who do day trading or trade in futures and options.
Some of the most likely traders to lose? Sportsbooks users.
3
9
97
26,056