
Chart analysis and dark pool/option flow insights provided are for educational purposes only. Not financial advice or a trade signal.
Joined March 2026
- Tweets 216
- Following 17
- Followers 1,331
- Likes 351
51 Photos and videos


Pinned Tweet

May 9
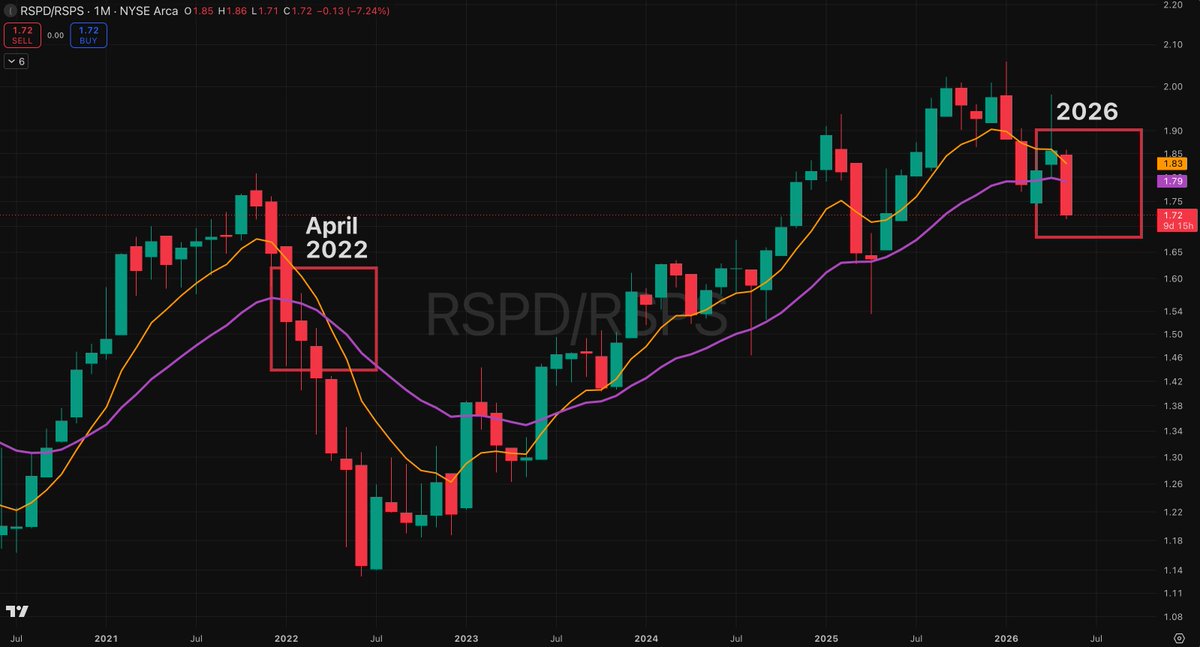
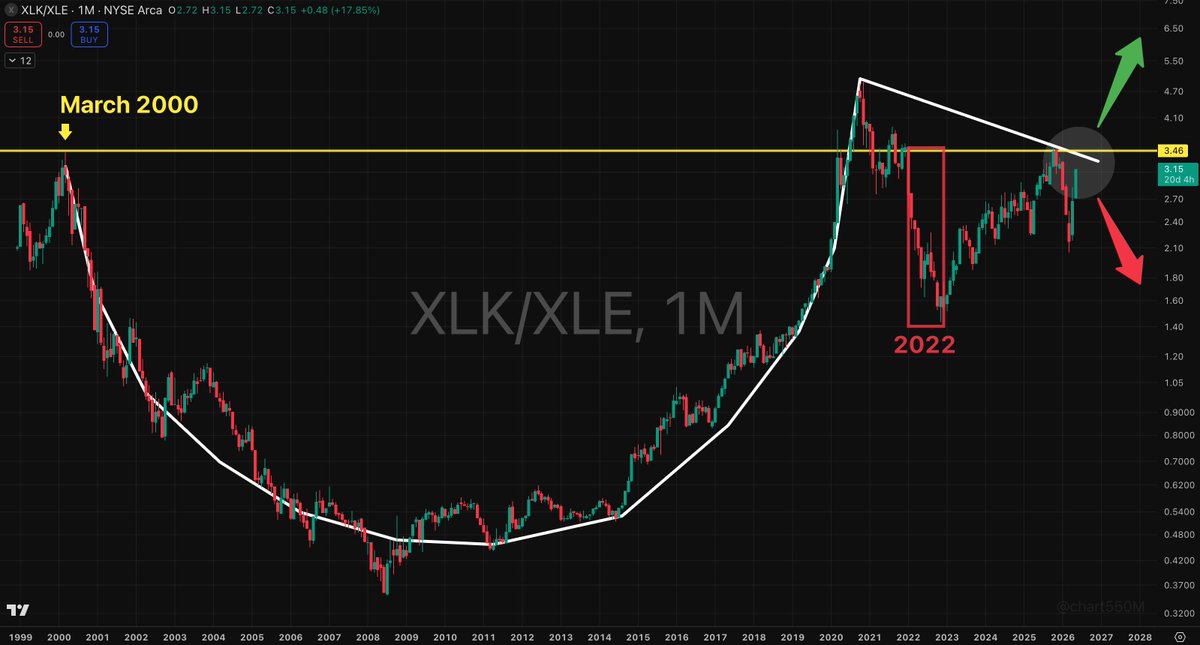
The battle between $XLK (tech) and $XLE (energy) all comes down to this generational cup and handle:
> $XLK / $XLE ratio: 20-year cup followed by a 6-year handle
> Ratio is currently approaching the same level as March 2000
> The 2009 cup bottom signaled the start of the decade-long tech bull run
> The handle broke during the 2022 energy rotation, but has since recovered
> About to test a major trendline connecting the Nov 2020 and Nov 2025 monthly candlesticks
So the question now is:
Does the handle breakout, launching $XLK and $SOX into another multi-year leg higher?
Or...
Does the handle fail, triggering a structural rotation back to $XLE and a new bear market for $QQQ and $SPY?
5
4
34
26,754
550M retweeted
May 23
*Any* news regarding the Iran war is only massively bullish for energy at this point.
Ceasefire, memorandums, war ending, continuing etc.
That only means a true resolution is nowhere in sight.
All noise, yet very high signal for the energy sector.
May 20

If you're bullish oil, this is exactly the type of price action you want to see.
Crude oil still playing out its volatility contraction pattern and setting up for an explosive move up within a couple weeks.
Institutions accumulating in size, while weak hands get rinsed. You can see this with the volume drying up as supply runs out.
7
4
35
20,993
May 20
If you're bullish oil, this is exactly the type of price action you want to see.
Crude oil still playing out its volatility contraction pattern and setting up for an explosive move up within a couple weeks.
Institutions accumulating in size, while weak hands get rinsed. You can see this with the volume drying up as supply runs out.
9
15
121
21,933
May 17
An update:
Failed expansion pattern continuing, just like we saw in Feb 2025.
10ema🟠 rejected off the 200sma🟢
Apr 29
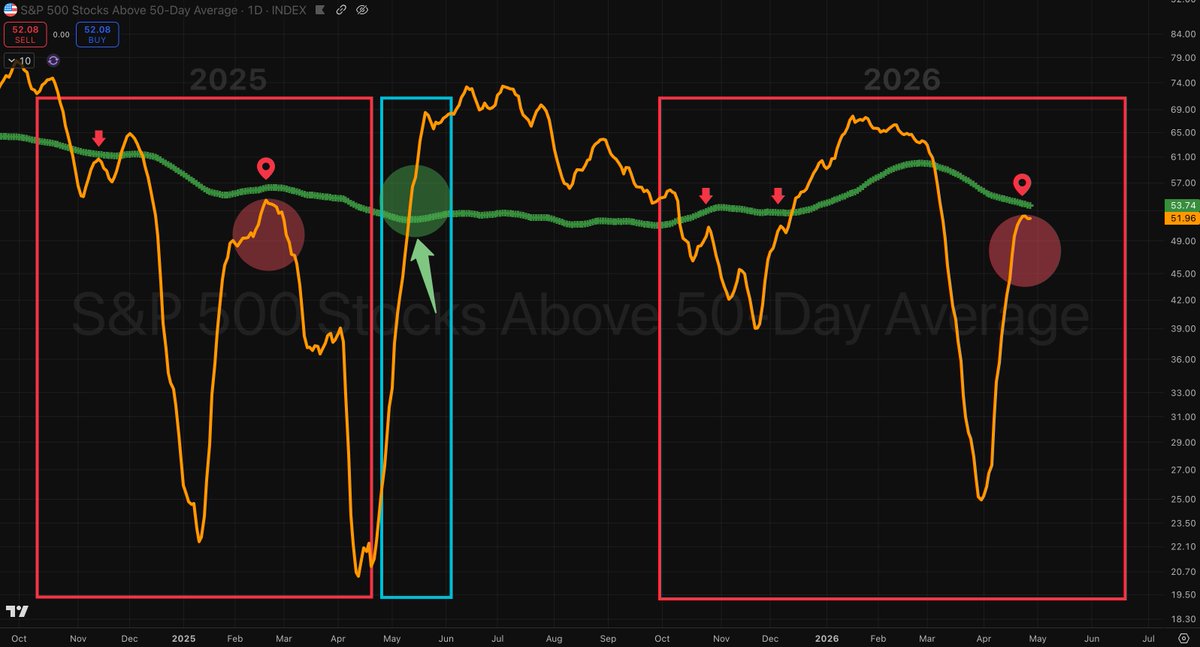
Almost no one uses this chart correctly... but it's one of the best ways to tell if a move up will continue or fail.
The answer becomes very apparent for the current $QQQ and $SPY move when you look at the internal structure under a different light:
This is a daily chart of the percentage of $SPY stocks above the 50 day moving average. I removed the candlesticks because what matters most is not the actual raw percentage, but the interaction between its own moving averages.
Specifically the 10ema🟠 and 200sma🟢 for the percentage itself.
The last time the 10ema struggled to get above the 200sma following a deep move in breadth was Feb 2025 prior to the tariff selloff. We are seeing that same failed expansion pattern happening right now.
Conversely, in order for a move up to fully sustain, the 10ema needs to slice above the 200sma with absolute ease like it did back in May 2025 during the recovery. That is clearly not the case currently.
This doesn't necessarily mean the exact top, but when internal momentum stalls against long-term moving averages while also making lower highs, it's worth paying attention to.
3
1
15
18,111
May 14
Almost everyone has given up on oil going higher... they could not be more wrong.
The $XLE chart proves that the entire energy trade is only just beginning.
$XLE is about to complete the perfect Volatility Contraction Pattern:
Institutions have been accumulating heavily while weak hands have been getting rinsed during each contraction.
Each move is getting smaller and smaller as supply runs out, creating a textbook coiled spring... on the sector's largest ETF.
This means an explosive move up for oil is coming within the next several weeks.
6
4
33
11,171
May 6
Another leading indicator has reached a critical breaking point:
The $NVDA / $QQQ ratio just closed below its weekly 50sma.
This has happened only 4 other times in the past decade.
3 of these preceded a period of significant technical exhaustion:
> 2018: Q4 liquidity crisis
> 2022: Bear market following the end of ZIRP
> 2025: Tariff selloff
And now 2026... the global energy crisis.
Major caution is warranted at this juncture.
(weekly 50sma🟡)
9
6
81
35,934
May 2
While everyone was distracted by earnings noise, $MSFT just finalized a decade-level structural signal:
$MSFT officially printed a monthly 8/21ema bearish cross this week.
This has happened only 4 other times since its 1986 IPO...
Every single occurrence coincided with a major macro regime change:
> 2000: The dot-com peak
> 2006: The top of the housing bubble
> 2008: The GFC acceleration
> 2022: The end of the zero interest rate policy era
And 2026 is now the 5th time:
The global energy crisis.
Trends at this scale move slowly, but they are the most objective indicators of capital flow.
Given Microsoft's index weight, this breakdown represents a significant structural headwind for both $SPY and $QQQ.
It's a sign of things to come.
(8ema🟠/ 21ema🟣/ bearish cross🟥)

13
12
128
32,633
Apr 29
Almost no one uses this chart correctly... but it's one of the best ways to tell if a move up will continue or fail.
The answer becomes very apparent for the current $QQQ and $SPY move when you look at the internal structure under a different light:
This is a daily chart of the percentage of $SPY stocks above the 50 day moving average. I removed the candlesticks because what matters most is not the actual raw percentage, but the interaction between its own moving averages.
Specifically the 10ema🟠 and 200sma🟢 for the percentage itself.
The last time the 10ema struggled to get above the 200sma following a deep move in breadth was Feb 2025 prior to the tariff selloff. We are seeing that same failed expansion pattern happening right now.
Conversely, in order for a move up to fully sustain, the 10ema needs to slice above the 200sma with absolute ease like it did back in May 2025 during the recovery. That is clearly not the case currently.
This doesn't necessarily mean the exact top, but when internal momentum stalls against long-term moving averages while also making lower highs, it's worth paying attention to.
3
10
89
28,482
Apr 25
The prevailing fintwit narrative comparing this current $QQQ and $SPY rally to April 2025 overlooks several critical structural divergences.
While the 'price action' may mimic April 2025 on a surface level, the underlying mechanics are completely different this time around:
> Dollar divergence: Last year’s uptrend was fueled by a weakening dollar - $DXY put in a death cross in April 2025. This time, equities are fighting a golden cross on the DXY. The tailwind has officially become the headwind.
> Sector rotation: The overall trend is still towards defensive sectors on the weekly and monthly timeframes. Last April, it was a violent rotation back towards offensives.
> Broken breadth: While the indices look strong, the % of stocks reclaiming their 20dma and 200dma is struggling. Completely different than the April 2025 recovery where these moving averages were reclaimed with absolute ease.
> Anemic volume: We are seeing significantly less conviction than we did in 2025. This move up is on even lower volume than last year.
> Macro context: All of this is happening against the backdrop of an unprecedented, imminent energy shock.
This move higher lacks the structural integrity of last year.
It's a hollow rally.
2
3
32
15,614
Apr 23
$DXY appears set for a major rally.
Very suboptimal for $QQQ and $SPY.
DXY:
> Golden cross on the daily
> Higher low on both the daily and monthly
> Ready to launch off the 150-month sma
Energy prices and the standoff in Hormuz suggest "higher for longer" is the most probable path.
The Iran war will likely last much longer than anyone expects.
Technical study for educational purposes; not financial advice or a trade signal.
Left panel: Daily
Right panel: Monthly
(8ema 🟠 / 21ema 🟣 / 50sma 🟡 / 150sma 🔵 / 200sma 🟢)

14
6,852
Apr 22
$NVDA is on track for its lowest monthly volume in over 25 years.
The last time it was this low was in 1999.
Its climb into thin air is reaching a critical inflection point.
Apr 6
$NVDA : A Climb Into Thin Air
NVDA has now printed 24 consecutive monthly candles below average volume, all during its multi-year ascent. Meanwhile, its average volume has been in a steady decline. This stark bearish divergence is a major red flag.
Analogs:
> $CSCO (2000):
Nearly identical behavior throughout its 1997-2000 run-up, during which 29 out of 36 months closed below average volume, including the last 17 consecutive months. This prolonged period of low volume preceded its massive dot-com liquidation on high volume.
> $MSFT (2000 & 2025-Current):
Same pattern, with rising price on thinning monthly volumes prior to both the dot-com peak and its ongoing 2026 correction following its Oct 2025 peak.
> $NVDA (2022):
A similar low-volume run-up (2019-2021) preceded its deep 2022 correction when it finally saw volume expansion on the sell side.
Technical Outlook:
Multi-year ascents built on persistently below average volume are structurally fragile and eventually run out of oxygen. Without a transition to consistent above-average buying volumes at the monthly scale, $NVDA remains highly susceptible to a significant correction if selling pressure accelerates in the backdrop of $SPY and $QQQ weakness and continued rotation towards defensive, low-beta sectors.
Technical study for educational purposes; not financial advice or a trade signal.
(8ema orange / 21ema purple / 50sma yellow / 150sma blue / 200sma green)

1
13
3,324
Apr 21
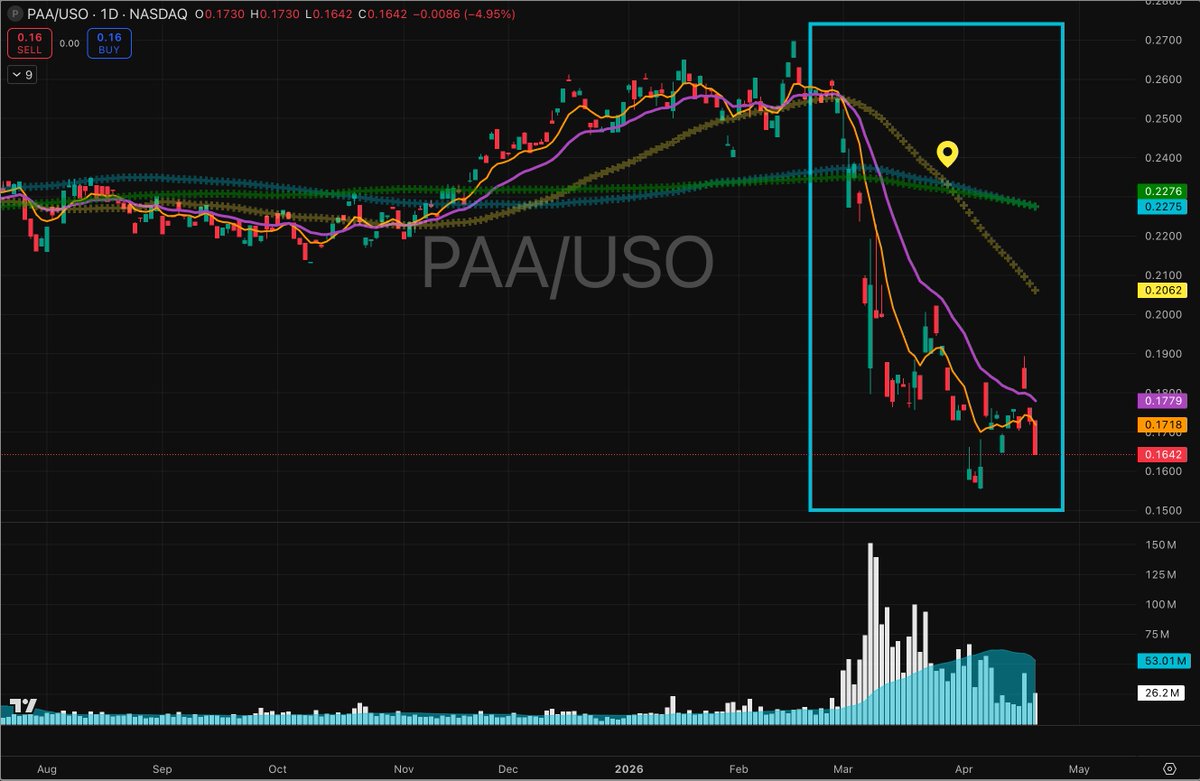
The US oil export ban is no longer a tail risk; it’s now the base case.
As crude tanker and US midstream charts break down while PADD 3 refineries show strength, a major policy shift appears imminent.
Most concerning are the death cross and bear flag in the PAA/USO ratio - this divergence between logistics and commodity is a massive warning sign.
$FRO $PAA $USO $XLE $VLO
Technical study for educational purposes; not financial advice or a trade signal.
(8ema orange / 21ema purple / 50sma yellow / 150sma blue / 200sma green)
3
6
33
22,893
Apr 18
A lot of short-sighted analysis on fintwit lately.
We are seeing a classic postponed death cross on $SPY and $QQQ - the exact same behavior observed in June 2000. History shows that a delay doesn't mean a cancellation.
September 2000 shows how this technical trap plays out.
Apr 10
Just like in June 2000, $QQQ is merely postponing its death cross until several months from now.
(Take a look at Sep 2000)
1
1
10
2,174
Apr 10
Just like in June 2000, $QQQ is merely postponing its death cross until several months from now.
(Take a look at Sep 2000)
Apr 6
$NVDA : A Climb Into Thin Air
NVDA has now printed 24 consecutive monthly candles below average volume, all during its multi-year ascent. Meanwhile, its average volume has been in a steady decline. This stark bearish divergence is a major red flag.
Analogs:
> $CSCO (2000):
Nearly identical behavior throughout its 1997-2000 run-up, during which 29 out of 36 months closed below average volume, including the last 17 consecutive months. This prolonged period of low volume preceded its massive dot-com liquidation on high volume.
> $MSFT (2000 & 2025-Current):
Same pattern, with rising price on thinning monthly volumes prior to both the dot-com peak and its ongoing 2026 correction following its Oct 2025 peak.
> $NVDA (2022):
A similar low-volume run-up (2019-2021) preceded its deep 2022 correction when it finally saw volume expansion on the sell side.
Technical Outlook:
Multi-year ascents built on persistently below average volume are structurally fragile and eventually run out of oxygen. Without a transition to consistent above-average buying volumes at the monthly scale, $NVDA remains highly susceptible to a significant correction if selling pressure accelerates in the backdrop of $SPY and $QQQ weakness and continued rotation towards defensive, low-beta sectors.
Technical study for educational purposes; not financial advice or a trade signal.
(8ema orange / 21ema purple / 50sma yellow / 150sma blue / 200sma green)
12
4,279
Apr 8
Crude tankers all red on supposedly bullish news is very high signal regarding Hormuz.
Reiterating major caution for crude tankers.
I believe a significant, prolonged downturn is coming for this sector.
$FRO $DHT $ECO $TNK
Not financial advice or a trade signal.
Mar 31
$FRO just put in a textbook bearish reversal monthly candle - the highest volume monthly candle in over 3 years.
Major caution warranted for crude tankers at this juncture, as a prolonged multi-year downturn looks highly probable if this candle plays out.
Technical analysis below.
cc: @ed_fin @mintzmyer
5
1,501
Apr 7
Reiterating $BTC potential to 25-35k.
Inverted high tight flag in play.
Not financial advice or a trade signal.
Mar 19
$BTC
During almost the entire uptrend from April to October 2025, $BTC had below average weekly volume. Conversely, during this current downtrend from October, BTC has been consistently above average weekly volume.
This bearish divergence in volume suggests large-scale distribution during this downtrend setting up for further significant downside.
Additionally, there is about to be a monthly 8/21 bearish cross. For context, the last monthly 8/21 bearish cross was in June 2022.
Even if BTC does make a move up, it would face significant resistance at 82-83-84k, where significant moving averages are currently stacked together - 21 week ema / 21 month ema / 8 month ema.
Without significantly above average volume, greater than the February weekly volume at a minimum, it is likely to reject around these levels for another leg down.
Given that the prior bottoms for BTC have been overshoots of the 50 month sma, it seems reasonable to think BTC might do the same for its next bottom.
Given the extended pattern of the most recent top, BTC might take awhile to actually reach its bottom, longer than one might expect.
A possible area for BTC to bottom would be the 25-35k range, near the prior mid-2023 confluence of price action and the monthly 50 sma / 21 ema / 8 ema.
Additionally, during this downtrend, BTC made a significant move down on high volume. This kind of move is resembles a high tight flag, just in the bearish direction. Of note, BTC went down 50% in only 4 months, from October to February. If this 'tight flag' were to play out, it could go down another 50% lower, putting it in the 35k range.
(8ema orange / 21ema purple / 50sma yellow / 150sma blue / 200sma green)
Technical study for educational purposes; not financial advice or a trade signal.


8
1,851
Apr 6
$TSLA with an imminent death cross and currently below the 21 month ema. Reiterating $270 potential.
Not financial advice or a trade signal.
Mar 20
$TSLA structural breakdown, $270 now feasible
> losing 50 week MA
> next stop is the 21 month ema
> once that's lost... $270-290 area
(massive confluence of 150/200 week 50 month sma prior 2023 highs and critical area in 2025)
(8ema orange / 21ema purple / 50sma yellow / 150sma blue / 200sma green)
Technical study for educational purposes; not financial advice or a trade signal.

8
1,407
Apr 6
$NVDA : A Climb Into Thin Air
NVDA has now printed 24 consecutive monthly candles below average volume, all during its multi-year ascent. Meanwhile, its average volume has been in a steady decline. This stark bearish divergence is a major red flag.
Analogs:
> $CSCO (2000):
Nearly identical behavior throughout its 1997-2000 run-up, during which 29 out of 36 months closed below average volume, including the last 17 consecutive months. This prolonged period of low volume preceded its massive dot-com liquidation on high volume.
> $MSFT (2000 & 2025-Current):
Same pattern, with rising price on thinning monthly volumes prior to both the dot-com peak and its ongoing 2026 correction following its Oct 2025 peak.
> $NVDA (2022):
A similar low-volume run-up (2019-2021) preceded its deep 2022 correction when it finally saw volume expansion on the sell side.
Technical Outlook:
Multi-year ascents built on persistently below average volume are structurally fragile and eventually run out of oxygen. Without a transition to consistent above-average buying volumes at the monthly scale, $NVDA remains highly susceptible to a significant correction if selling pressure accelerates in the backdrop of $SPY and $QQQ weakness and continued rotation towards defensive, low-beta sectors.
Technical study for educational purposes; not financial advice or a trade signal.
(8ema orange / 21ema purple / 50sma yellow / 150sma blue / 200sma green)
2
20
15,317
Apr 2
3 months ago, I flagged the unusual outperformance of staples, tankers, and containerships alongside bullish energy option flow and record large prints in bond, growth, and country-specific ETFs.
I noted these signals pointed to a *massive geopolitical event* on the horizon, and that this would provide the narrative for a broad market correction.
6 weeks later, the Iran war began.
That correction is now here. I expect a significant downtrend to follow.
$SPY $QQQ $XLP
Not financial advice or a trade signal.

6
1
33
19,544