
Fun to use charting framework created by the team behind @visualizenews
Joined February 2021
- Tweets 32
- Following 55
- Followers 23
- Likes 7
13 Photos and videos


If you’re curious about our library and how to use it, we just published a bunch of posts on our new blog blog.chrt.io #DataVisualization #dataviz #chrt
2
chrt.io retweeted

18 Jul 2024
In the Rwandan 🇷🇼 General Elections, President Paul Kagame was re-elected for a 4th term with over 99% of votes 🗳️
Check out the results for both the presidency and the Chamber of Deputies at 2024.visualize.news/#RW
#RwandaElections #PaulKagame #Elections #dataviz
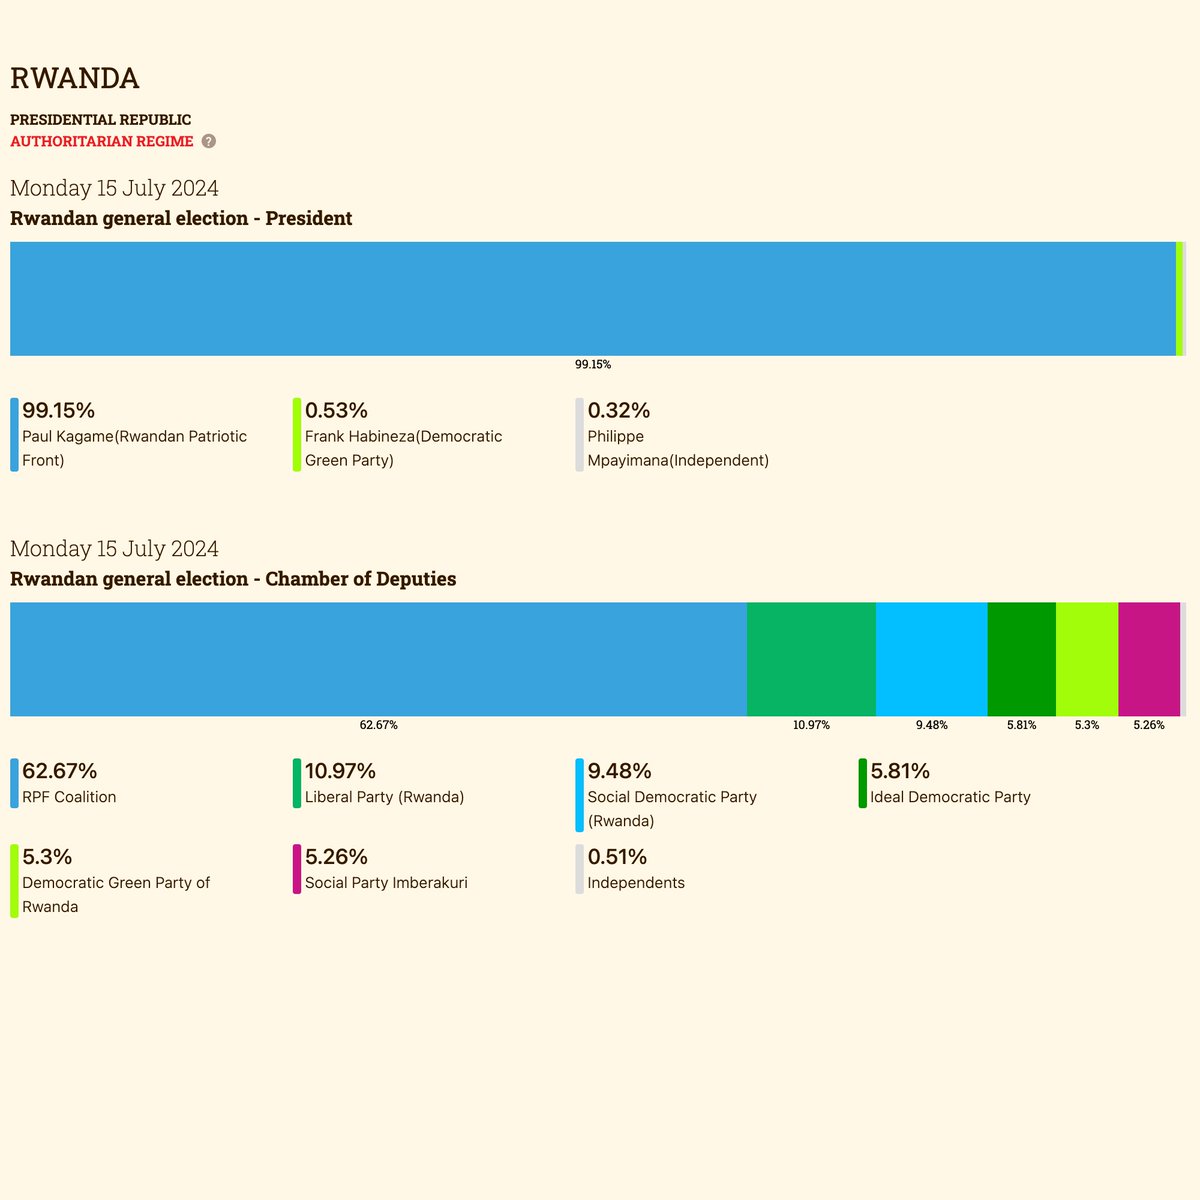
ALT Two charts showing the results of the Rwandan general elections: President Paul Kagame re-elected with over 99% of the votes and the results for the Chamber of Deputies.
2
93
chrt.io retweeted
14 Jun 2024
Just published: 2024 - ELECTIONS YEAR
Our latest project explores the 2024 elections around the world , dive into the global pulse of democracy. Check out insights from India, Mexico, and more at 2024.visualize.news
#dataviz #datavis #elections2024
2
117
A visual snapshot of @premierleague @SerieA_EN and @LaLigaEN
Built with @chrt_io
#football #dataviz #charts #PremierLeague #SerieA #LaLigaSantander #futbol #calcio #soccer @juventusfcen @en_sscnapoli @Arsenal @ManCity @FCBarcelona @acmilan @realmadrid @ManUtd
ALT After 17 matches, Arsenal is leading the Premierleague while Manchester City is trying to close the gap
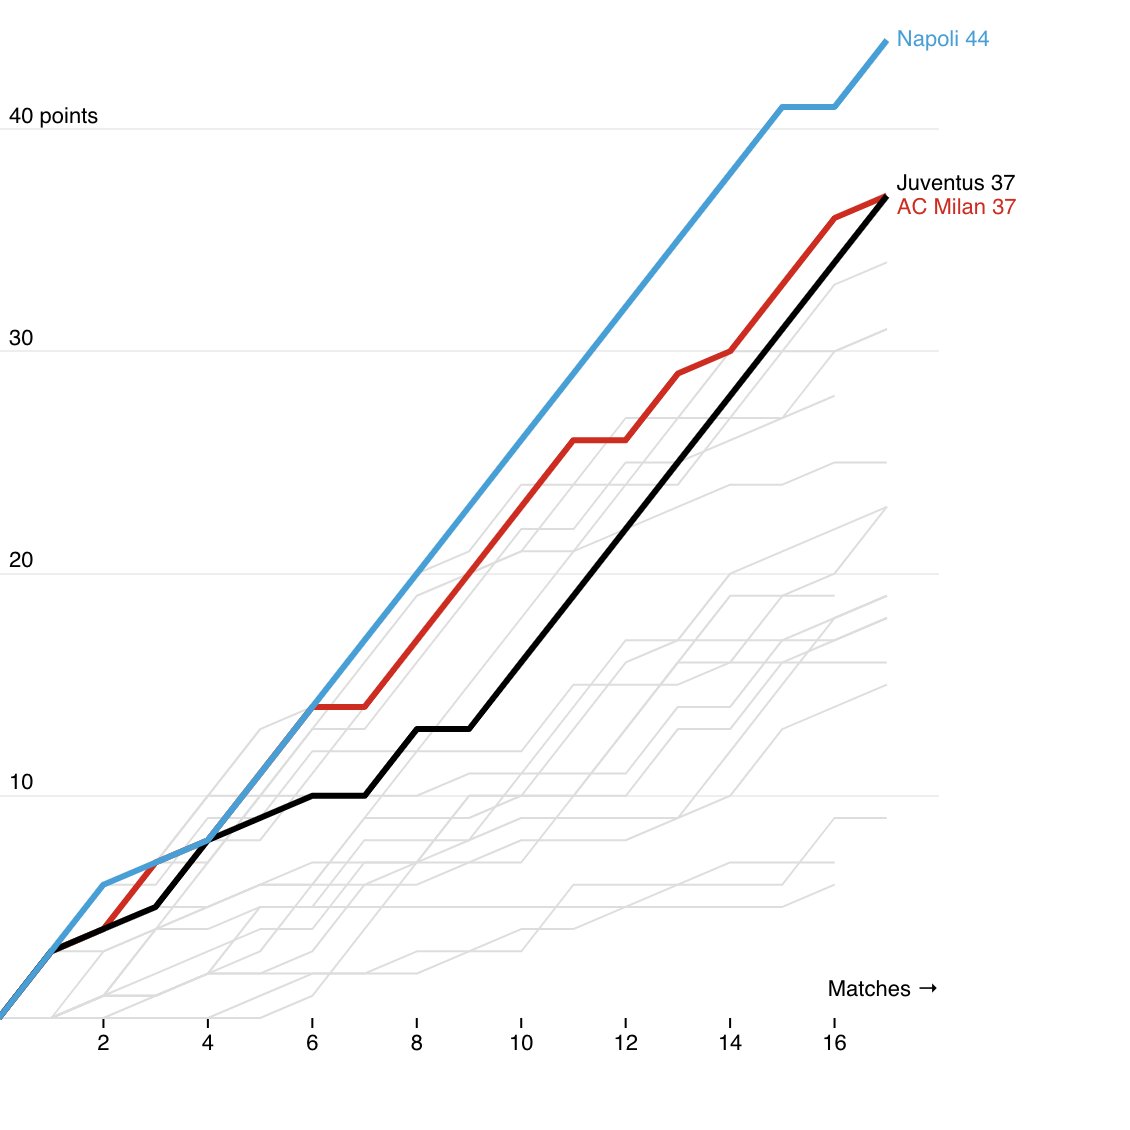
ALT In Italy, Napoli is leading with 7 points over AC Milan and Juventus, with the bianconeri extending their winning streak to eight on Saturday as @Danilo’s late goal secured a 1-0 victory and set up huge clash with Napoli on Friday.
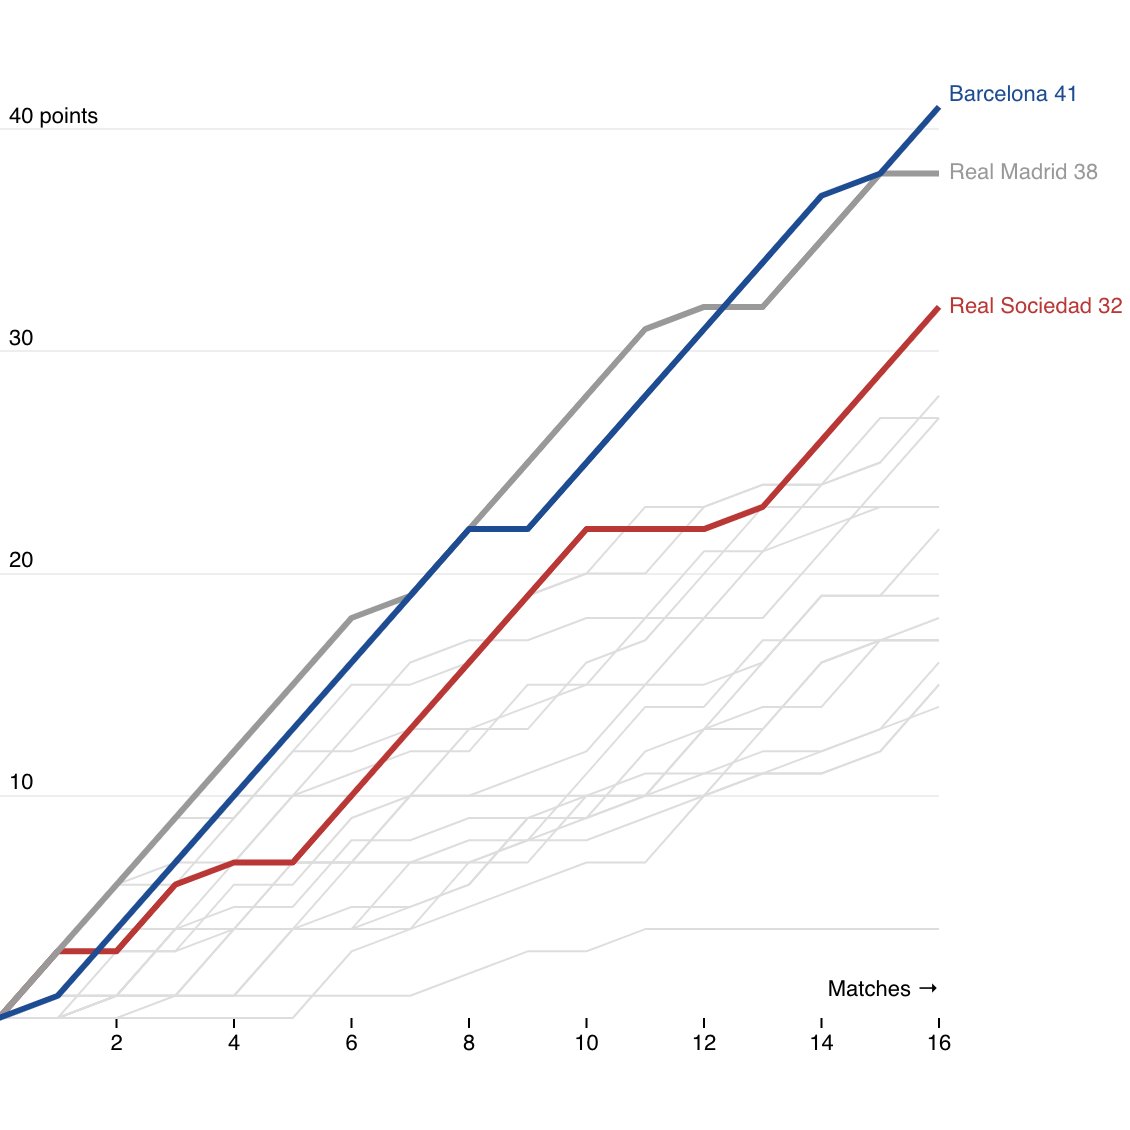
ALT In Spain Barcelona took the lead after Atletico Madrid win and Real Madrid's defeat by Villarreal.
2
355
chrt.io retweeted

20 May 2022
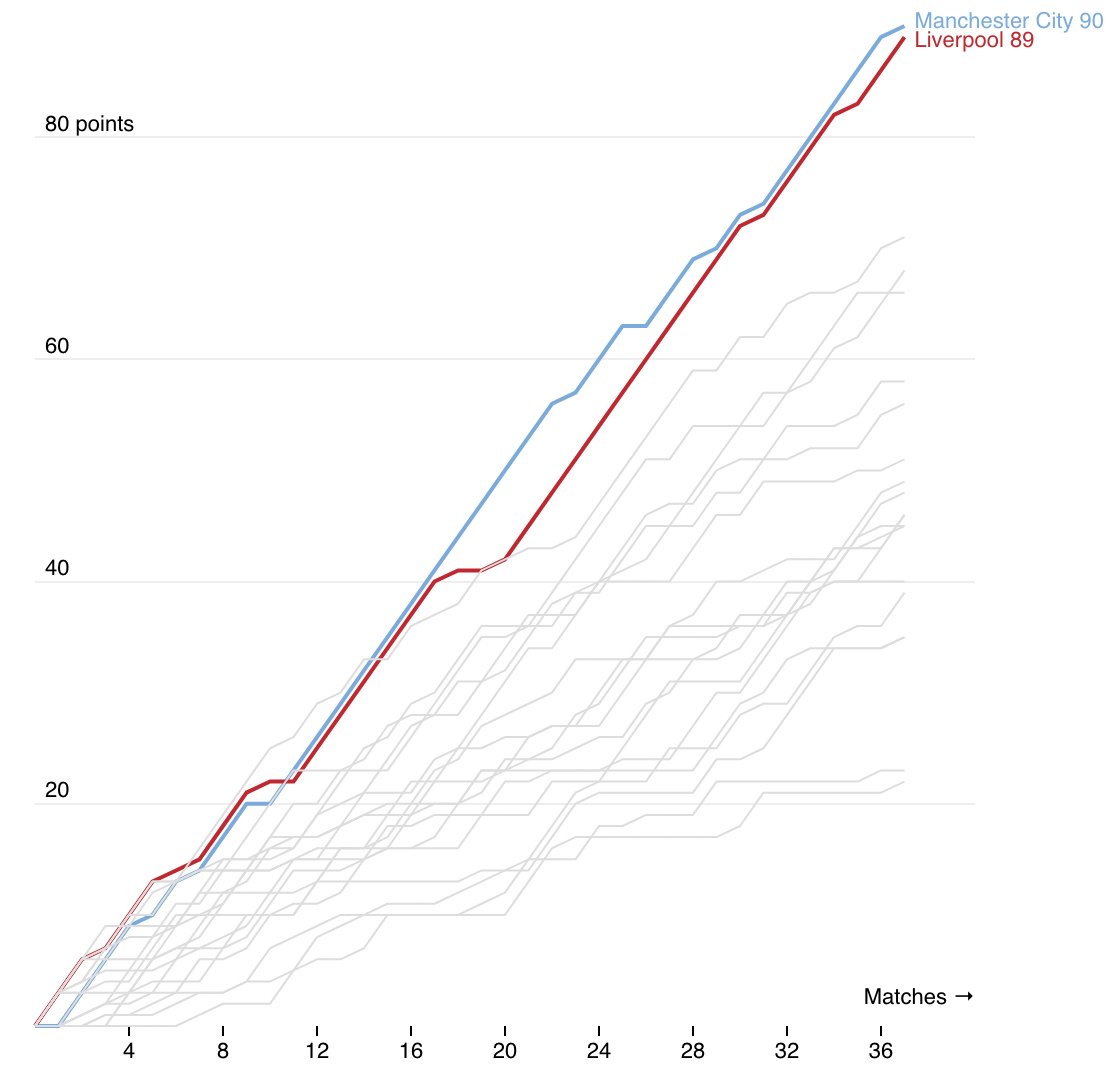
One final game
#SerieATIM #Milan #Inter #SerieA
@SerieA_EN @acmilan @inter
#PremierLeague #ManCity #Liverpool
@LFC @ManCity @premierleague
#dataviz #football
#charts made with @chrt_io

1
1
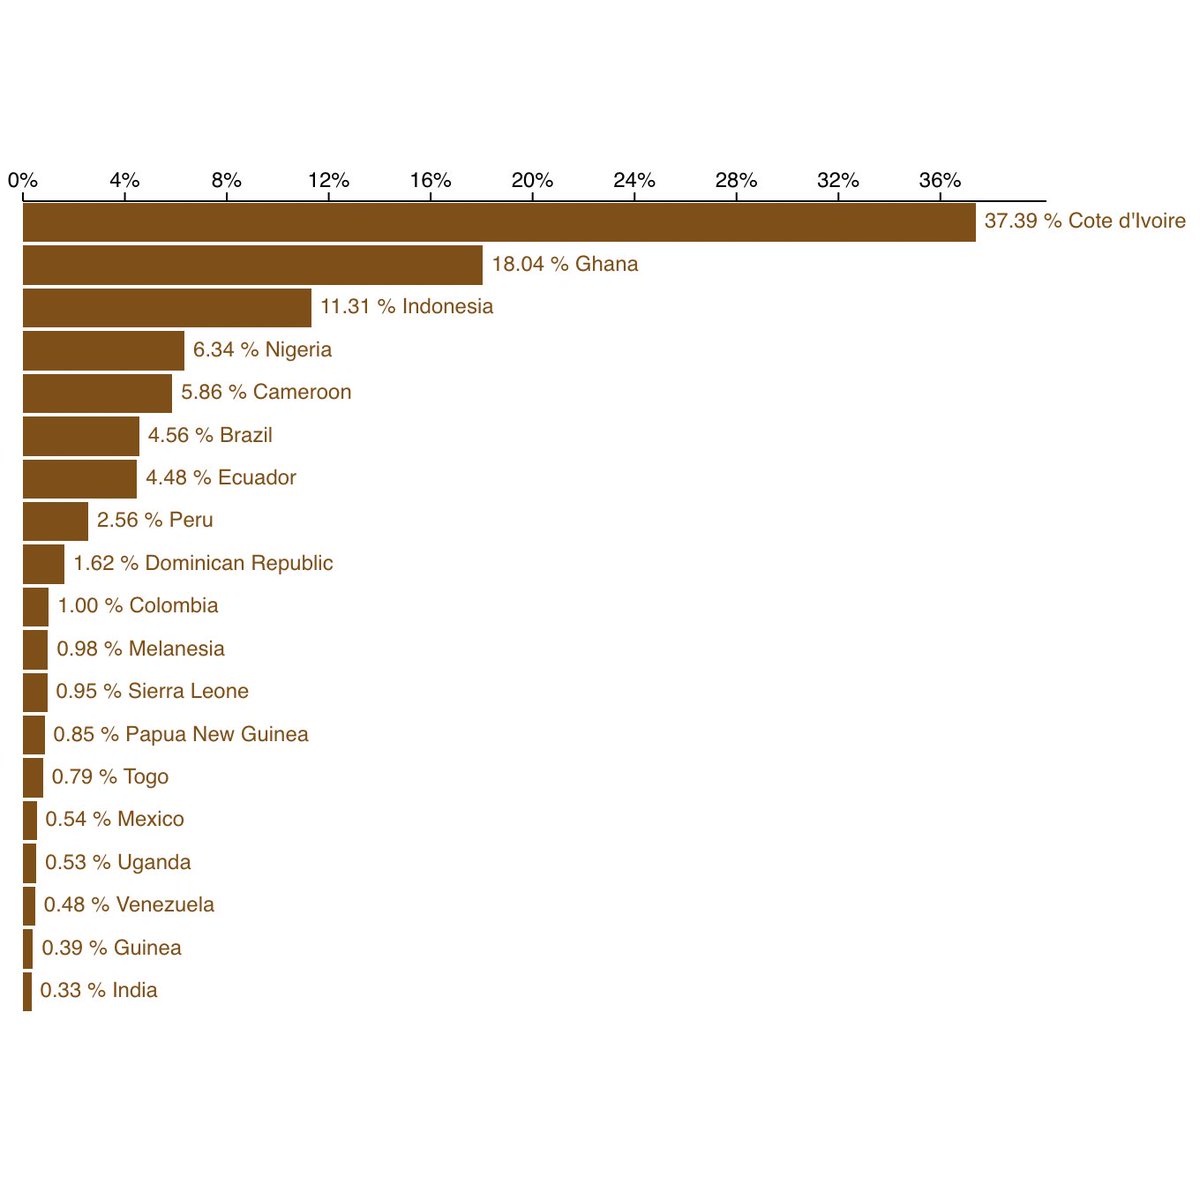
Côte d'Ivoire is the world's largest producer of cocoa, in 2018 it produced 1.96m tonnes of cocoa beans - almost 40 percent of the worldwide production. Cocoa is strategic in Côte d'Ivoire: it accounts for 10% to 15% of GDP, nearly 40% of export earnings. #Ivorycoast #chart 3/4
1
1
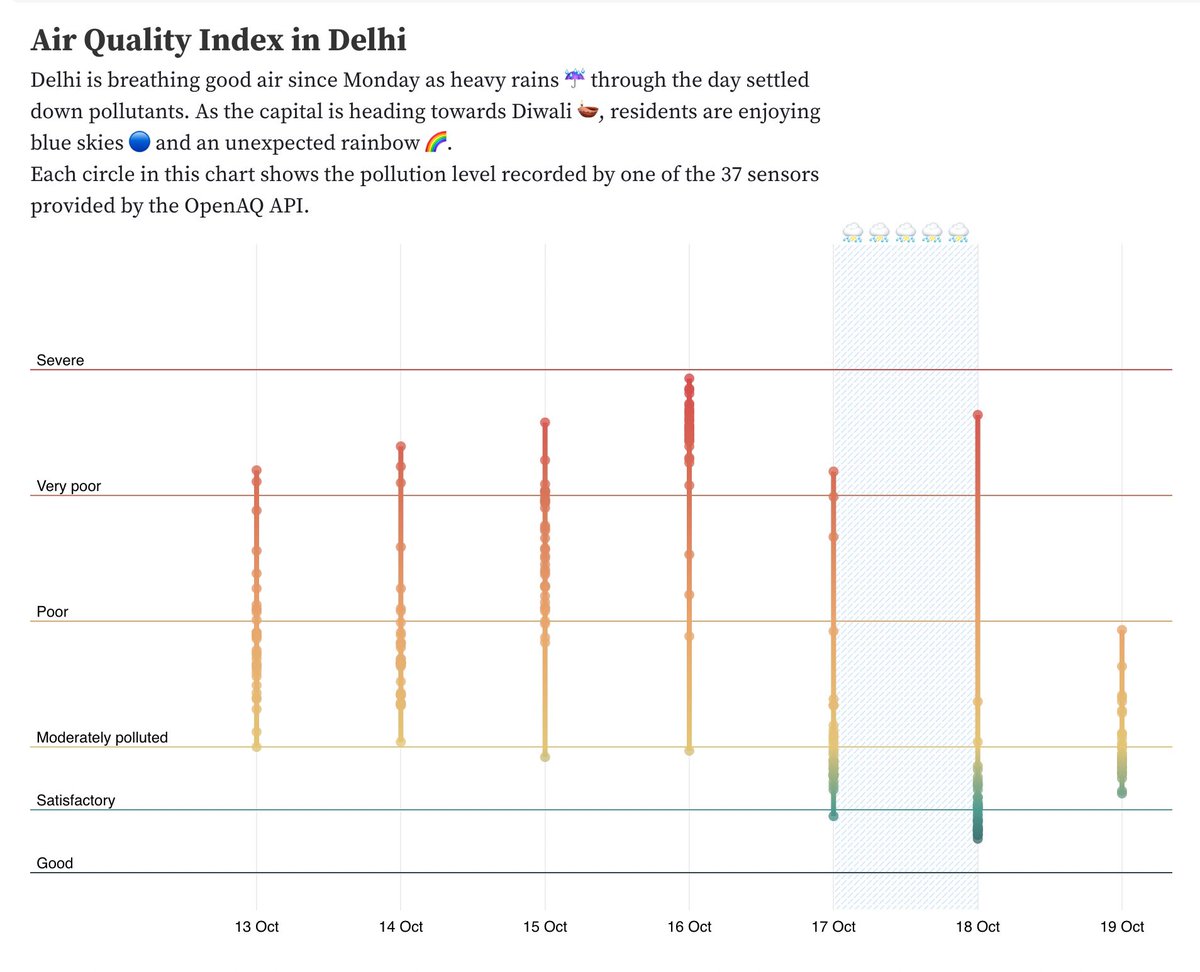
Delhi could breathe good air for a couple of days as heavy rains ☔ through Monday settled down pollutants. As the capital is heading towards Diwali 🪔, residents enjoyed blue skies and an unexpected rainbow 🌈. This is a series of charts about Air Quality around the world.
1
2
1
Let's make a bar chrt! Bar chart A look at how quickly
🚄 we could code 👩💻 together a simple bar chart with
@chrt_io
Forked from this #ObservablePlot notebook observablehq.com/@enjalot/si…
2
2
2
...and yes! It works seamlessly in @observablehq as you can see from the screencast inspired from the recent bar chart screencap by @enjalot!
1
1
We are working on our diary 🔖 to document the process with bits and pieces of code and ideas from @visualizenews @simonelippolis @littleark
Keep around from more stuff!


chrt.io retweeted
6 May 2021
The #SanremoMusicFestival is the #pop event of the year in #Italy since the 1950s. We tried to understand how the #genderparity issues have been addressed in such kind of event.
Chart made with the beta version of @chrt_io
#dataviz #datavisualization #chart #chrt #sanremo

2
1
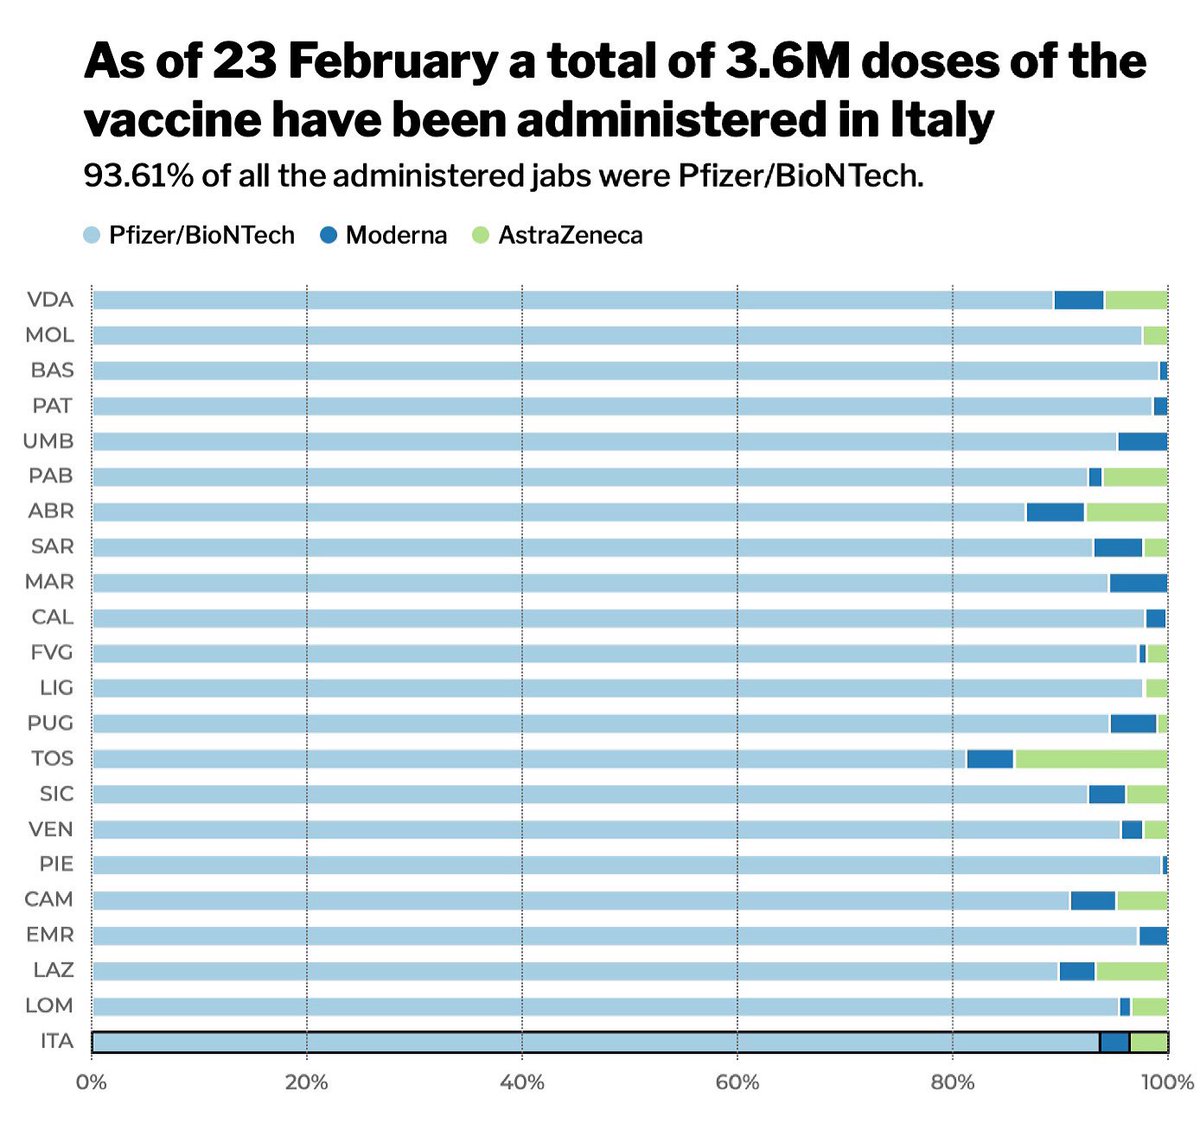
Weekly #coronavirus progression since January, 1st 2021 in #Italy. #datavisualization created by @simonelippolis for @visualizenews using the beta version of our library @sveltejs. Data from @DPCgov
#chart #dataviz
2
1
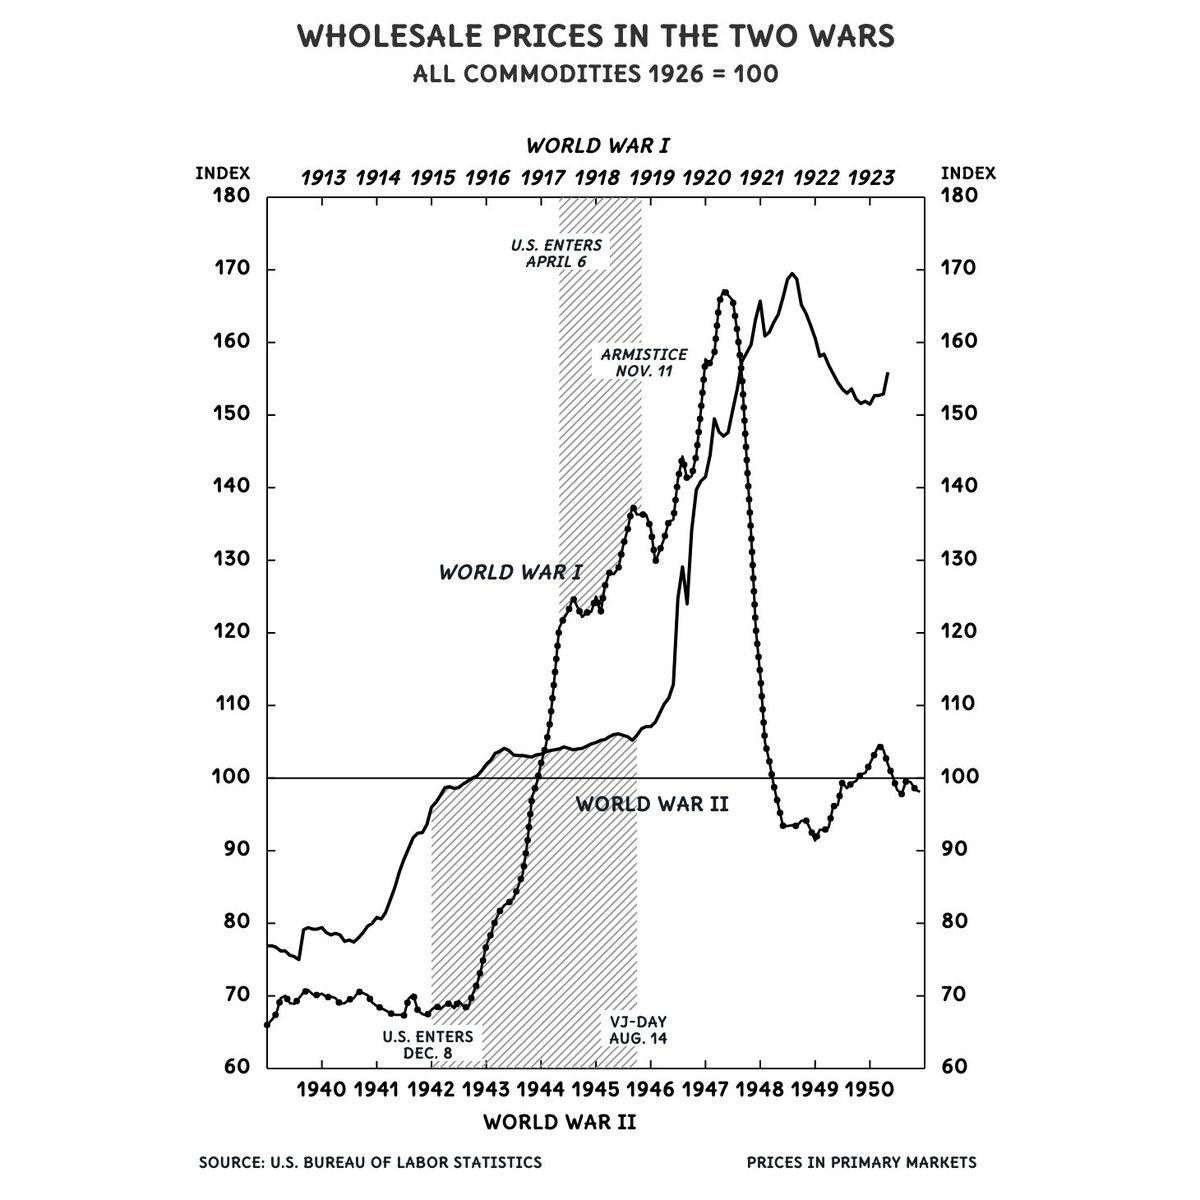
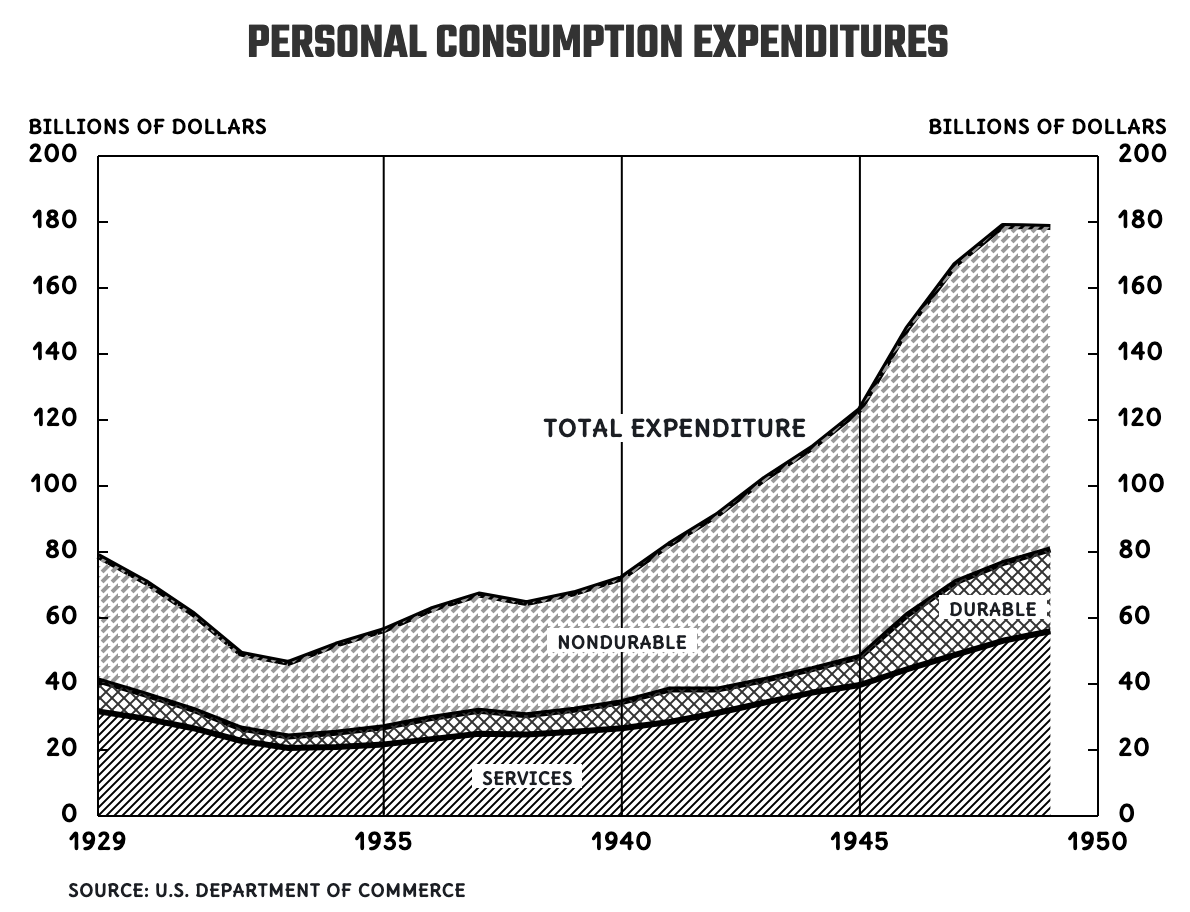
This is part 2 in the series from “Charting Statistics” by Mary Eleanor Spear. We are fascinated by the way two different time scales have been used. It is not common to find multiple scales in charting frameworks. chrt.io provides a way to define multiple scales.
1
Mary Eleanor Hunt Spear (March 4, 1897 – January 22, 1986) was an American data visualization specialist, graphic analyst and author, who pioneered the development of the bar chart and box plot. She worked at the U.S. Bureau of Labor Statistics, Graphic Consultant and Illustrator