
Follower of Jesus | #SQLServer | Python | Machine Learning | Building an app for #PowerBI | benmakesdataeasy.com | Helping make data easier to work with
Joined June 2022
- Tweets 6,413
- Following 7,431
- Followers 3,464
- Likes 14,165
354 Photos and videos


Pinned Tweet

Mar 16
A little more walk through on a new forecasting script I created that ties together Python FB Prophet Power BI : )
Check out the script used in the community area on my YouTube channel. Greatly appreciate likes/subscribes there as well : )
Keep at it everyone!
youtube.com/@BenMakesDataEas…
Mar 15

Forecasting is a game changer in the realm of data analytics : ) Watch me easily create a Python FB Prophet Power BI forecasting tool in under an hour : ) Cool factor 1 million.....maybe 1 billion!
1
594
BenMakesDataEasy retweeted
Super excited for the next release of the power-bi-agentic-development repo next week. It's all coming together!

2
1
20
646
BenMakesDataEasy retweeted

Jun 12
You can subscribe to blog.tabulareditor.com to be notified when we publish new articles. We're planning a lot for our future content, including recording new videos on topics around Fabric/Power BI, analytics and agentic development.
Our content motto: All signal, no noise!
We also have a strict policy against AI-generated content, including AI-generated text and images. Everything we publish is written by a human and reviewed by humans; AI is only enabling creation of new deterministic tools that we use to create our content.

1
3
26
2,720
BenMakesDataEasy retweeted

Jun 12
At Power BI DC days, Shreya Harvu and Bhargav Patel remind us why good semantic models are are still critical if you want AI to interact with your data.

1
1
3
188
BenMakesDataEasy retweeted
Jun 10
A preview of the next version of the pbir-cli, which can refresh and screenshot the Power BI canvas using the new Power BI desktop preview feature from Microsoft.
This makes the agent a lot more powerful, and the experience more fun / satisfying. View in full-screen!
7
51
3,811
BenMakesDataEasy retweeted
Jun 10
A new version of the pbir-cli / power-bi-agentic-development skills let you refresh the Power BI canvas.
With the te-cli & chaining commands you (or an agent) can do cool stuff, like fixing reports after model renames.
Will demo this in our webinar later today.
2
1
33
3,283
BenMakesDataEasy retweeted
Jun 9
Join me at Power BI Days D.C. for learning, discussion, and probably a little chaos.

1
2
97
BenMakesDataEasy retweeted

Jun 9
I am glad to see new videos describing specific Synoptic Panel features because it means I didn't have to record them!
This is a tutorial of the Map Selector feature: you create a DAX measure that returns the name of the map to display. This way, you can respond to the filter context and make custom choices based on selections in other visuals.
youtube.com/watch?v=nnDcOq4u…
2
6
1,333
BenMakesDataEasy retweeted
Jun 9
Tomorrow we're giving a webinar about the te-cli. Sign up here free: tabulareditor.com/resources/…
I'll speak briefly about why CLIs are interesting for agents, even if you favor other approaches like an MCP server.
2
2
23
2,060

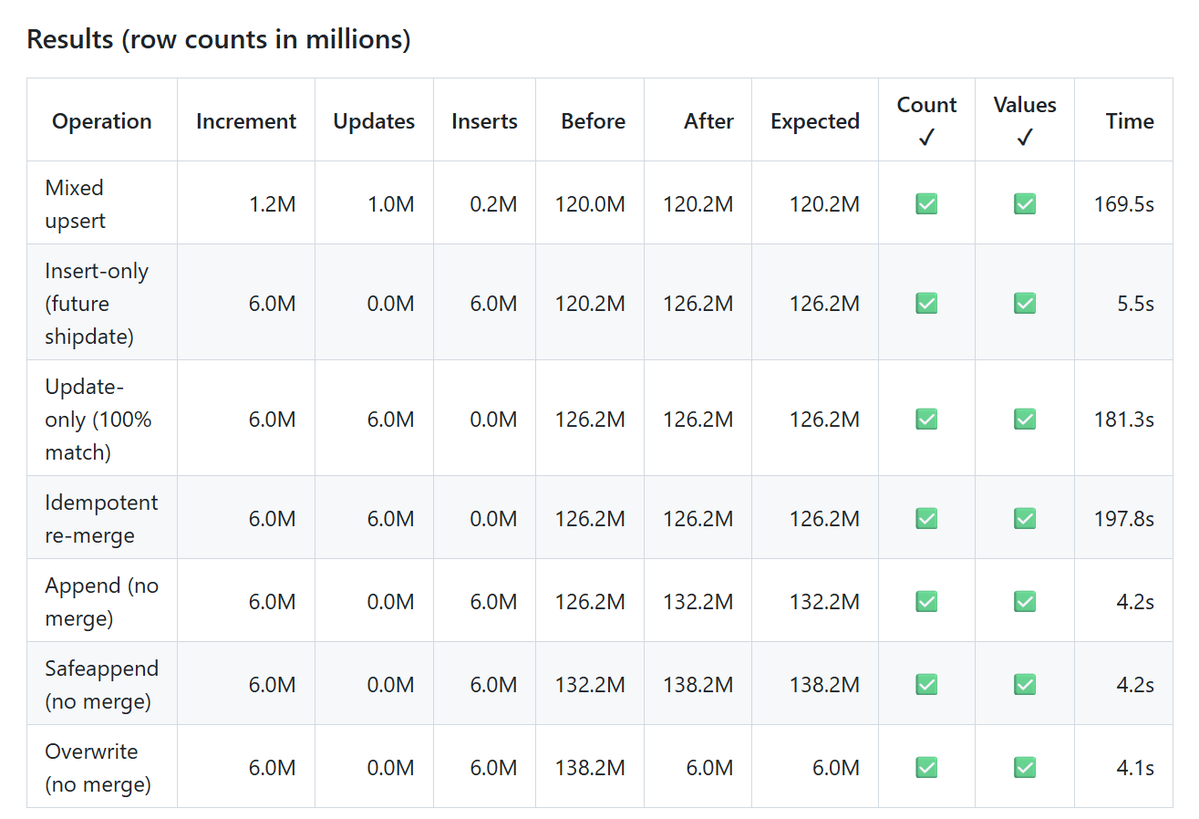
added more tests (merge, append, safe append etc) considering it is using github runner with modest hardware, that's not bad at all
github.com/djouallah/duckrun
#deltalake #rust #arrow #duckdb
3
13
1,200
BenMakesDataEasy retweeted
Jun 6
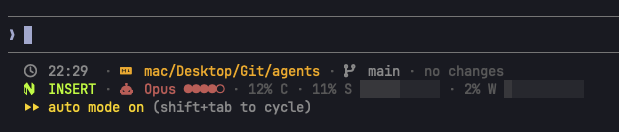
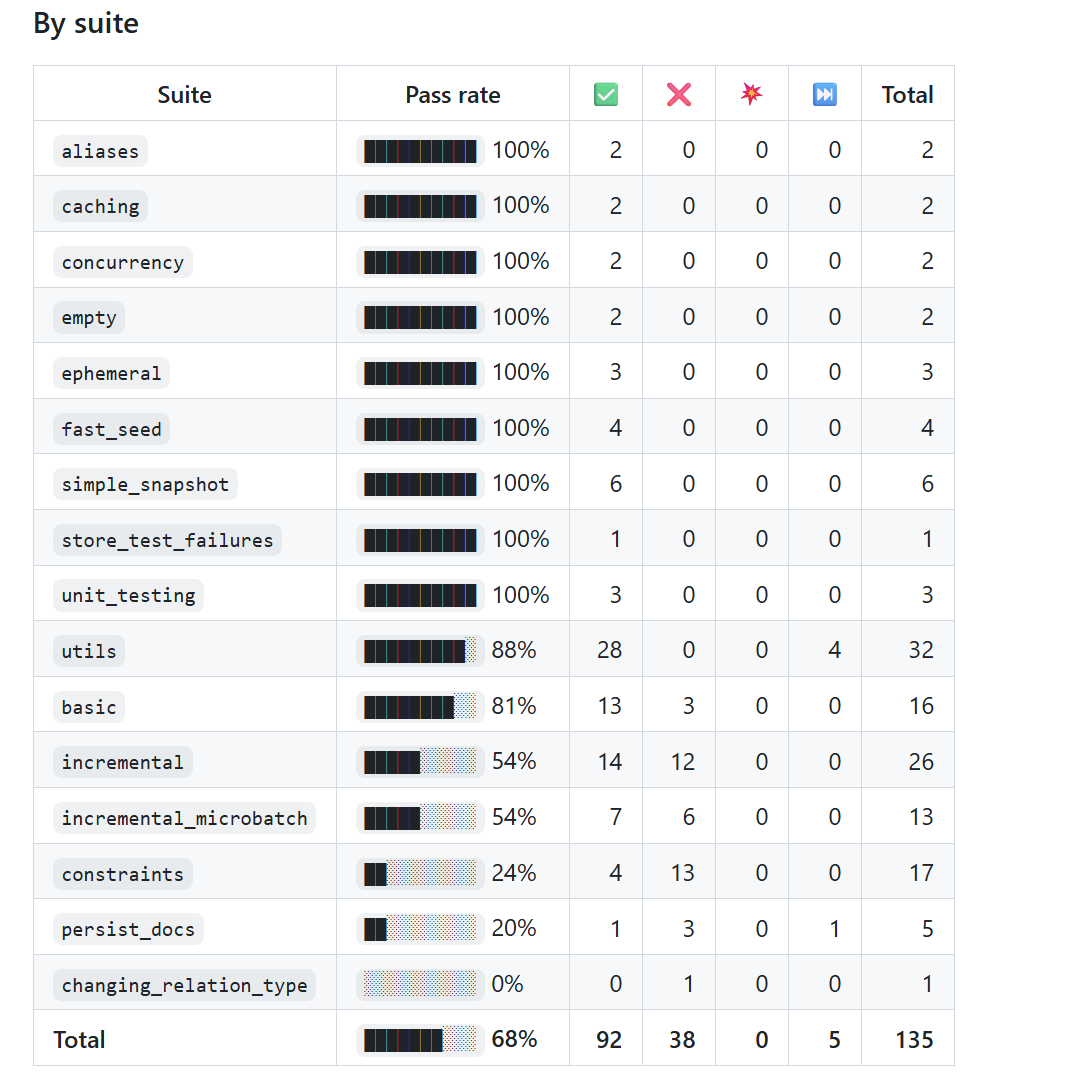
Added a detection which estimates and warns whether a session or week will exceed its limits should usage continue linearly at the same rate, and throws a blinking warning if so.
The bar is a linear gauge in 20% increments which fills in layers to warn of usage.

Jun 1

I've formed a habit of changing one thing in my status line every time I update my memory files when wrapping up my work for the day. It's such a fun little ritual.
2
1
12
2,449
I rebuilt #duckrun as a thin #dbt adapter on top of the excellent dbt-duckdb: data is exchanged lazily via the Arrow C-stream interface and materialized as real Delta Lake tables with #delta-rs.
#duckdb #deltalake
github.com/djouallah/duckrun
1
4
15
1,967
BenMakesDataEasy retweeted
Jun 5
If you're a "power bi person" I encourage you to not see data apps as a threat to your work or preferred tooling. I really think we should embrace this as something that opens a whole bunch more possibilities. Don't think in terms of "replace/displace" - just try it.
Jun 4
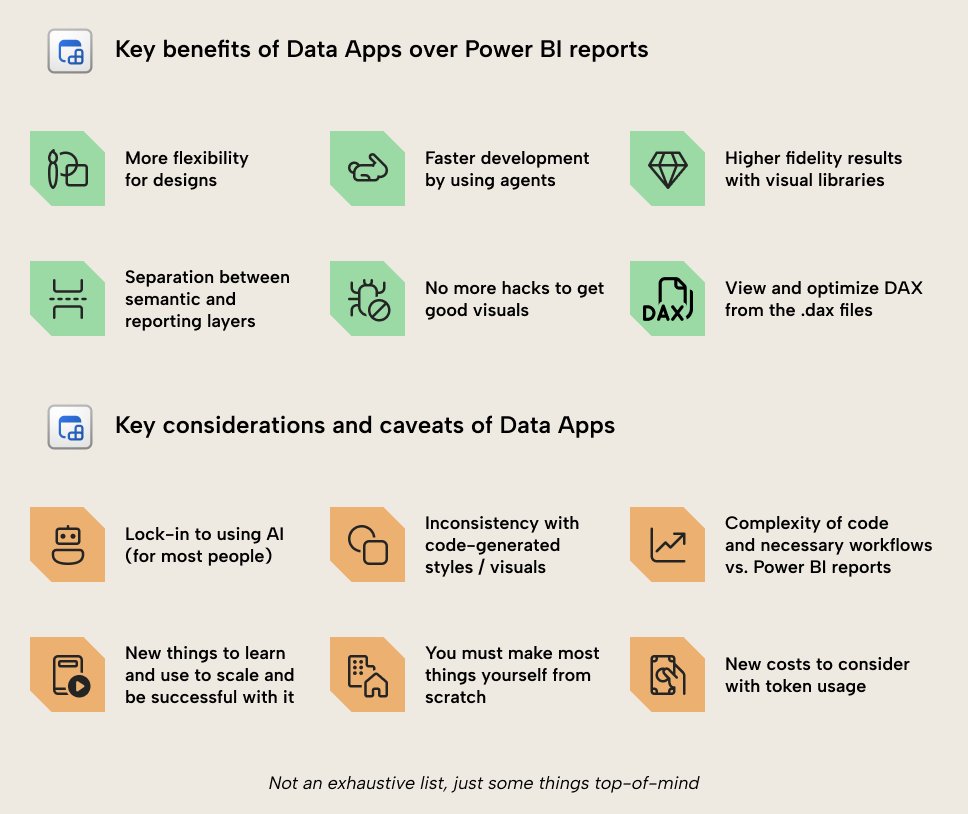
Some key differences when comparing data apps vs reports if you want to decide where to visualize your data.
Boils down to - if you need a nice dashboard with the best visuals -- fabric apps. If you need basic reporting -- power bi. Some nuance in the middle, as always.
3
1
34
2,324
BenMakesDataEasy retweeted

Jun 5
My Parkbench CLI tool allows you to practice streaming events to DuckLake so you can see how it responds.
When streaming data the table updates but no Parquets are written. This is DuckLakes's inlining feature in action.
See the tool here:
github.com/early-signal-tech…
1
4
20
1,480
BenMakesDataEasy retweeted
Jun 4
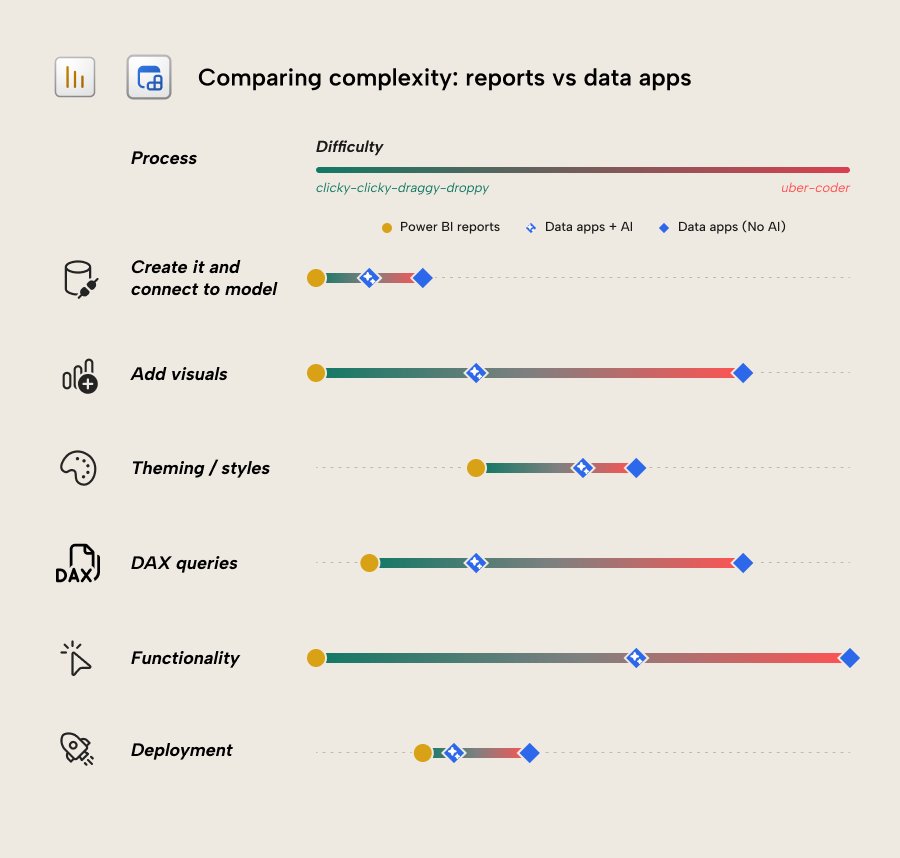
Data apps are more complex than power bi reports since it is all code. Some of this is offset by AI but not all.
That said, data apps work miles better with AI than Power BI does, since it's actual code. You get better results faster and without macguyvering visuals or the model. When I tried making the same design in power bi vs data apps it took me 80% less time in the data app, and that was for something relatively simple.
I have said that data apps don't replace power bi reports, but the truth is that it does raise some uncomfortable questions about the future of reports. There are many consequences of this now being possible.
For instance, from now on, anytime someone demos a dashboard or shares a screenshot, you can't tell from looking at it whether it's a report or a fabric app unless that UI is visible or it's disclosed.
Further, if I share something for power bi, you need to know how to make it. Even with AI you can't replicate it without the config. In a data app, you give a screenshot to Claude and say "make this"- it works 98% of the time. The whole "economy" that's built up around power bi content has the potential to completely change because of that. But more importantly it means users don't have to learn the weird wizardry of power bi UI manipulation to make what they want - they can focus on real design.
For reporting where people need basics like subscriptions, export to excel, etc you should stick to power bi.
For scenarios where you want actual good visualization, though, it's not even close. The numbers favor data apps by a long shot. It is just a question of whether you can manage the step up in complexity, and what you will do if AI prices get too high down the road.
Regardless, I expect we will start seeing many cases where someone approaches their boss with something impressive they built in one hour, and decisions are made. It also has the same "five minutes to wow" of early power bi, but on steroids.
4
4
30
1,948
BenMakesDataEasy retweeted
Jun 3
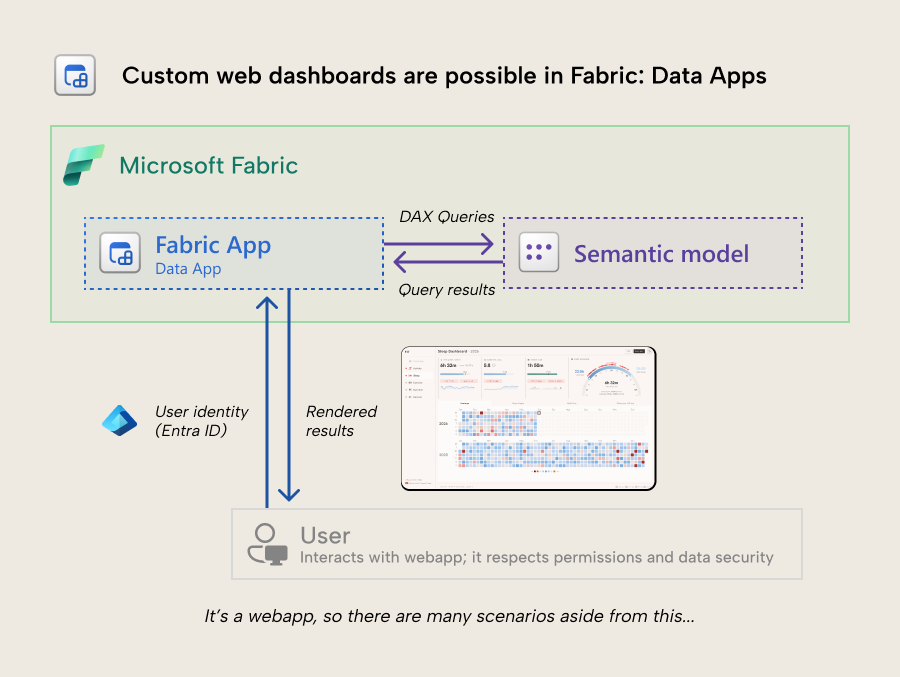
Visualize your semantic model data with Vega/D3.js from Fabric with data apps - a type of Fabric app. Custom web dashboards are now possible.
This is probably the most interested I've been in a new Power BI or Fabric feature, ever.
Read about it: tabulareditor.com/blog/fabri…
1
10
64
35,037
BenMakesDataEasy retweeted

Jun 3
Read this blog post if you want to get an overview of all the new #MicrosoftFabric announcements! They are so awesome, I just need to find the time to try them out. community.fabric.microsoft.c…
3
8
684
BenMakesDataEasy retweeted
Jun 3
I love this - the Fabric CLI is my favorite feature from the Fabric team. It does create a bit of confusion among those using i.e. semantic link labs in notebooks already.
Anything I automated with notebooks before I've moved out of fabric with the CLI to i.e. actions/pipelines
Jun 2

You can now use the #MicrosoftFabric CLI in VS Code, Notebooks or your LLM to complete a whole lot of different capabilities using automation. community.fabric.microsoft.c…
1
6
23
3,600
BenMakesDataEasy retweeted
May 30
Hot take for a Saturday morning:
The new card visual debate has produced more LinkedIn posts than actual card visuals in production.
Anyway, if you're tired of the whole thing, OKViz has this thing called Card with States. States, thresholds, colors, you know the drill. Certified and free forever. Just saying. okviz.com/card-with-states/
How did you actually handle the switch? Wrong answers only, it’s Saturday ;)
1
9
1,024
BenMakesDataEasy retweeted
May 29
In 2 hours (18:00 CET) Peer from Tabular Editor will be presenting the Tabular Editor CLI - come check it out and see why I'm so excited about this. youtube.com/live/IKNf8s73SOE…
1
2
5
1,875
BenMakesDataEasy retweeted
May 29
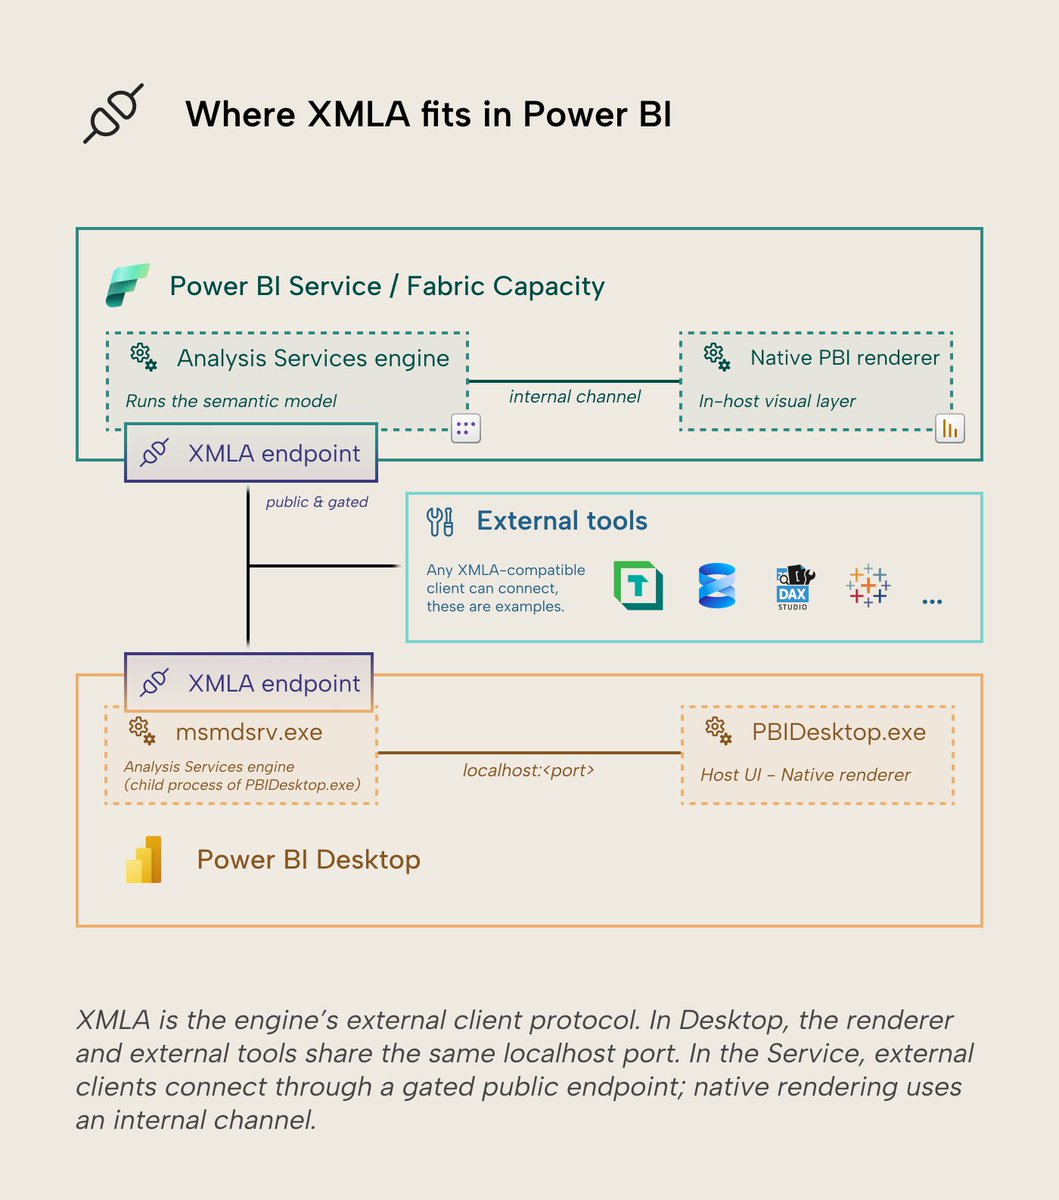
The XMLA endpoint in Power BI - What is it, and how do you use it?
This article by Ruben walks through the basics of the XMLA endpoint and why it's interesting not just for external tools but also Power BI Desktop and AI integrations via MCP/CLI.
Link: tabulareditor.com/blog/the-x…
1
5
37
2,245