
Insights, charts and data to create shared knowledge and expand our understanding of India.
- Tweets 278
- Following 11
- Followers 9,340
- Likes 12
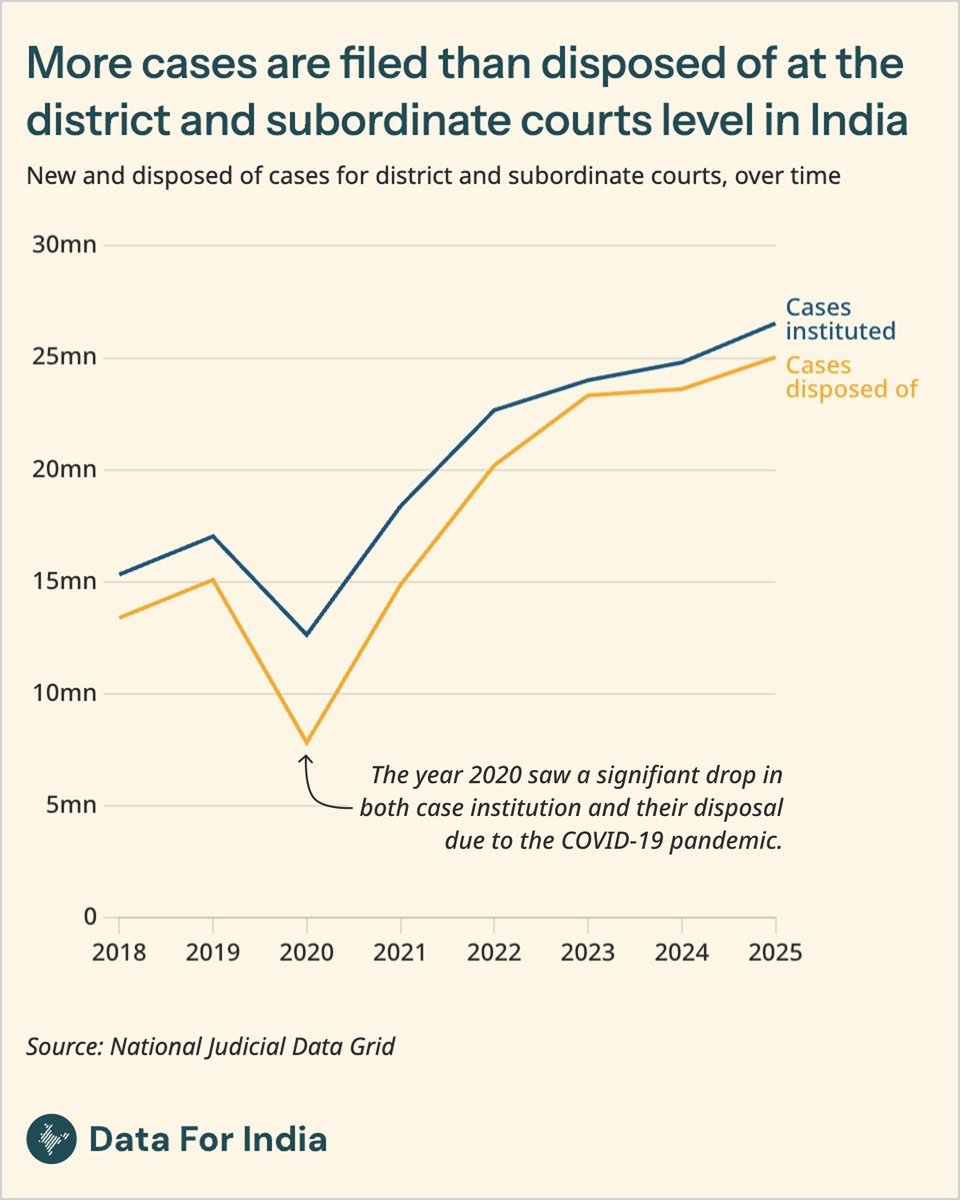


ALT Title: More cases are filed than disposed of at the district and subordinate courts level in India Sub-title: New and disposed of cases for district and subordinate courts, over time Explanation: A line chart shows that from 2018 to 2025, the number of cases instituted is consistently higher than the number of cases disposed of (yellow). Both series fall sharply in 2020 (due to thew COVID-19 pandemic), then rise steeply from 2021 onward, reaching roughly 26 million instituted versus 25 million disposed of by 2025. Source: National Judicial Data Grid Attribution: Data For India | CC BY
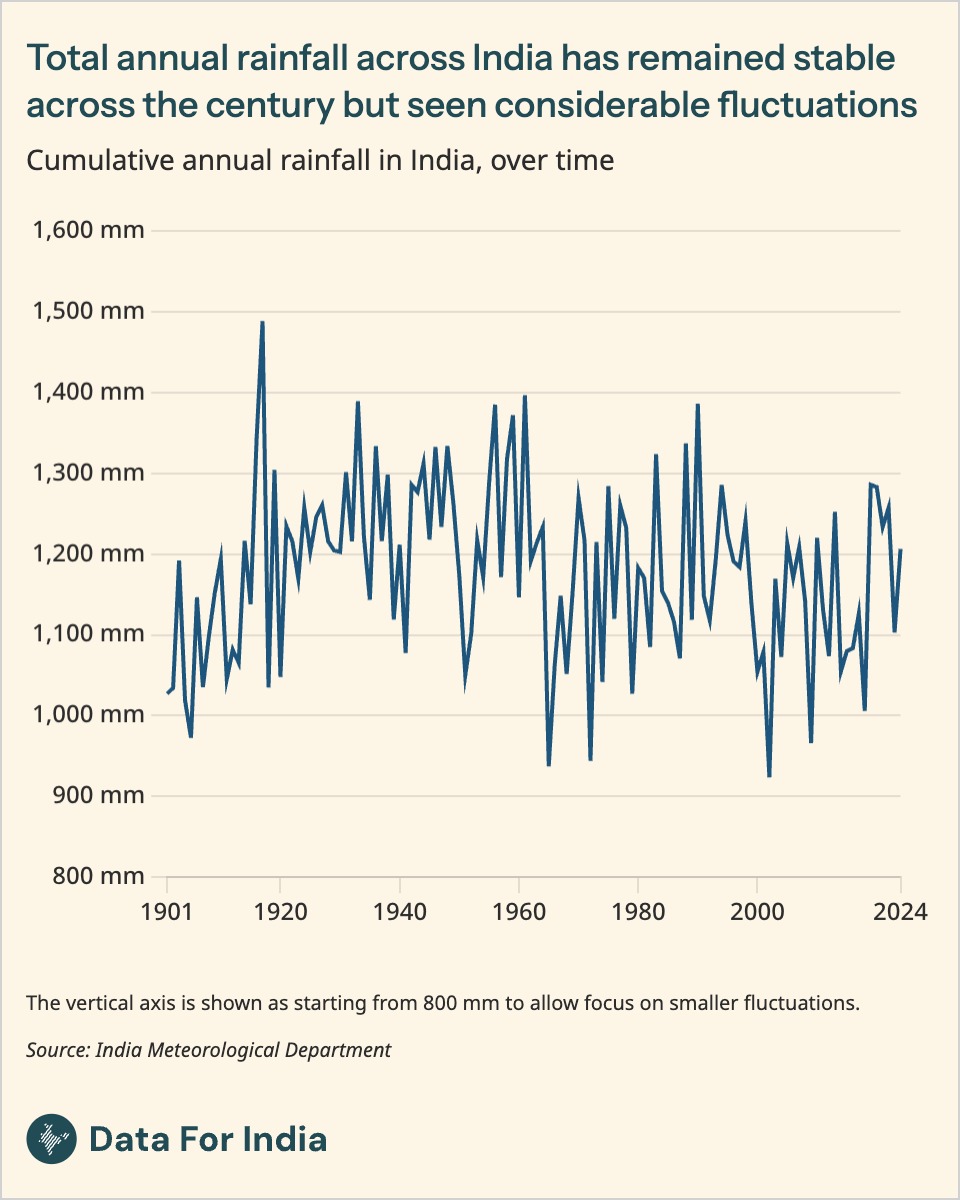
ALT Title: Total annual rainfall across India has remained stable across the century but seen considerable fluctuations Sub-title: Cumulative annual rainfall in India, 1901–2024 Explanation: A line chart shows annual rainfall fluctuating sharply each year but without a clear long‑term rise or fall. Most years sit roughly between 1,000 and 1,300 mm, with occasional extreme wet years approaching ~1,500 mm and dry years dipping to around ~900–1,000 mm, including a notable low in the late 1960s and another around 2000. Source: India Meteorological Department Attribution: Data For India | CC BY
ALT Title: Education levels for women in India are comparable to… Sub-title: Share of education levels attainment by gender, over time Explanation: The share of women who are illiterate falls steadily from a clear majority in 1987 to ~40% by 2020. The shares with primary and secondary education rise over time, especially after the 2000s. Higher education grows from a very small share to around one in ten by 2020. Source: National Sample Survey, National Statistics Office Attribution: Data For India | CC BY

ALT Title: …education levels for men in India a few decades ago Sub-title: Share of education levels attainment by gender, over time Explanation: Men’s illiteracy share declines from ~40% in 1987 to ~20% by 2020. Secondary education expands over time. Higher education grows gradually, reaching the low tens by 2020. Source: National Sample Survey, National Statistics Office Attribution: Data For India | CC BY
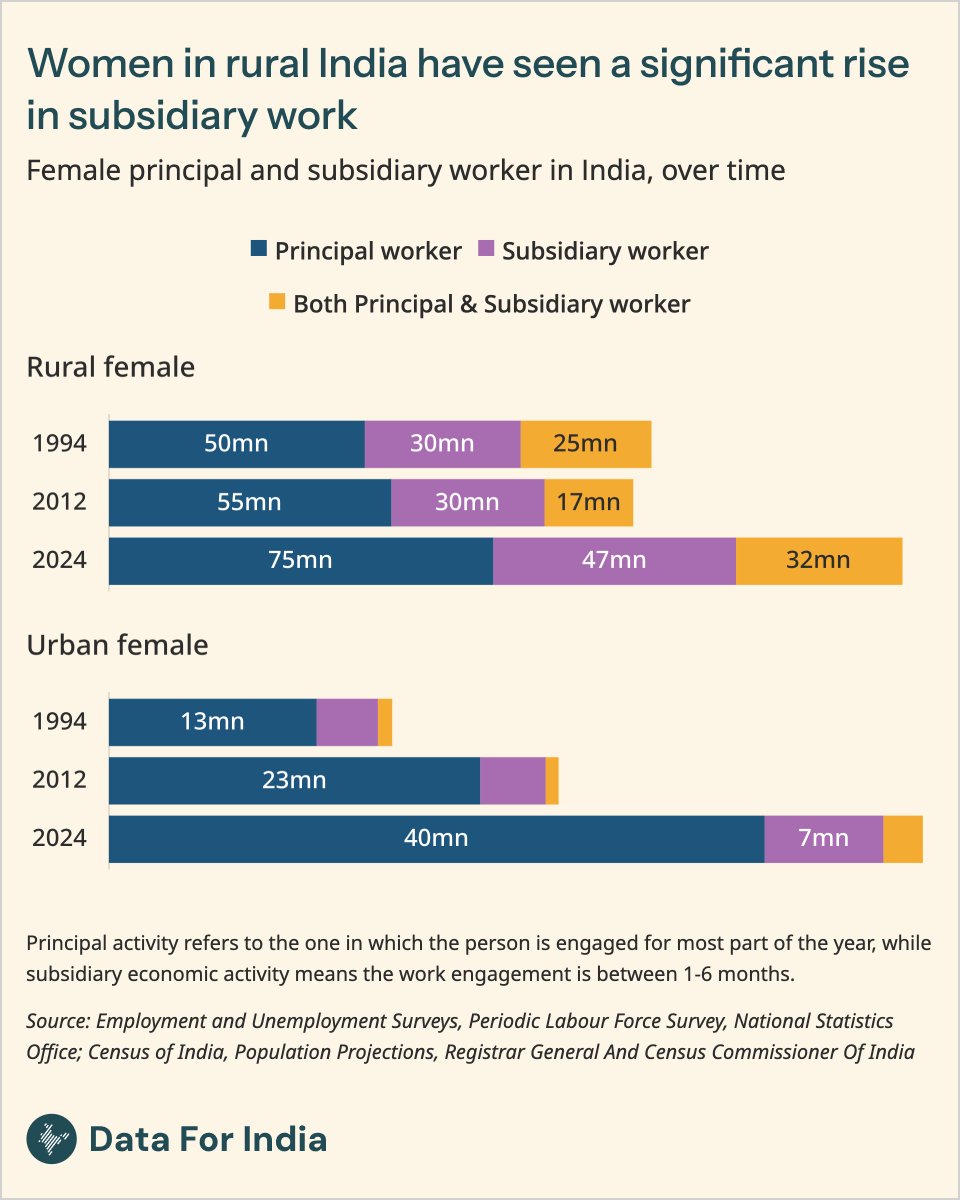
ALT Title: Women in rural India have seen a significant rise in subsidiary work Sub-title: Female principal and subsidiary workers in India, over time Explanation: Stacked bars comparing rural vs urban women workers in 1994, 2012 and 2024, split into principal workers, subsidiary workers, and those who did both. Rural women workers rose from about 105 million (1994) to 154 million (2024), with subsidiary workers increasing from 30 million to 47 million. Urban women workers rose from about 18 million (1994) to 50 million (2024), with most being principal workers and a small subsidiary segment (7 million in 2024). Source: Employment and Unemployment Surveys; Periodic Labour Force Survey (National Statistical Office); Census of India; Population Projections (Registrar General and Census Commissioner of India) Attribution: Data For India | CC BY
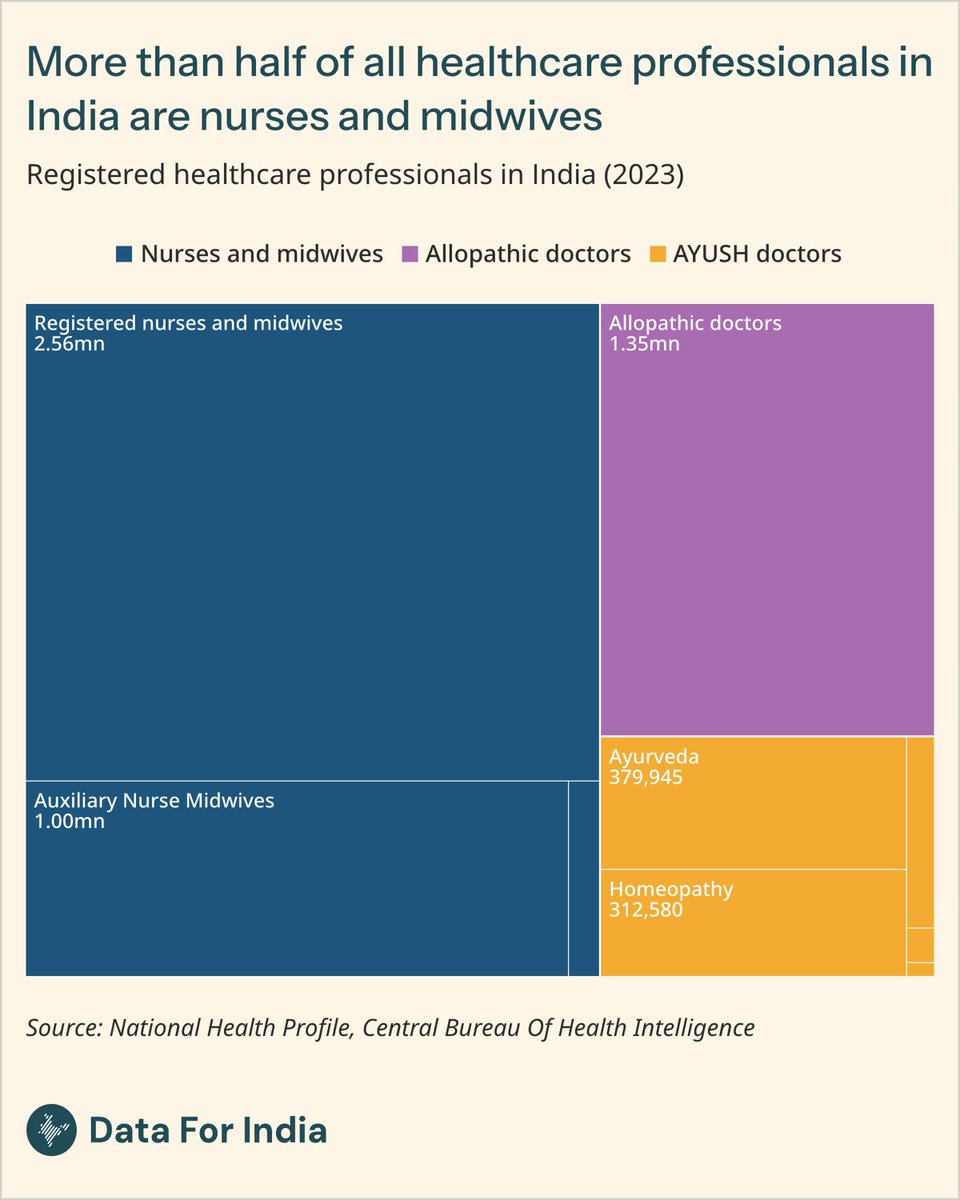
ALT Title: More than half of all healthcare professionals in India are nurses and midwives Sub-title: Registered healthcare professionals in India (2023) Explanation: Treemap showing that nurses and midwives make up more than half of registered healthcare professionals. Largest block is “Registered nurses and midwives” (2.56 million). Another large block is “Auxiliary Nurse Midwives” (1 million). Doctors include “Allopathic doctors” (1.35 million) and smaller AYUSH categories such as “Ayurveda” (379,945) and “Homeopathy” (312,580). Source: National Health Profile; Central Bureau of Health Intelligence Attribution: Data For India | CC BY
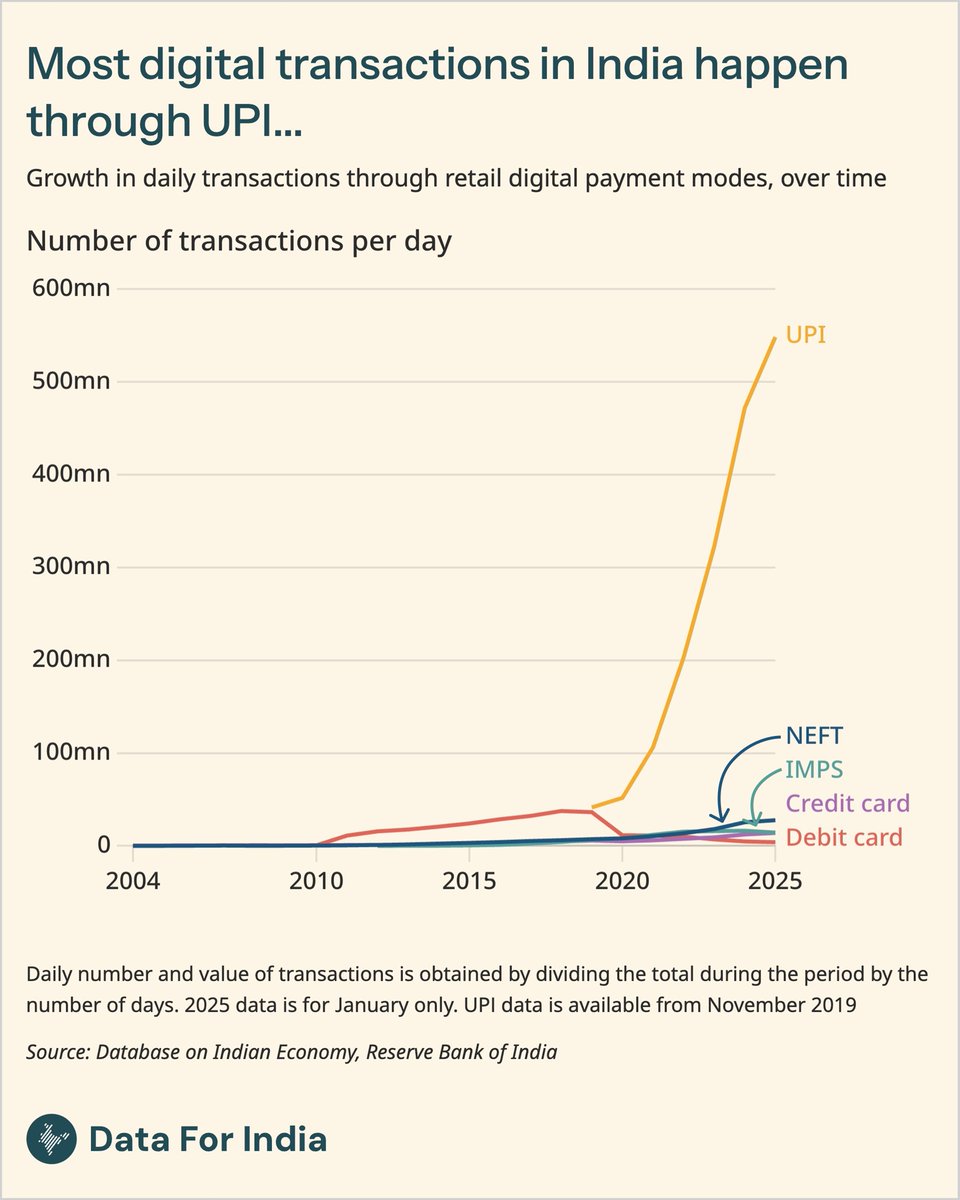
ALT Title: Most digital transactions in India happen through UPI... Sub-title: Growth in daily transactions through retail digital payment modes, over time Explanation: UPI has become India's dominant retail digital payment mode by volume, with daily transactions climbing from around 40 million in 2019 to roughly 550 million in 2025, far outpacing NEFT, IMPS, credit cards, and debit cards, which have stayed comparatively flat. Source: Database on Indian Economy, Reserve Bank of India. Attribution: Data For India | CC BY
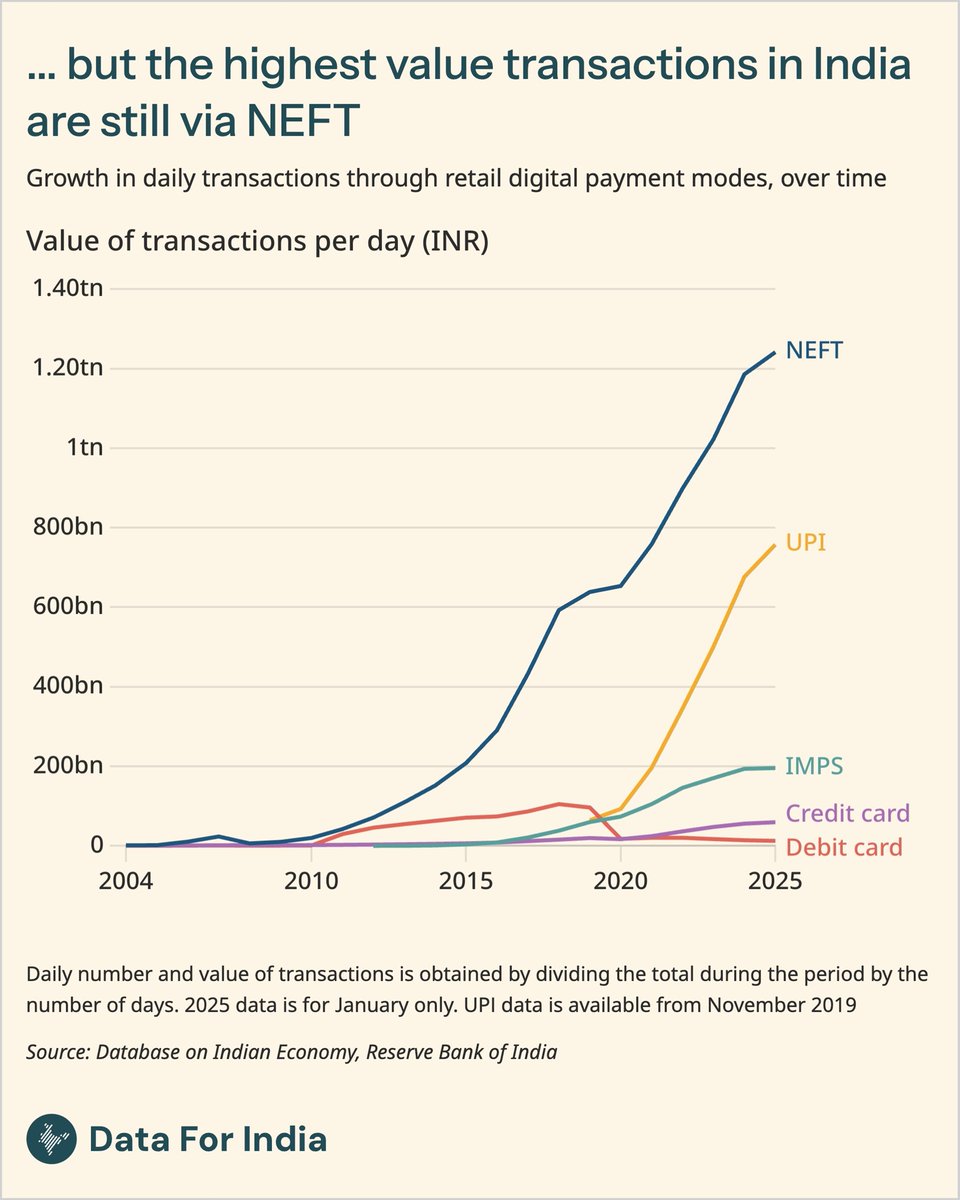
ALT Title: ... but the highest value transactions in India are still via NEFT Sub-title: Growth in daily transactions through retail digital payment modes, over time Explanation: By value, NEFT remains India's largest retail digital payment rail, with average daily transaction value roughly doubling from Rs 600 billion in 2020 to about Rs 1.2 trillion in 2025. UPI is catching up at around Rs 800 billion per day, while IMPS, credit cards, and debit cards trail well behind. Source: Database on Indian Economy, Reserve Bank of India. Attribution: Data For India | CC BY
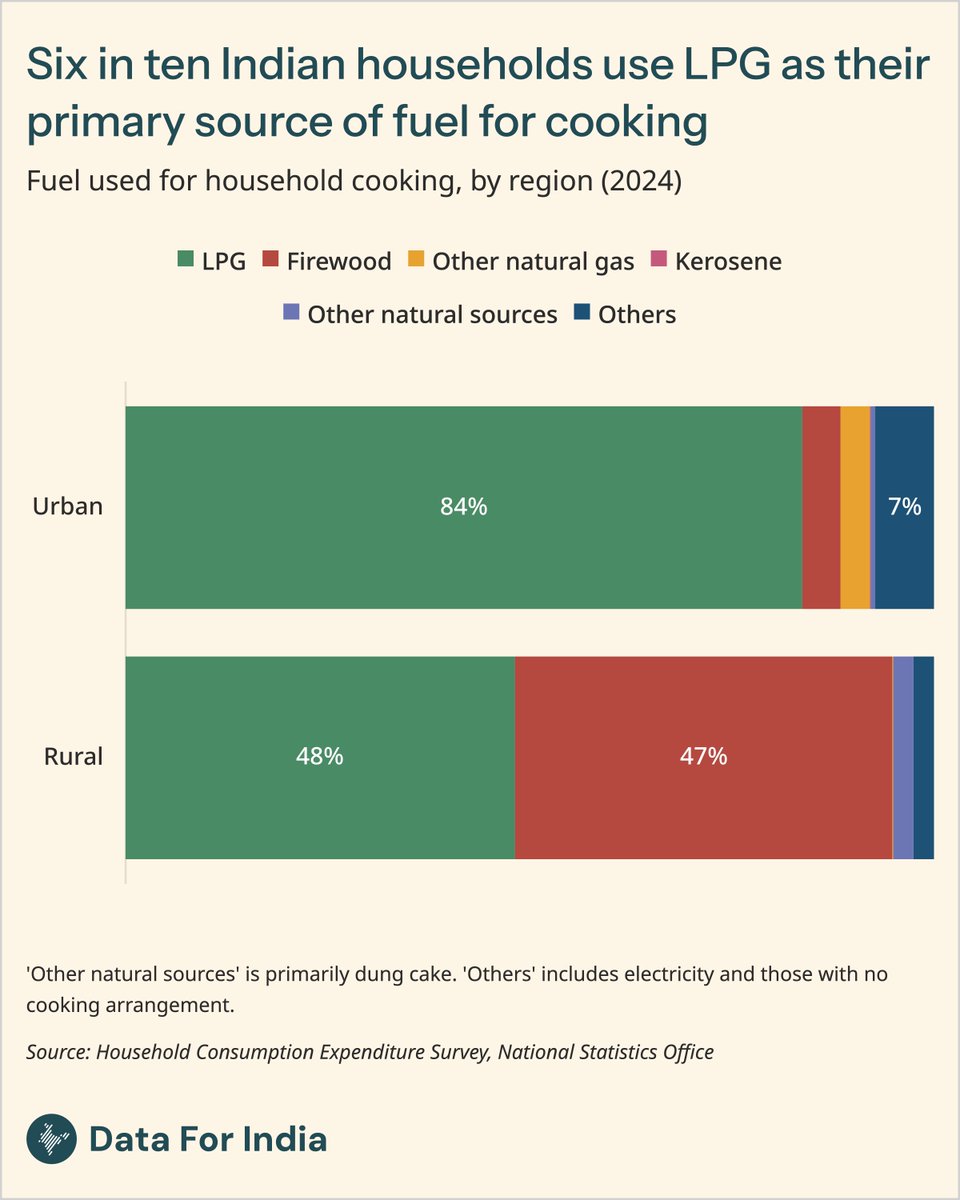
ALT Title: Six in ten Indian households use LPG as their primary source of fuel for cooking Sub-title: Fuel used for household cooking, by region (2024) Explanation: In urban India, 84% of households use LPG for cooking. In rural India, LPG use (48%) is nearly matched by firewood (47%), with a small share relying on other natural sources such as dung cake. Source: Household Consumption Expenditure Survey, National Statistics Office Attribution: Data For India | CC BY
ALT Title: Children in the poorest households are more likely to be stunted across both urban and rural India. Sub-title: Prevalence of stunting among children across wealth groups (2021). Explanation: In both urban and rural India, stunting falls steadily as household wealth rises. Children in the poorest urban households are stunted at 40%, nearly twice the rate of those in the richest urban households at 21%. Rural rates are higher across every wealth group, ranging from 47% in the poorest households to 25% in the richest. Source: National Family Health Survey 5 (2019-21), IIPS. Attribution: Data For India | CC BY
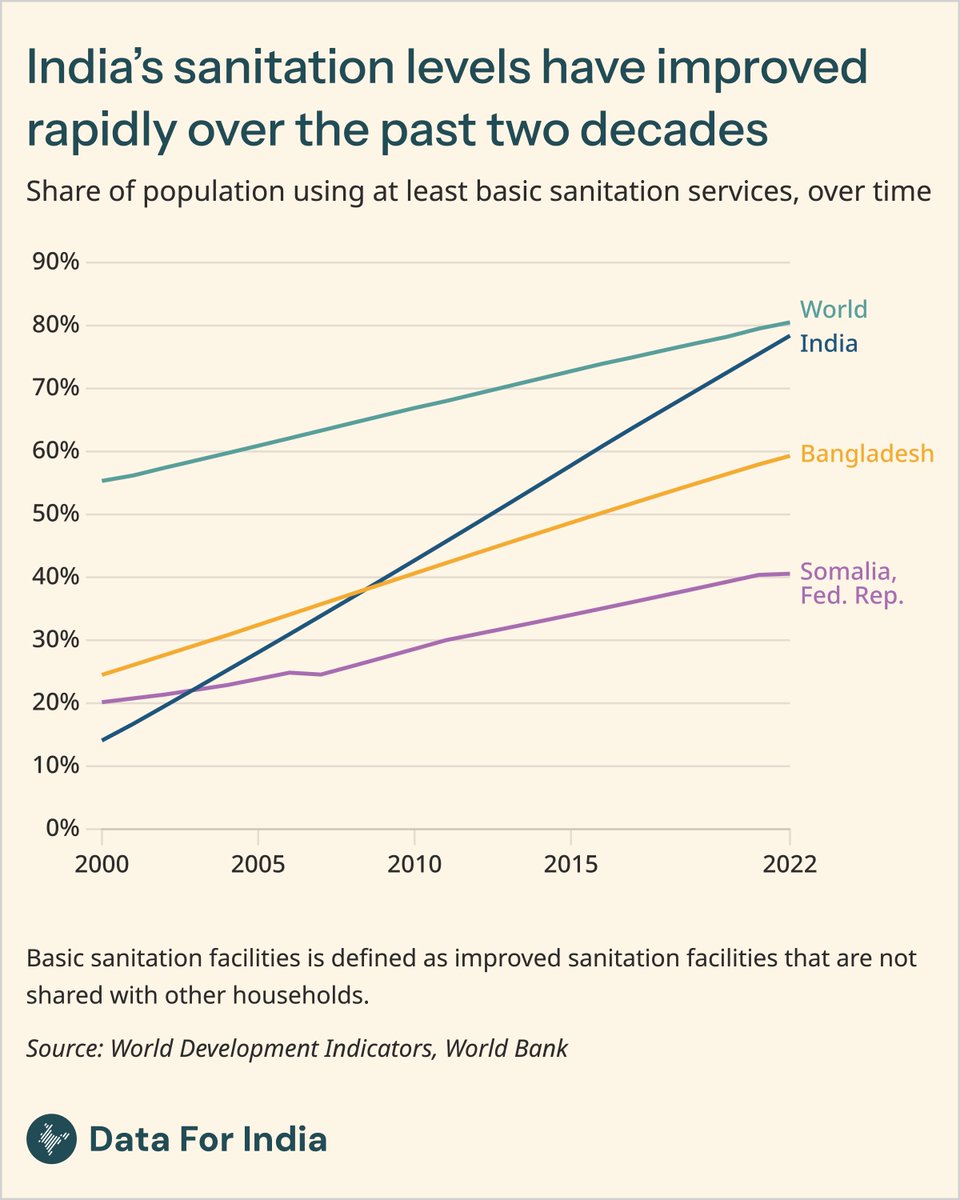
ALT Title: India’s sanitation levels have improved rapidly over the past two decades Sub-title: Share of population using at least basic sanitation services, over time Explanation: In 2000, just over 10% of Indians had access to basic sanitation — lower than Somalia. By 2022, that share had climbed to nearly 80%, overtaking Bangladesh and closing in on the world average. Source: World Development Indicators, World Bank Attribution: Data For India | CC BY
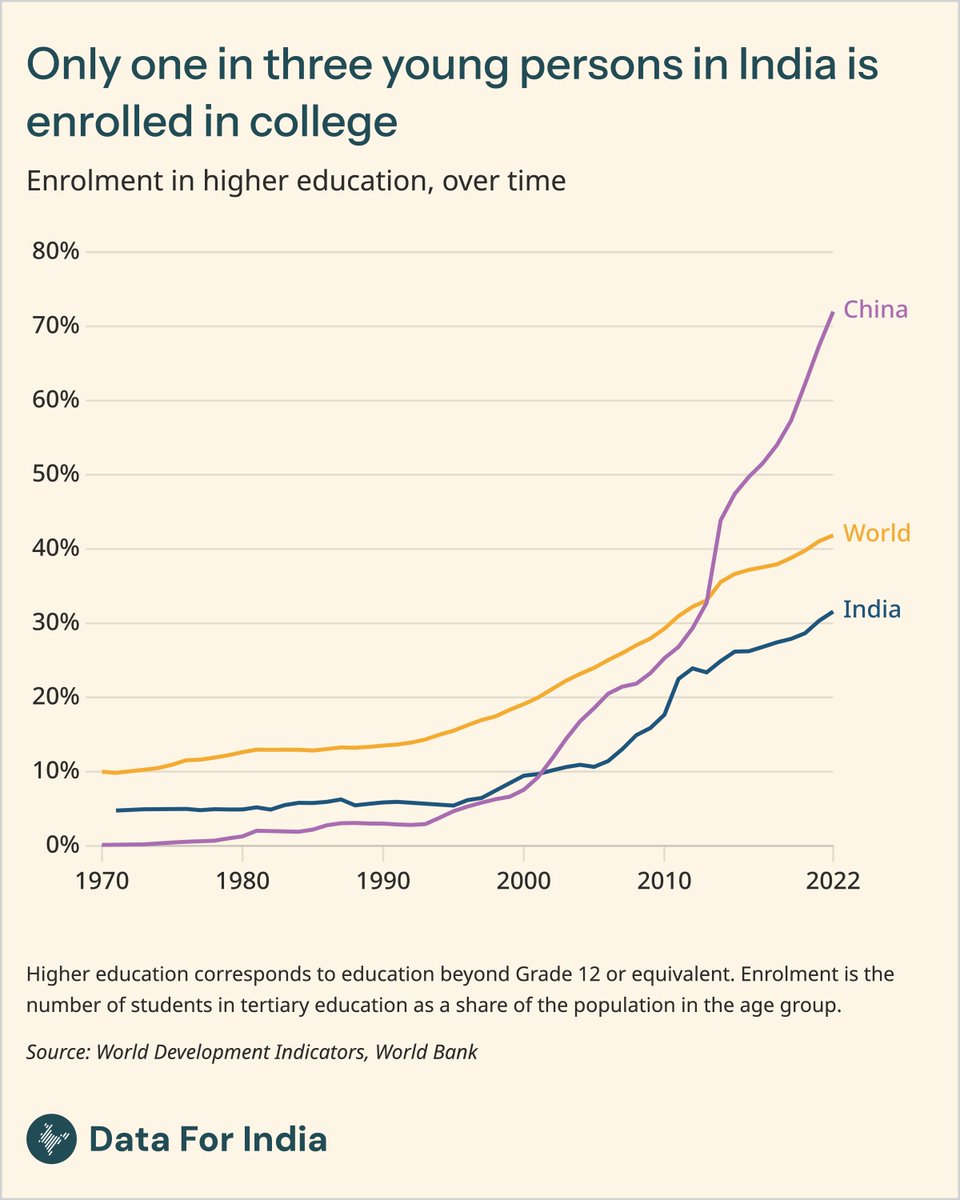
ALT Title: Only one in three young persons in India is enrolled in college Sub-title: Enrolment in higher education, over time Explanation: At 32%, higher education enrolment in India trails the world average (around 42%) and is less than half of China's (over 70%). In the early 1990s, India and China had comparable enrolment rates; China has since pulled far ahead. Source: World Development Indicators, World Bank Attribution: Data For India | CC BY
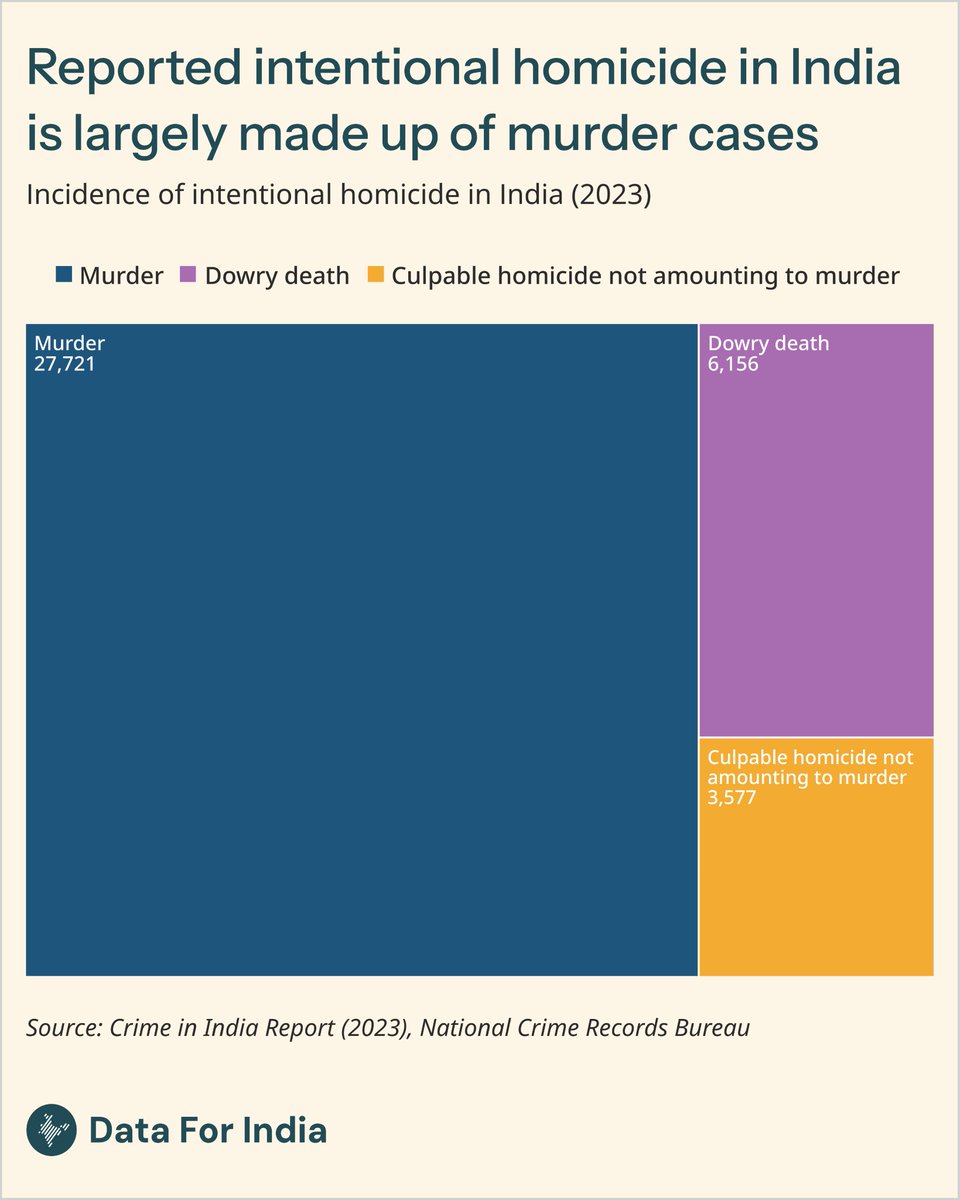
ALT Title: Reported intentional homicide in India is largely made up of murder cases Sub-title: Incidence of intentional homicide in India (2023) Explanation: Treemap showing the composition of reported intentional homicides in India in 2023. Murder accounts for the vast majority (27,721 cases), followed by dowry deaths (6,156) and culpable homicide not amounting to murder (3,577). Source: Crime in India Report (2023), National Crime Records Bureau Attribution: Data For India | CC BY
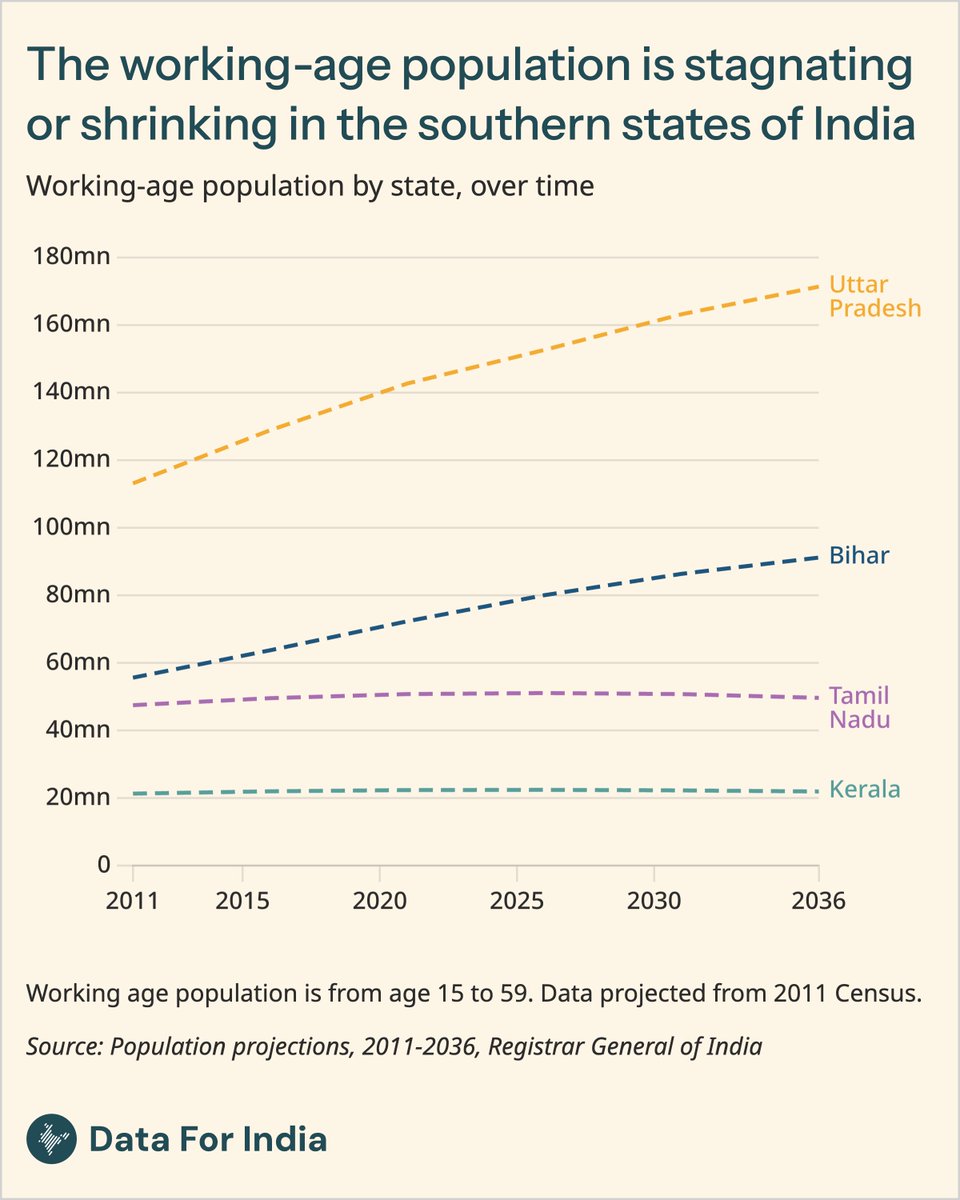
ALT Title: Working-age population is stagnating or shrinking in southern Indian states Sub-title: Projections (2011–2036) show Uttar Pradesh and Bihar growing, while Tamil Nadu and Kerala flatten Explanation: The chart tracks the working-age population (ages 15–59) from 2011 to 2036. Uttar Pradesh rises steadily (roughly ~110 million to ~170 million) and Bihar also increases (about ~55 million to ~90 million). In contrast, Tamil Nadu stays almost flat around ~50 million and Kerala remains nearly flat around ~20 million, indicating stagnation in the southern states compared with continued growth in the north. Source: Population projections, 2011–2036, Registrar General of India (projected from 2011 Census) Attribution: Data For India | CC BY