
News and updates for DataGraph, a powerful graphing and analysis application for Mac OS X.
Joined June 2012
- Tweets 250
- Following 49
- Followers 422
- Likes 99
111 Photos and videos


2 Nov 2024
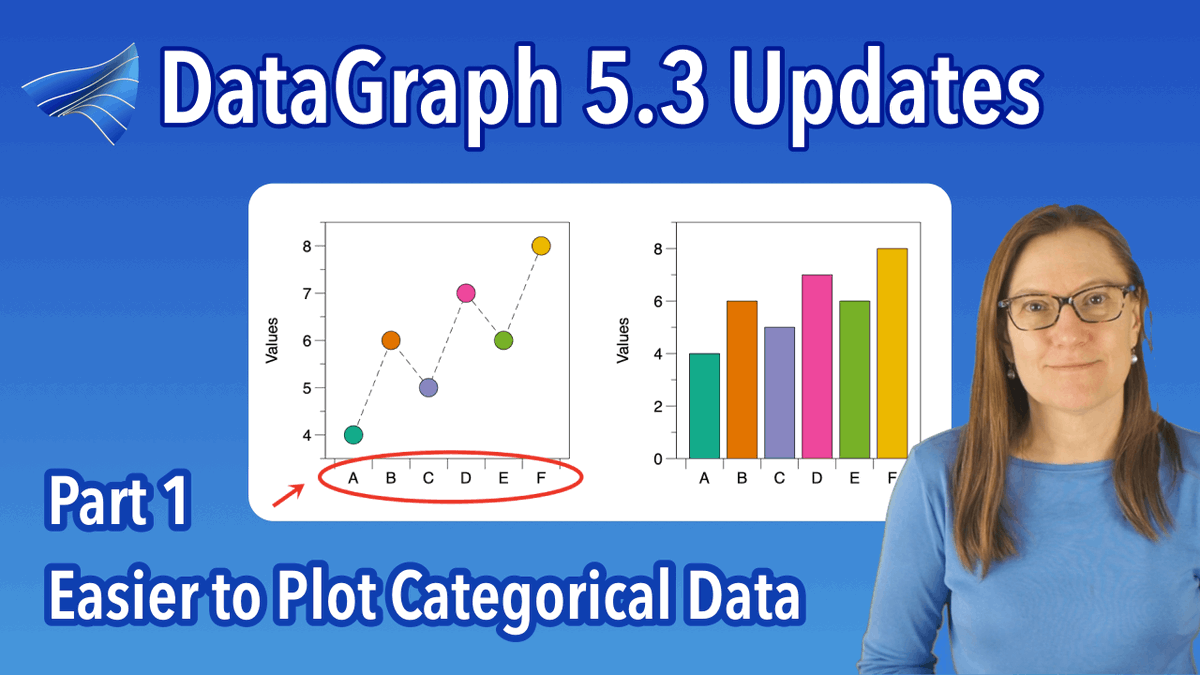
🍂 Don’t miss our fall webinar series on Datagraph! The first 5 are now on YouTube! Check them out and level up your data skills! 📺 #skills #Datagraph #Webinars #dataviz
youtube.com/playlist?list=PL… via @YouTube
2
225
17 May 2024
Premiering soon! 11AM ET - #Color ramps in DataGraph! Learn what's wrong with the rainbow, new color ramp options, and how to create custom color ramps.
#datascience #data @YouTube
youtu.be/P0mUWYPzGa8?si=OaBa…
2
273
5 Apr 2024
1
6
269
1 Mar 2024
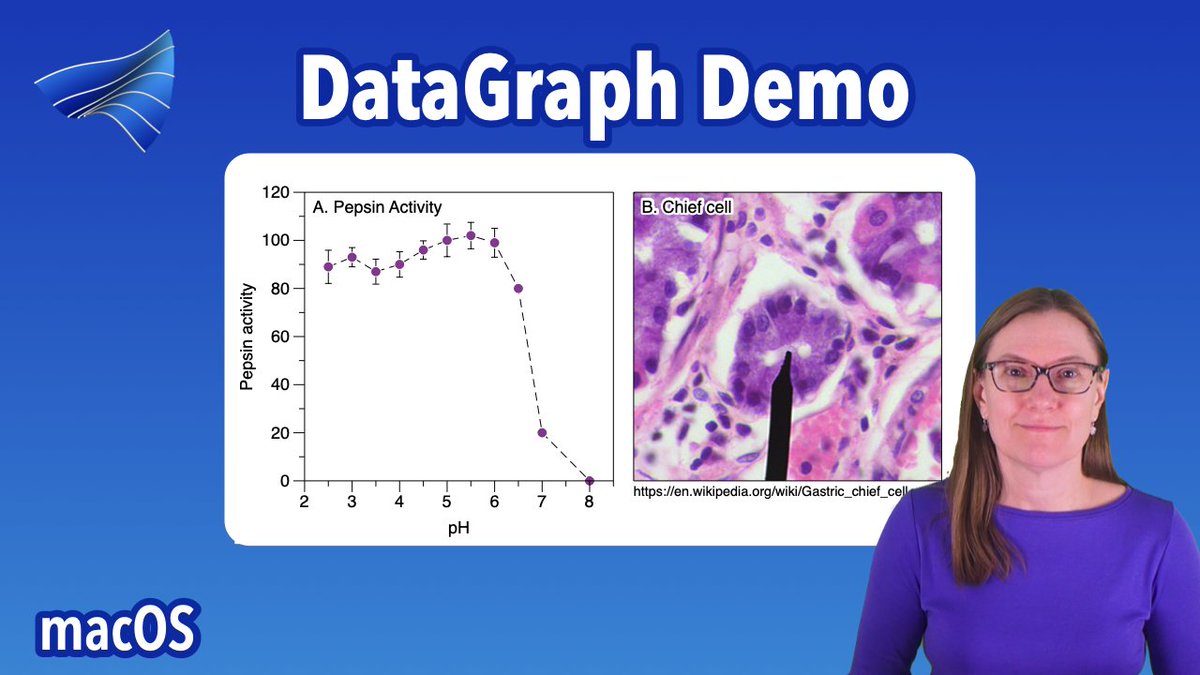
Check out our latest DataGraphDemo! #data #DataScience #graphing #purple
youtu.be/4CGa3lMrZYM?si=VXxr…
1
1
236
15 Dec 2023
TODAY! Premiers 11:00AM ET (NYC) youtu.be/ylvElHeqb9k
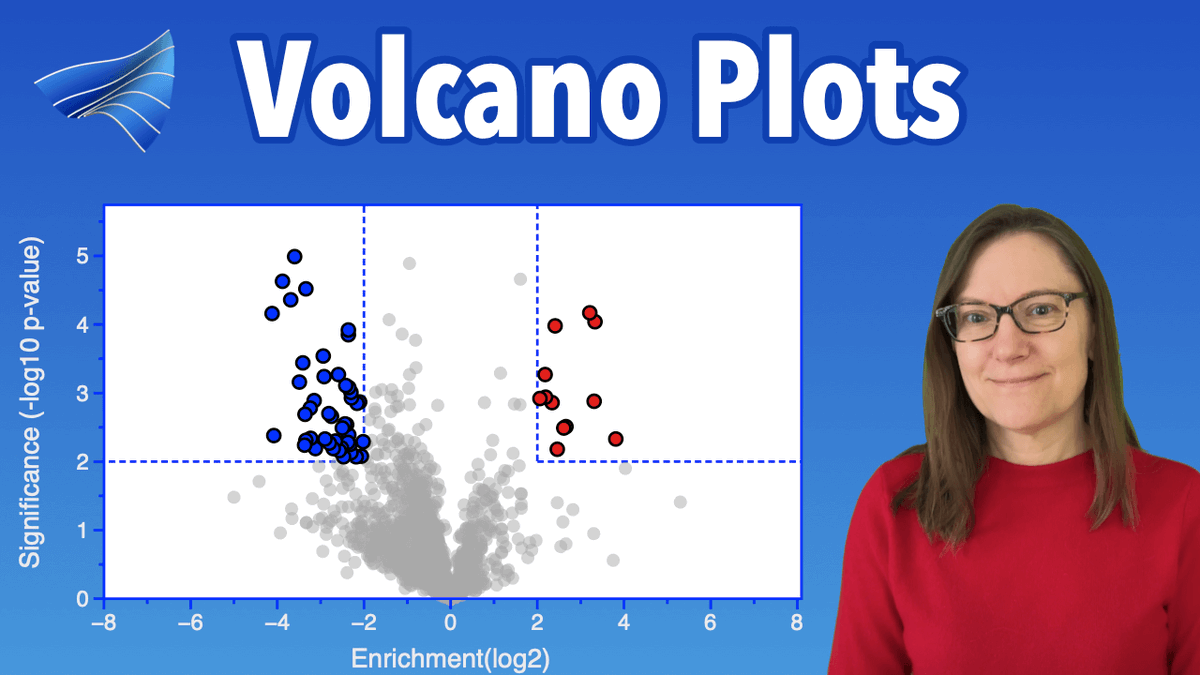
Volcano Plots - Part 2 - Learn to explore and rank your data! #data #graphing #macOS #bioinformatics #DataScience
4
179
8 Dec 2023
DEMO TODAY! Premiers 11:00AM ET (NYC) youtu.be/KROyqLuTlGM
Learn how to link to online data, create scatter plots, mask data with regions, and more, from our new demo on Volcano Plots in DataGraph. #data #graphing #macOS #bioinformatics #DataScience
3
180
16 Nov 2023
Another new Demo! This is the last video in our series, "What's new in DataGraph 5.2". 📊📈 youtu.be/Wv3MYRa9eK4
#data #graphing #macOS
3
168
10 Nov 2023
LIVE in ONE HOUR! DataGraph 5.2 – Finding Outliers youtu.be/lDE3YgptTuo?si=9fbI… via @YouTube #data #statistics
1
2
171
1 Nov 2023
Just out - New DataGraph Demo – Improved File Linking in DG5.2! youtu.be/M-YmGB-YnRU?si=PBzj… via @YouTube #data #graphing #macOS
3
159
17 Oct 2023
MORE New Stuff from DataGraph 5.2 - Updated Region Command youtu.be/bBB8vl2JwpY?si=LIUP… via @YouTube
1
139
5 Oct 2023
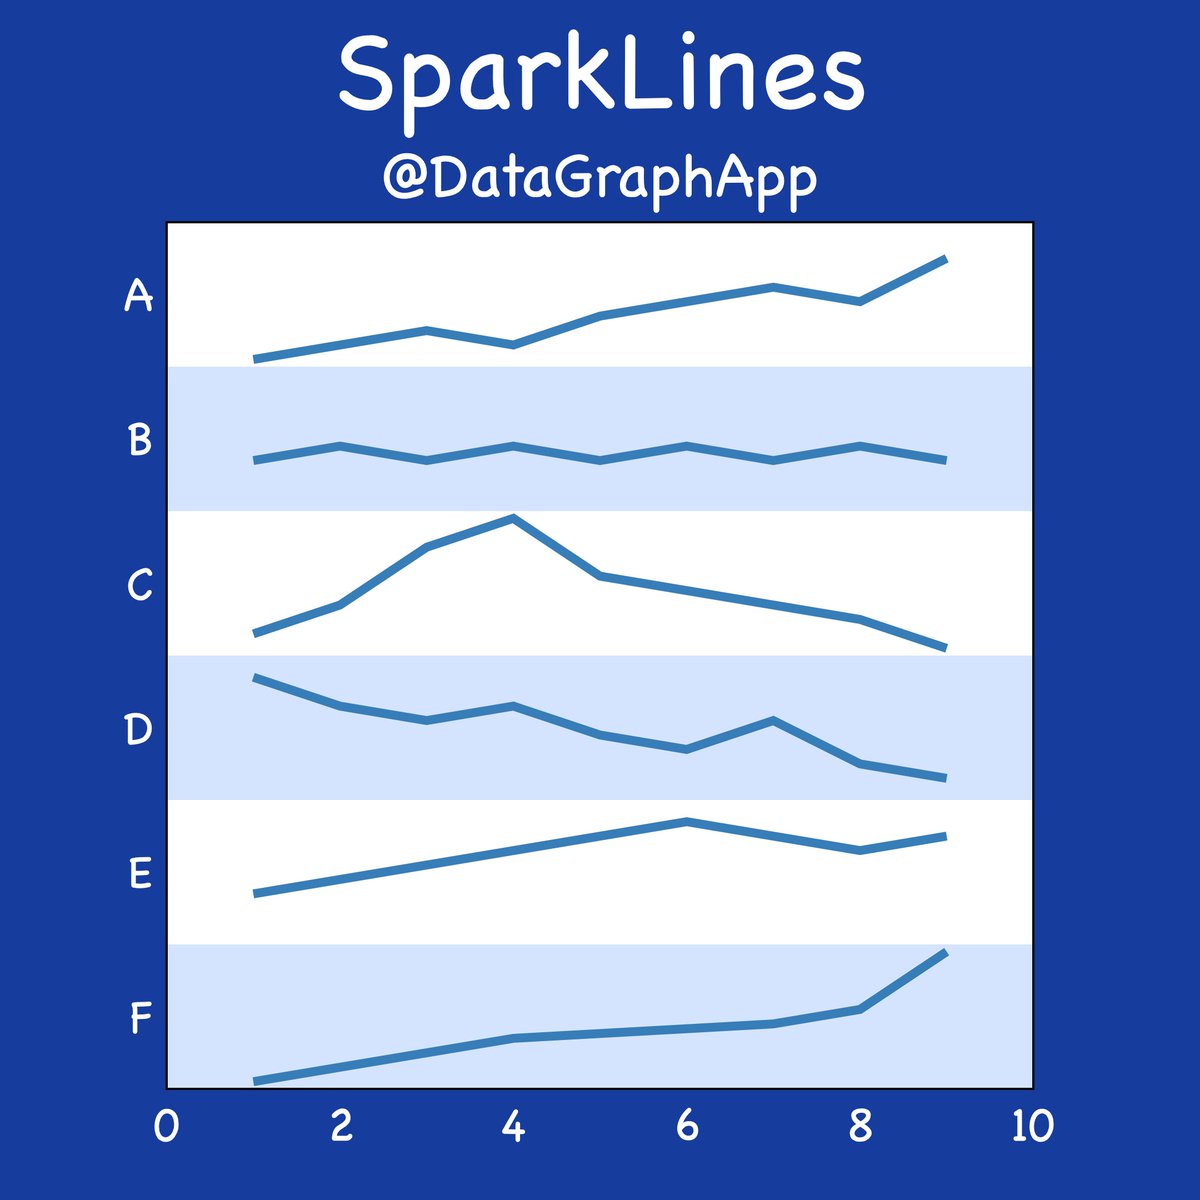
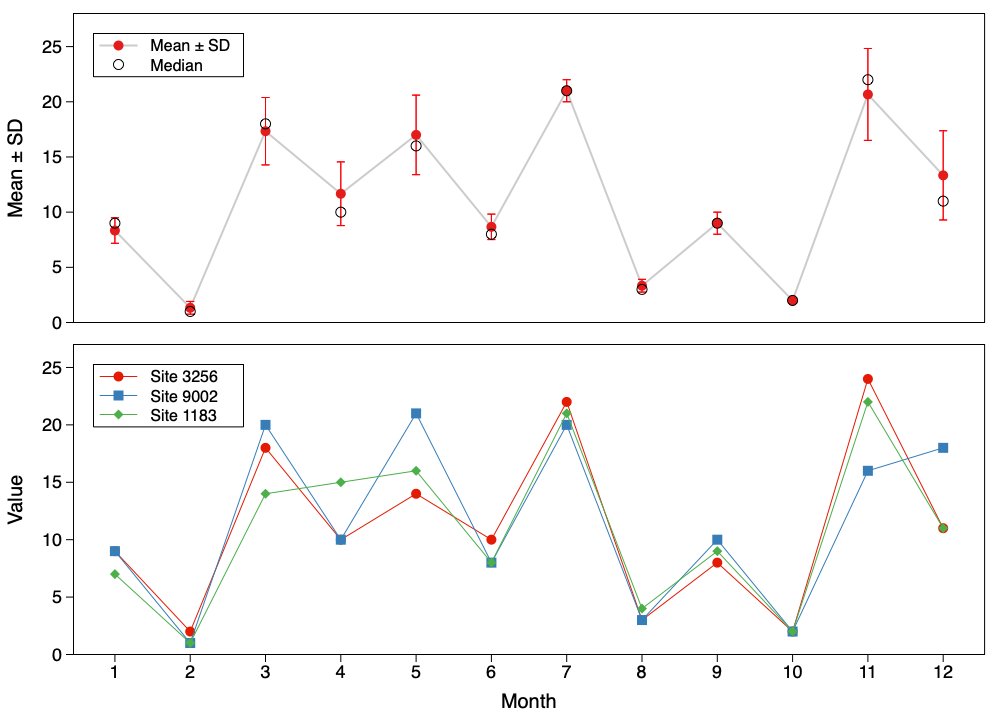
An example of Sparklines! Illustrates the relative trends between multiple categories. #Graphtober #data #datascience #dataviz #datavisualization #graphic
5
234
3 Oct 2023
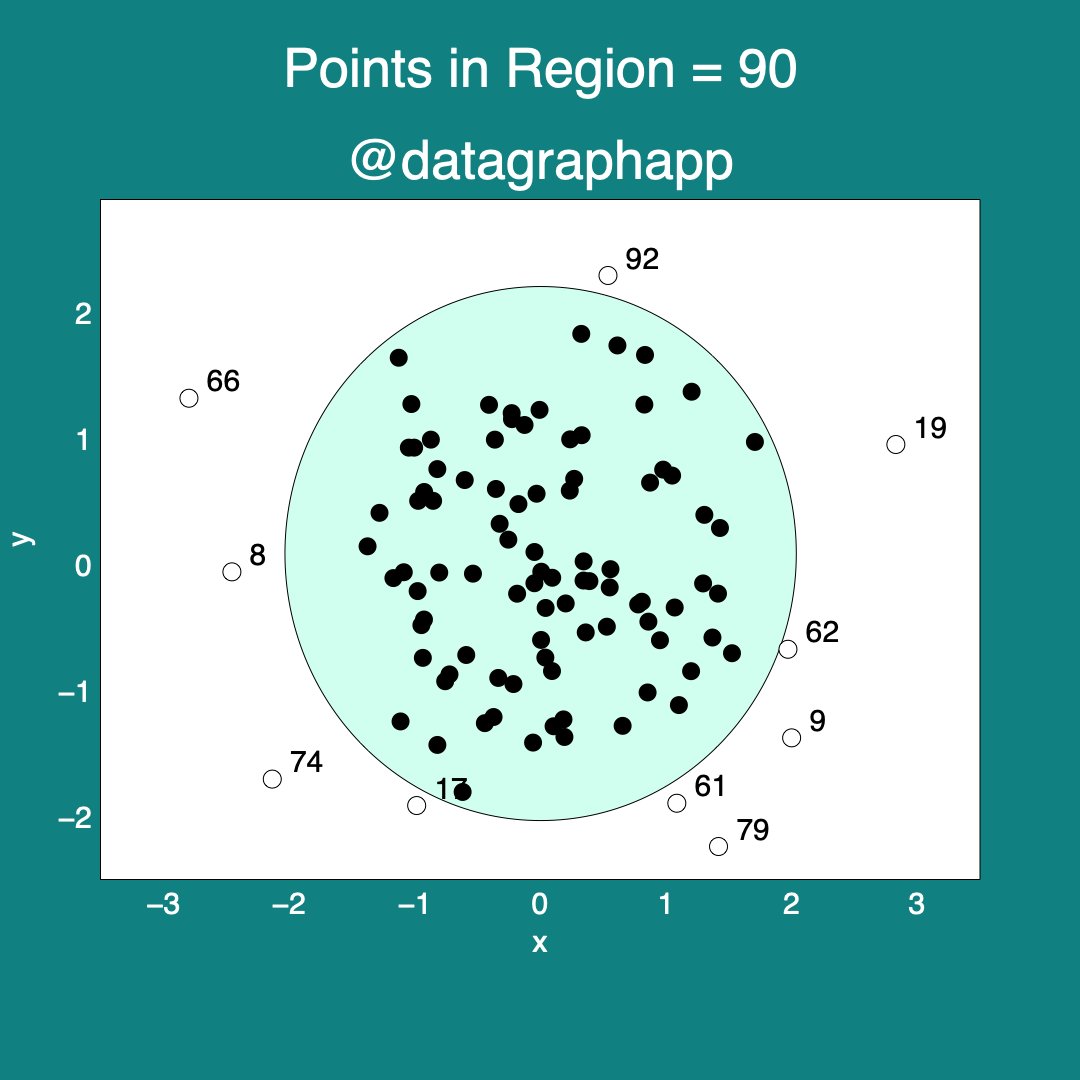
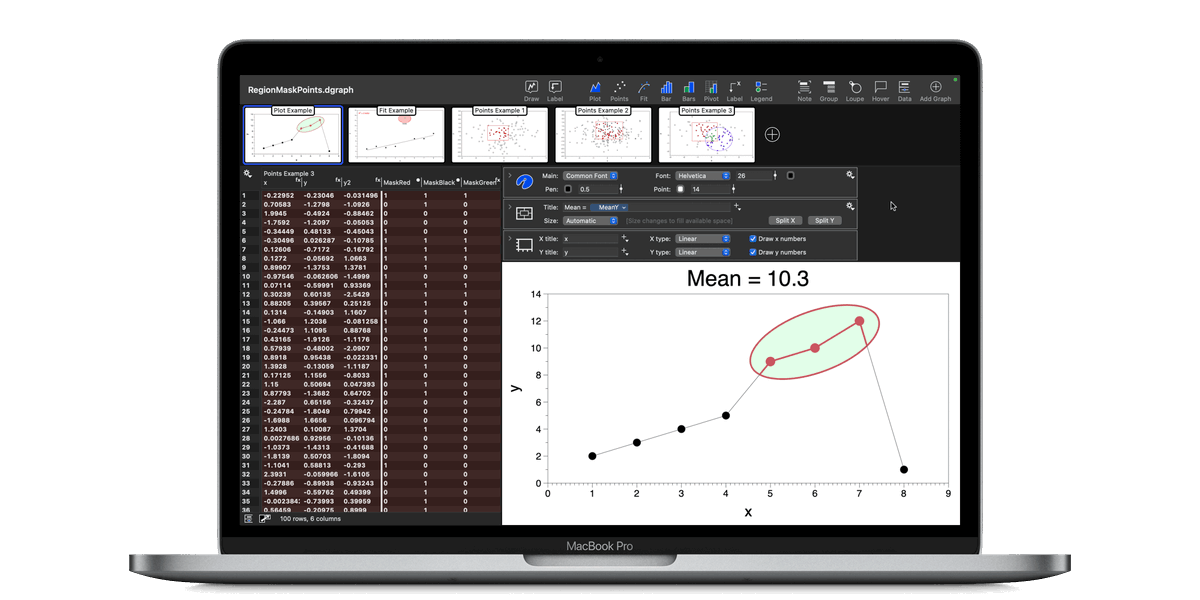
Try the updated Region command in DG5.2 – Interactively count points in a region.
community.visualdatatools.co…
#shapes #data #dataviz #DataScience
1
165
2 Oct 2023
LINE PLOTS – Three ways to connect: Straight, Smooth, or Steps. DataGraph for #MacOS. #graphtober #dataviz #datavisualization
4
232
1 Oct 2023
Happy #Graphtober!!! DataGraph Version 5.2 is out!
community.visualdatatools.co…
#ilovedata #data #dataviz #datascience
1
3
344
20 Sep 2023
Learn how to show an interval for a distribution youtu.be/ApHorOParjY?si=ICln… via @YouTube #DataAnalytics #DataScience
1
1
301
28 Jun 2023
Learn how to create custom graphs effortlessly with DataGraph 5.1! Our latest video guide is packed with useful tips and tricks. Check it out on our YouTube channel now! #DataGraph #CustomGraphs #ScientificCommunity
youtu.be/a9wyabbsBYM
4
1,606