
.NET performance profiler from @JetBrains. Find performance bottlenecks and optimize your .NET apps. Integrates with @JetBrainsRider and @ReSharper.
Joined March 2009
- Tweets 487
- Following 13
- Followers 5,161
- Likes 153
66 Photos and videos


Pinned Tweet

Mar 30
🆕 The latest @resharper 2026.1 and @jetbrains .NET Tools release is here!
Download dotTrace 2026.1 from our website: jetbrains.com/profiler/downl…
10
499
11 Nov 2025
The 2025.3 release for @jetbrains .NET Tools has just landed! ✨
Download the latest version of dotTrace here: jetbrains.com/profiler/downl…
#dotnet #dotnet10 #vs2026 #visualstudio2026
1
3
180
JetBrains dotTrace retweeted

19 Jun 2025
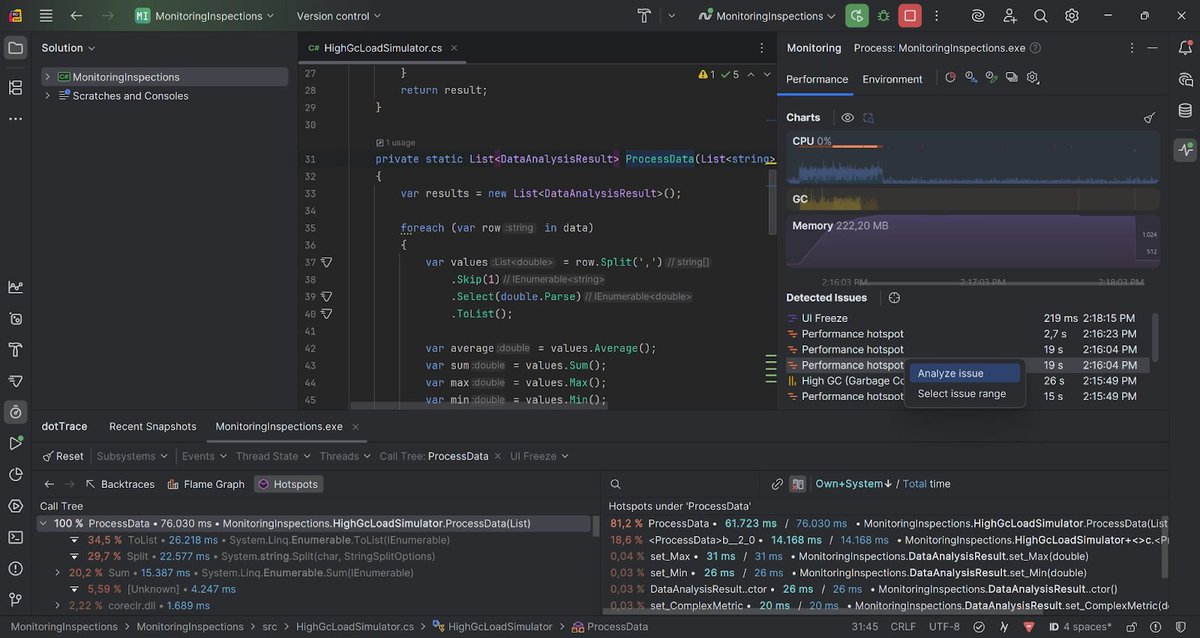
🆕 in @JetBrainsRider: The reimagined Monitoring tool automatically detects performance hotspots, UI freezes & GC spikes while your app runs 🔥.
Click any issue to reveal the root cause right there in the bundled @dotTrace profiler without having to stop your application for an investigation!
Available for FREE in EAP builds 👉 jetbrains.com/rider/nextvers…
#dotnet
5
15
128
7,103
29 Apr 2025
⚡The first bug-fix update for the latest release contains an important fix for dotTrace. Be sure to update for a better profiling experience.
29 Apr 2025

The ReSharper 2025.1.1 bug-fix update just went live!
You can download the latest build here. 👉 jetbrains.com/resharper/down…
2
243
16 Apr 2025
dotTrace 2025.1 is out!
This update introduces tabbed snapshot analysis. You can now open the same performance snapshot in multiple tabs, each with its own set of applied filters.
More about the latest dotTrace updates here: jetbrains.com/profiler/whats…
#dotnet #performanceprofiling
1
3
585
JetBrains dotTrace retweeted

28 Feb 2025
ReSharper 2025.1 EAP 6 is now available!🔥
It comes with:
🔹Push-to-Hint improvements
🔹String interpolation support in @dotpeek
🔹Improved snapshot management in @dottrace
🔹Unified snapshots and workspace history in @dotMemory and #dotTrace
Download 👉jetbrains.com/resharper/next…

4
4
978
JetBrains dotTrace retweeted
5 Dec 2024
🎄 December is the perfect time to hit rewind and dive into the talks from .NET Days Online 2024! 🚀
▶️▶️▶️ jb.gg/24dotnetdays
Our Developer Advocates poured their ❤️❤️❤️ into curating this event, spotlighting diverse topics, speakers, and tools that make the #dotnet ecosystem so vibrant and inspiring. 🌟
#csharp #dotnetaspire #fsharp #blazor #ReSharper #htmx #testing #aspnetmvc #aspnetcore #JBDotNetDays

2
11
11
2,474
13 Nov 2024
dotTrace 2024.3 has landed!
🔄 Undo/Redo actions for better profiling navigation
📜 Filter history support to streamline session analysis
Get all the details: jetbrains.com/profiler/whats…
#dotnet #performanceprofiling
1
1
481
15 Aug 2024
dotTrace 2024.2 is out with:
🥳 Improved performance and faster processing of Timeline snapshots.
🔥 A new rendering engine in dotTrace Viewer on all platforms.
👉 An Options window added to the standalone version for macOS and Linux
More details: jb.gg/dt-2024-2 #dotnet
1
3
536
JetBrains dotTrace retweeted
23 Jul 2024
ReSharper turns 20! Can you imagine that? 🥳
Join us in reflecting on how @ReSharper has transformed the #dotnet community over the years, and revisit some good old memes and stories about ReSharper IDE: jb.gg/resharper-20
What’s your ReSharper story? #20YearsOfReSharper
6
30
53
12,089
JetBrains dotTrace retweeted
24 Jun 2024
How will the introduction of C# DevKit for #VSCode influence the usage of @VisualStudio and @JetBrains IDEs? Will .NET #aspire see wide adoption among #dotnet developers? Let’s find out! Our annual State of Developer Ecosystem survey is open now, and you can win cool prizes for taking part: surveys.jetbrains.com/s3/tin…
#dotnet #DevEcosystem

7
24
6,106
JetBrains dotTrace retweeted

14 May 2024
JetBrains will be at Microsoft Build in Seattle, WA, USA, on May 21–23. We’d love to catch up and show you a live demo in the Expert Meet-up area. Be sure to stop by!
build.microsoft.com/en-US/pa…
#MicrosoftBuild #dotnet

11
38
10,421
9 Apr 2024
dotTrace 2024.1 is here!
💪 Support for desktop #MAUI apps
💻 Improved support for macOS
🎮 Profiling presets for specific apps, such as @Unitygames and @UnrealEngine games
Learn more:
jetbrains.com/profiler/whats… #dotnet #gamedev
1
10
719
7 Dec 2023
dotTrace 2023.3 is here!
⚙️ Improved configuration of the Timeline profiling mode
👁️ Profiling data is now available in the Source view
🔥 The Flame graph view is now available on Linux and macOS
Learn more: jb.gg/dottrace-2023-3
3
9
349
JetBrains dotTrace retweeted
1 Dec 2023
Our online #JetBrainsAI launch event is coming up!
📅 Mark your calendars: December 6, 5:00 pm (CET) | 8:00 am (PST)
Set a reminder 👉 jb.gg/aihere

4
79
270
100,268
JetBrains dotTrace retweeted
30 Nov 2023
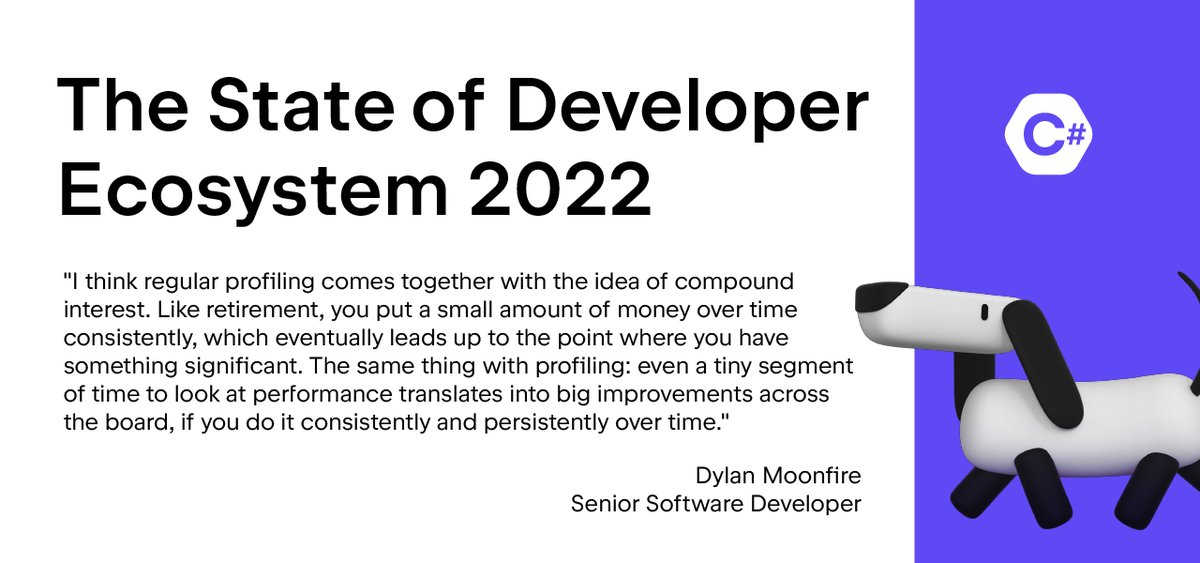
The Developer Ecosystem is up, and we looked at #dotnet and #csharp results in more detail!
🤔 Is #Blazor on the rise?
😲 Is macOS taking over Windows?
✅ Are we all writing enough tests?
These questions (and more) are covered on our blog 👉
jb.gg/bbmus7
1
7
6
1,736
JetBrains dotTrace retweeted
2 Oct 2023
Watch the recordings from JetBrains .NET Day Online ’23!
👉 jb.gg/9pwtyr
What was your favorite session? Let us know! #JBDotNetDays #dotnet #csharp #fsharp #blazor
13
22
17,215
JetBrains dotTrace retweeted
17 Aug 2023
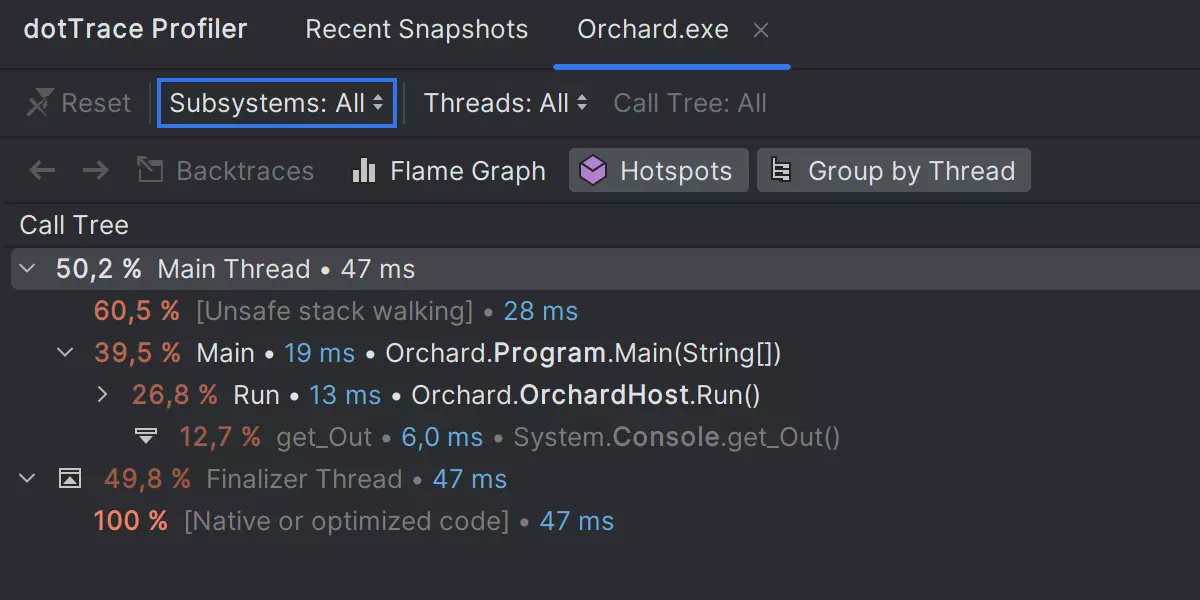
When you run performance profiling with @dotTrace in Rider 2023.2, the Call Tree view now lets you group call stacks by individual threads, allowing deeper insight into thread-specific performance issues.
Learn more: jetbrains.com/rider/whatsnew… #dotnet
5
18
3,214
14 Aug 2023
Want everyone to know how much you appreciate .NET and dotTrace? Check out the recently opened JetBrains Merchandise Store for dotTrace stickers, pins, and other .NET swag for you and your team: jb.gg/dottrace-gear
#JetBrainsGear #dotnet
1
403
2 Aug 2023
dotTrace 2023.2 is here!
🔥 Grouping by threads for sampling, tracing, and line-by-line snapshots
🔥 Source View tool window on Linux and macOS
Learn more: jetbrains.com/profiler/whats… #dotnet
10
795