Small account degenerate. Wins, brutal losses, meltdowns, and occasional miracles. Not financial advice, just gambling with rent money. Oh, a pilot, too!
- Tweets 1,322
- Following 584
- Followers 582
- Likes 586


ALT $ETH daily with 5 & 13 EMAs, 20/50/100/200d SMAs, technicals - MACD, AO, RSI, Stochastics, & multiple Fibonacci retracement levels and extensions. The yellow shaded zone should act as both downside targets and major support.
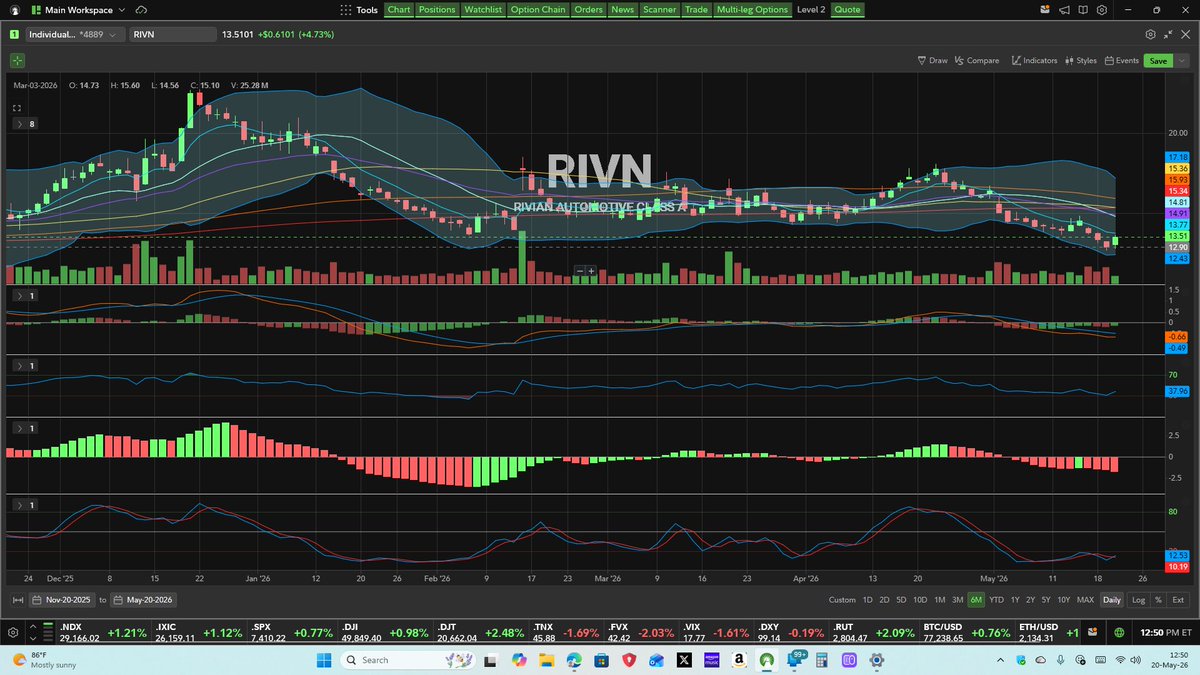
ALT $QQQ 6-month daily with MAs & technicals - MACD, RSI, AO, stochastics
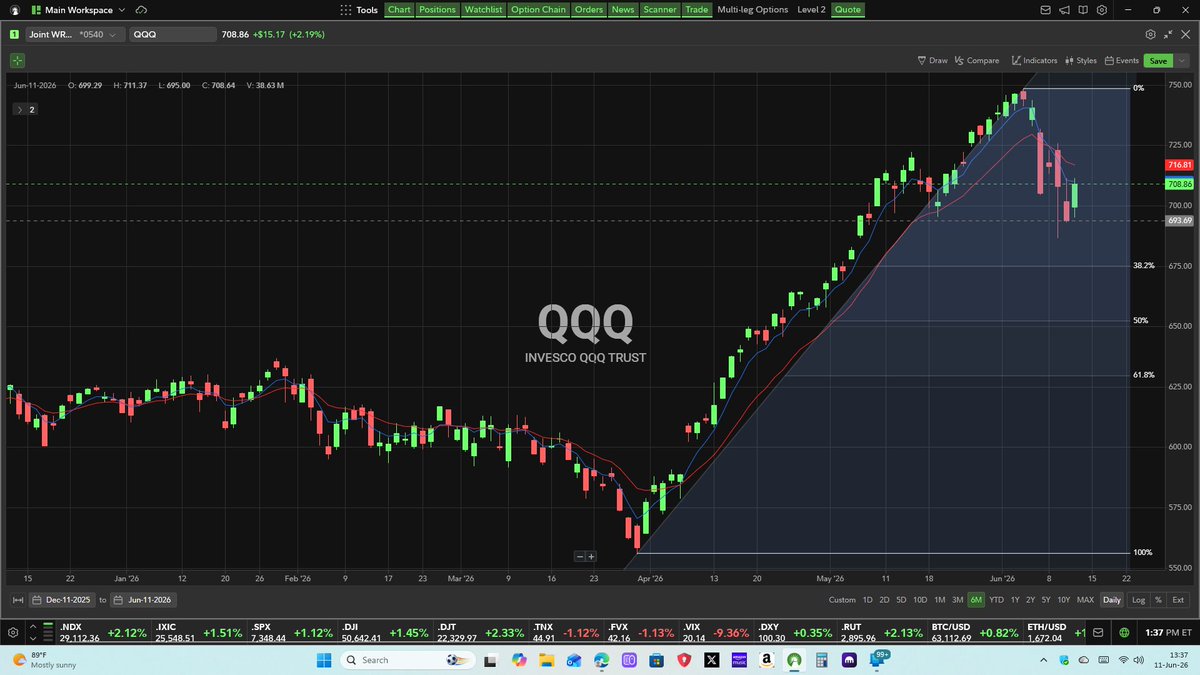
ALT $QQQ 6-month daily with 5/13 EMAs & Fibonacci retracement levels
ALT $BNB daily chart with Fibonacci levels, MAs, & technicals - MACD, AO, RSI, Stochastics
ALT $ETH daily w/ Fibonacci extensions, MAs, & technicals - MACD, AO, RSI, Stochastics
ALT $HYPE daily with Fib levels & extensions, MAs, & technicals - MACD, stochastics, Ao, RSI
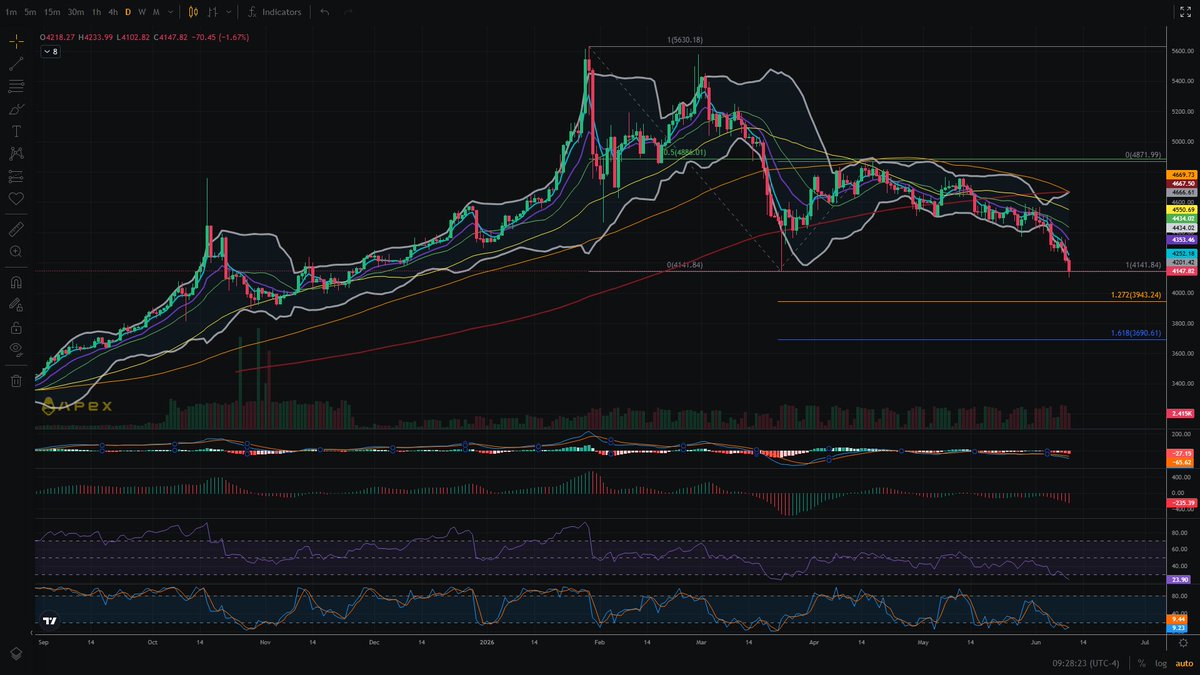
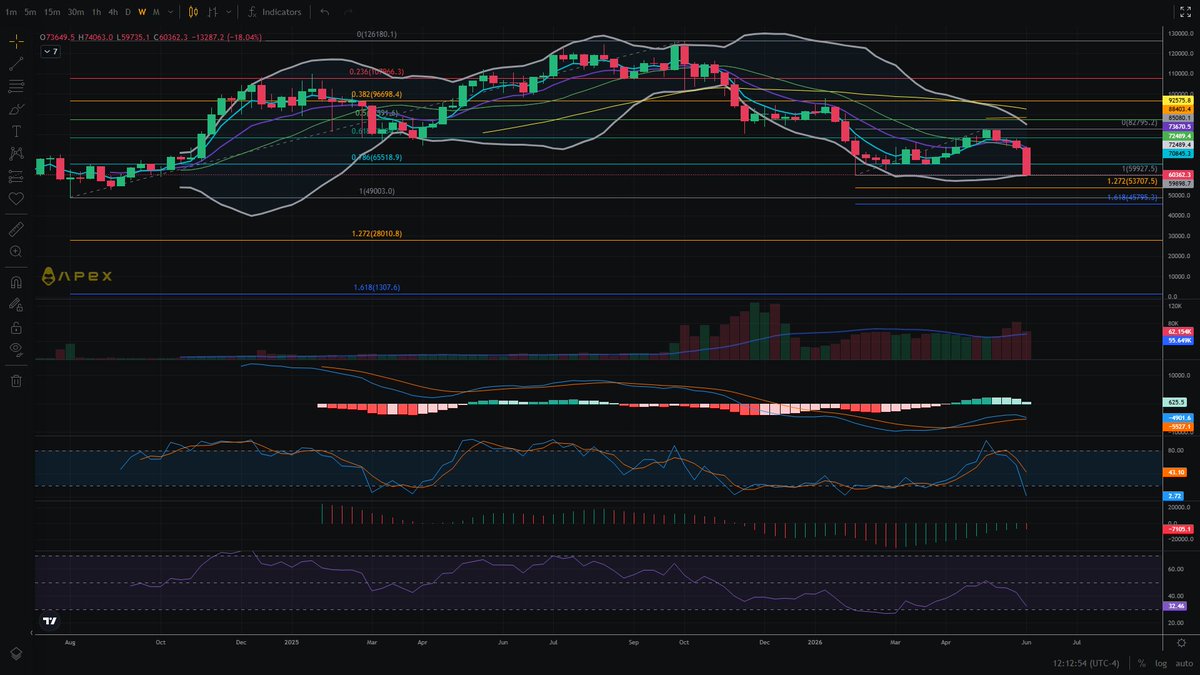
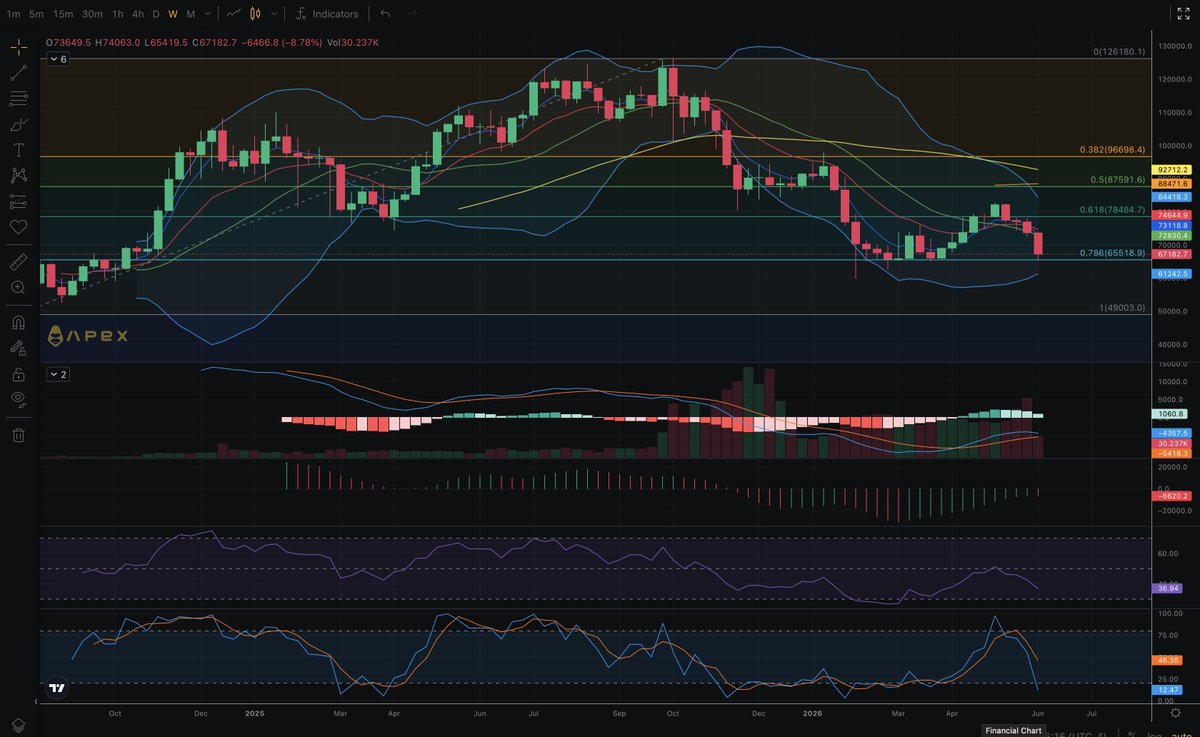
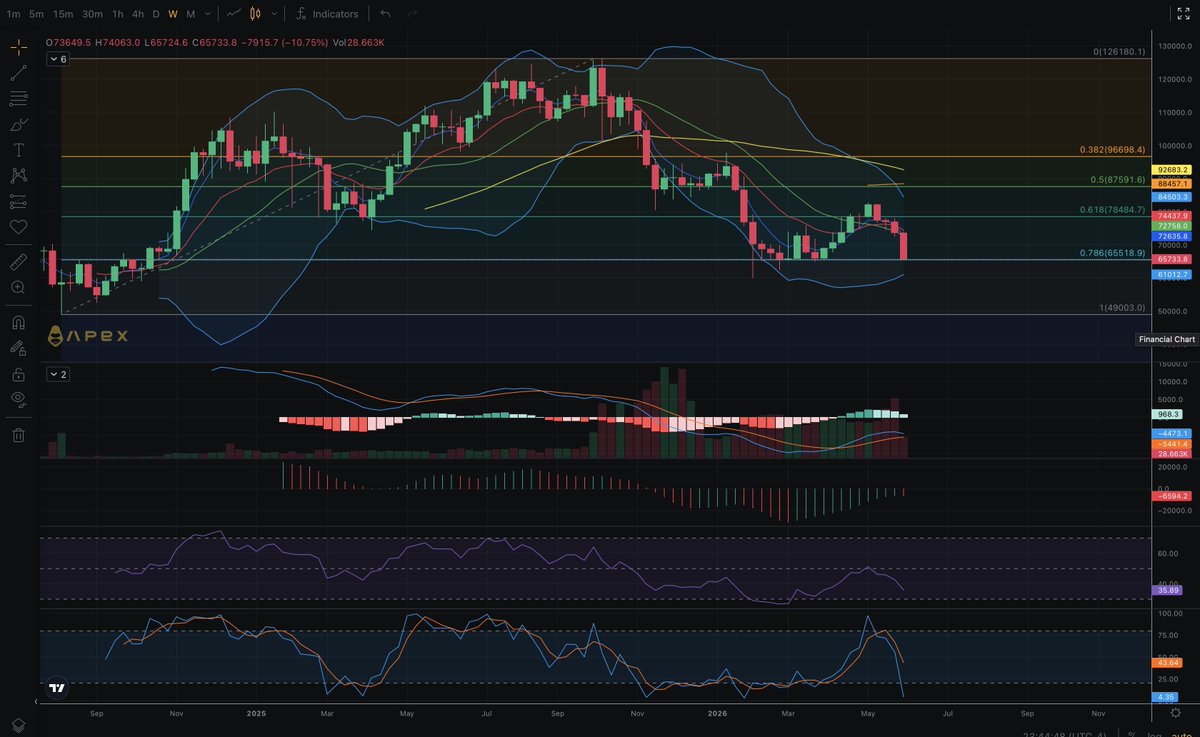
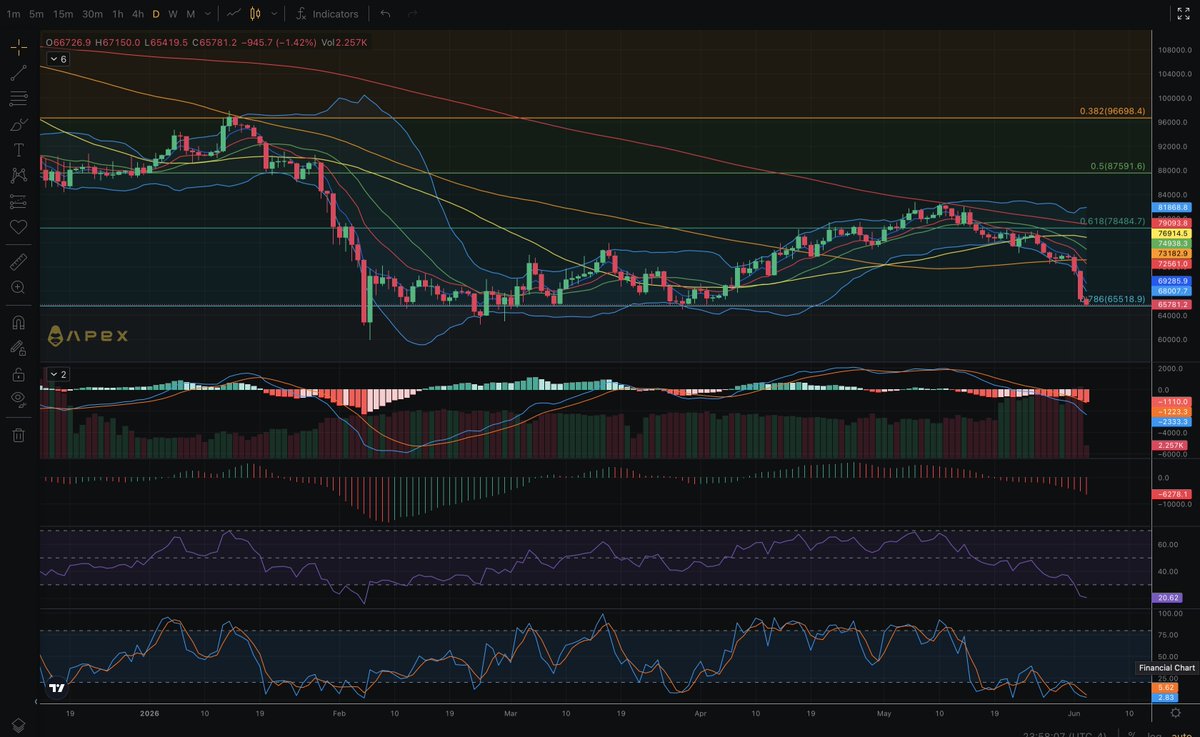
ALT $BTC weekly with Fibonacci levels & extensions, MAs, B. Bands, tehcnicals - MACD, stochastics, AO, RSI.
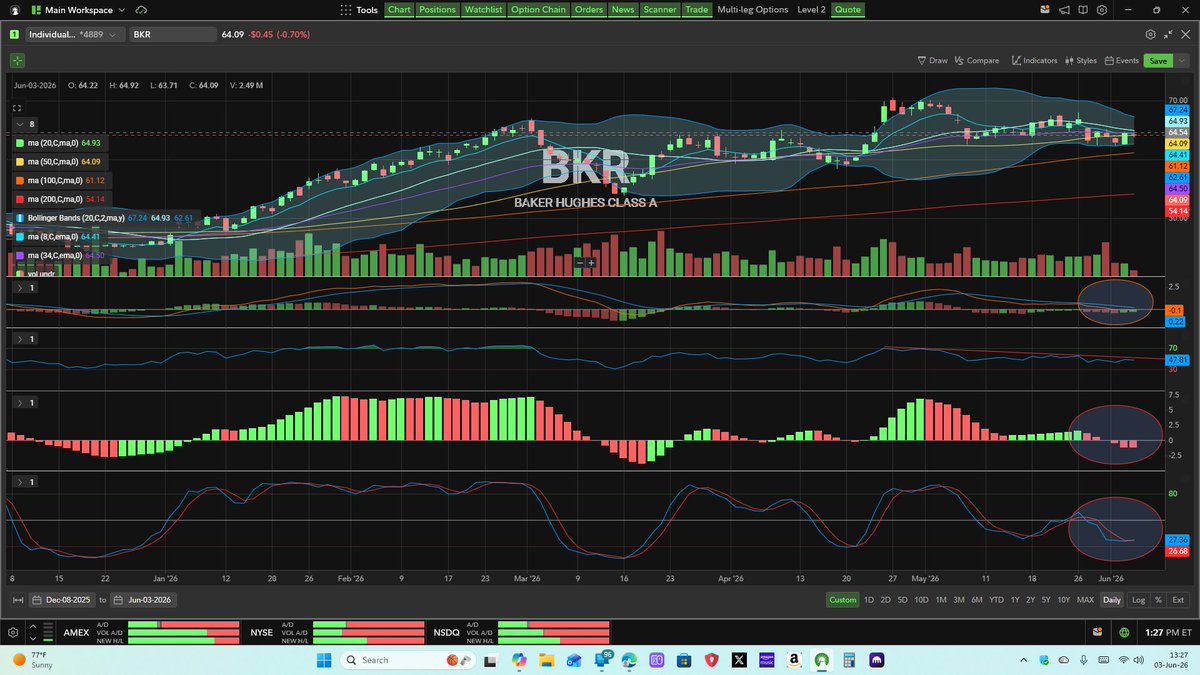
ALT $BKR 6-month daily w/ MAs, technicals - MACD, RSI, AO, stochastics
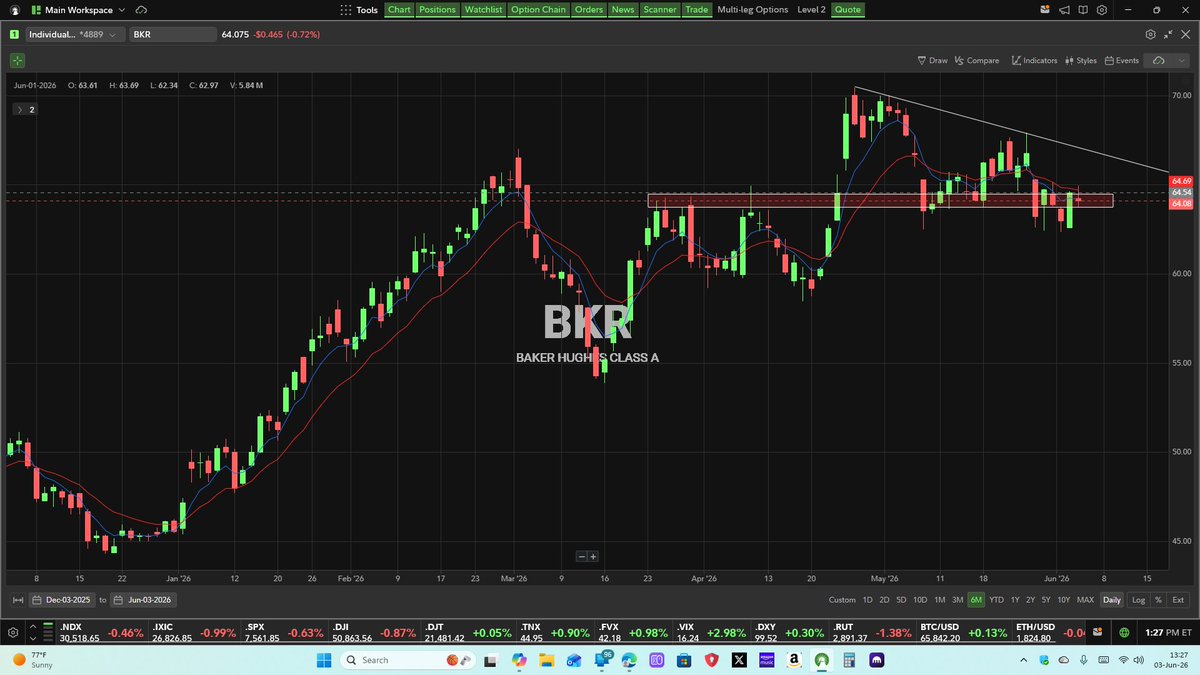
ALT $BKR 6-month daily with 5 & 13 EMAs, trend lines and support/resistance
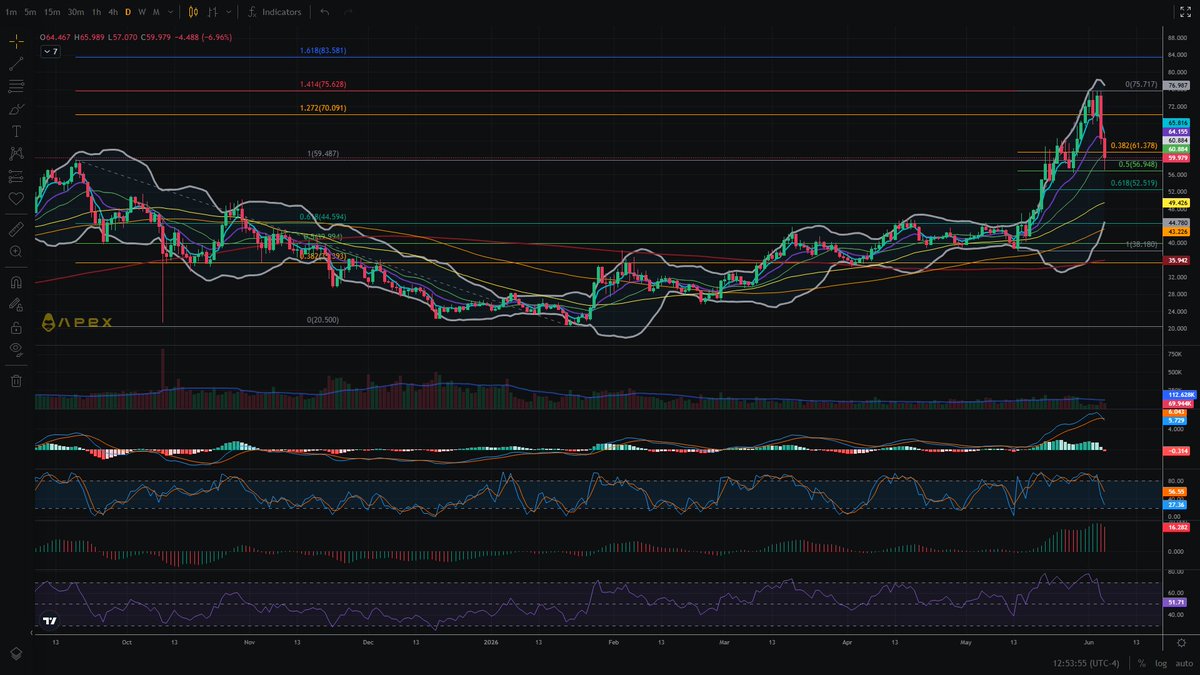
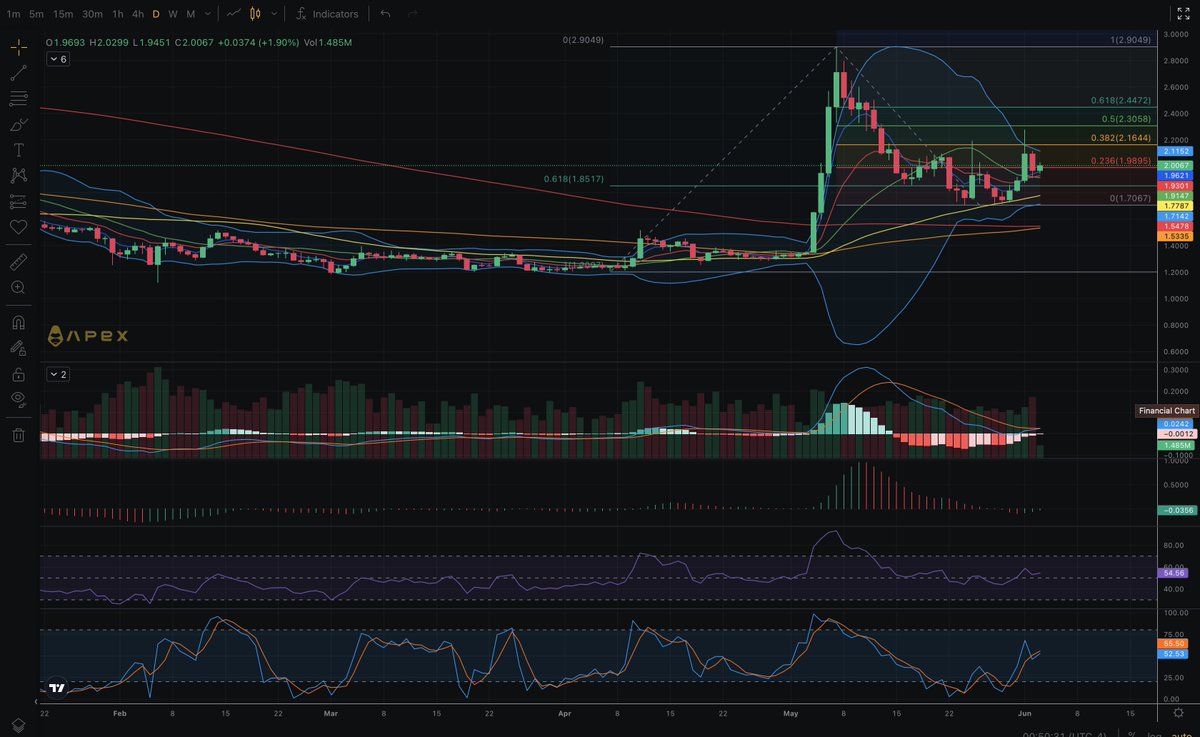
ALT $HYPE daily chart with MAs, technicals, Fib levels & extensions
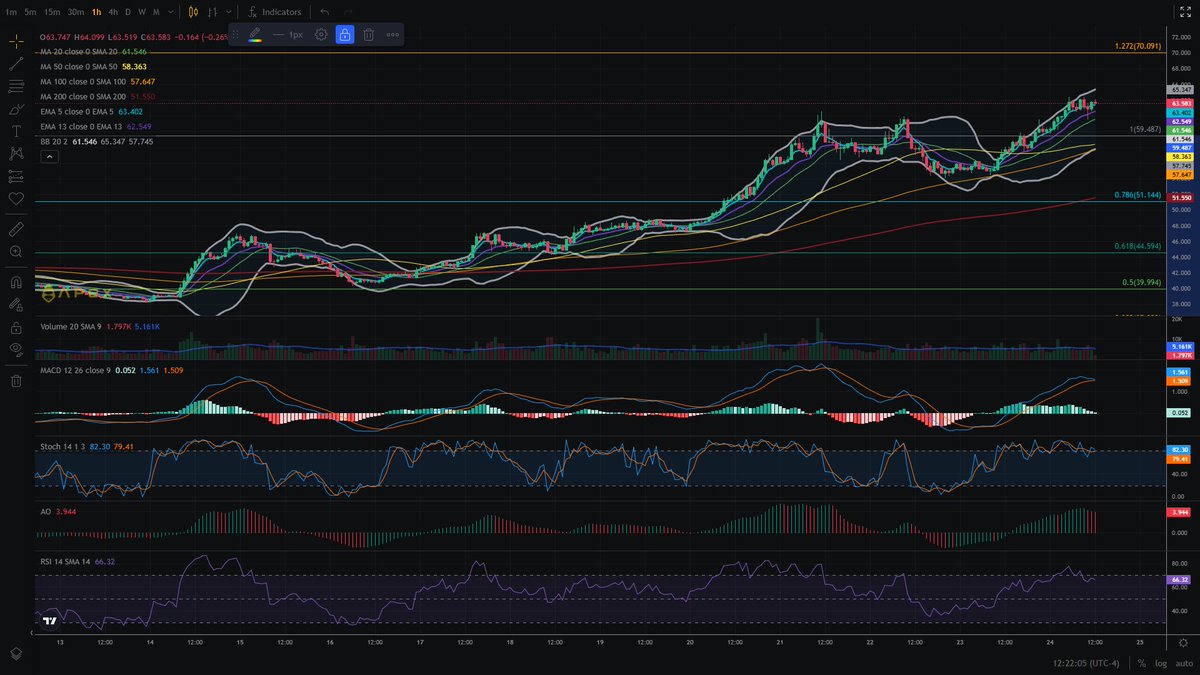
ALT $HYPE hourly chart with MAs, technicals, FIb levels & extensions
ALT QCOM 6-month daily with MAs & technicals - MACD, RSI, AO, stochastics
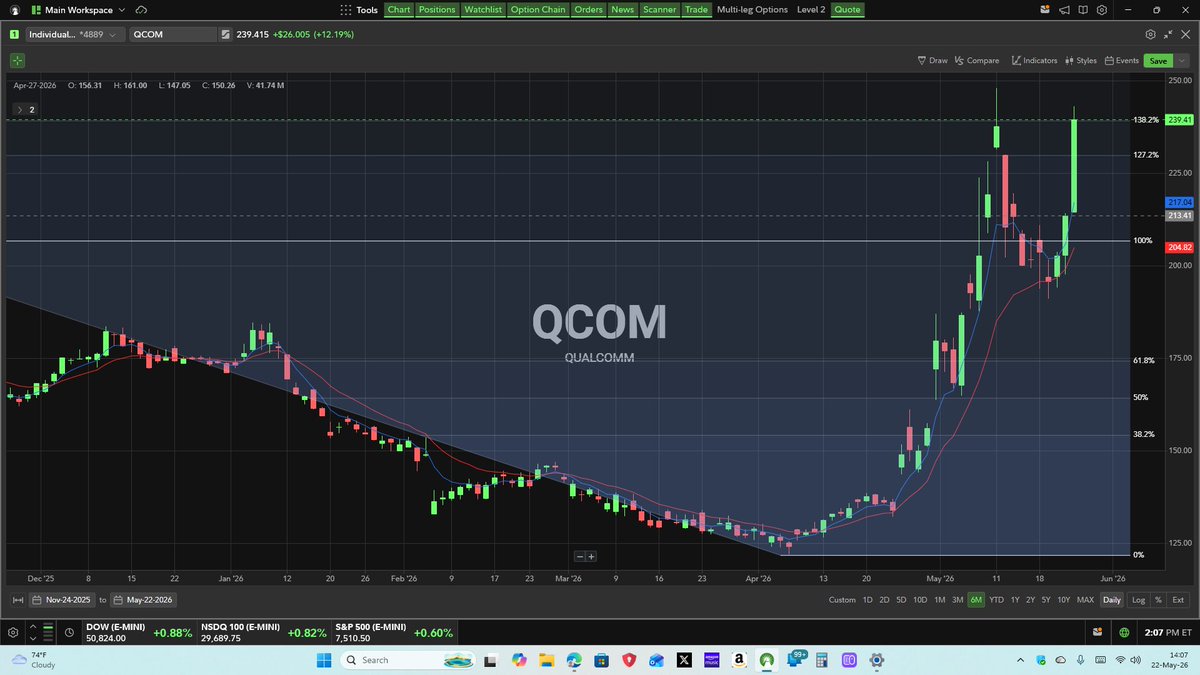
ALT QCOM 6-month daily chart with 5/13 EMAs & Fibonacci levels


ALT TSLA 6-month daily chart with MAs & technicals - MACD, RSI, AO, Stochastics

ALT TSLA 6 month daily chart with 5/13 EMAs, Fibonacci levels, & trend line support