
Joined February 2022
- Tweets 21,389
- Following 67
- Followers 217
- Likes 127
293 Photos and videos

6 Feb 2024
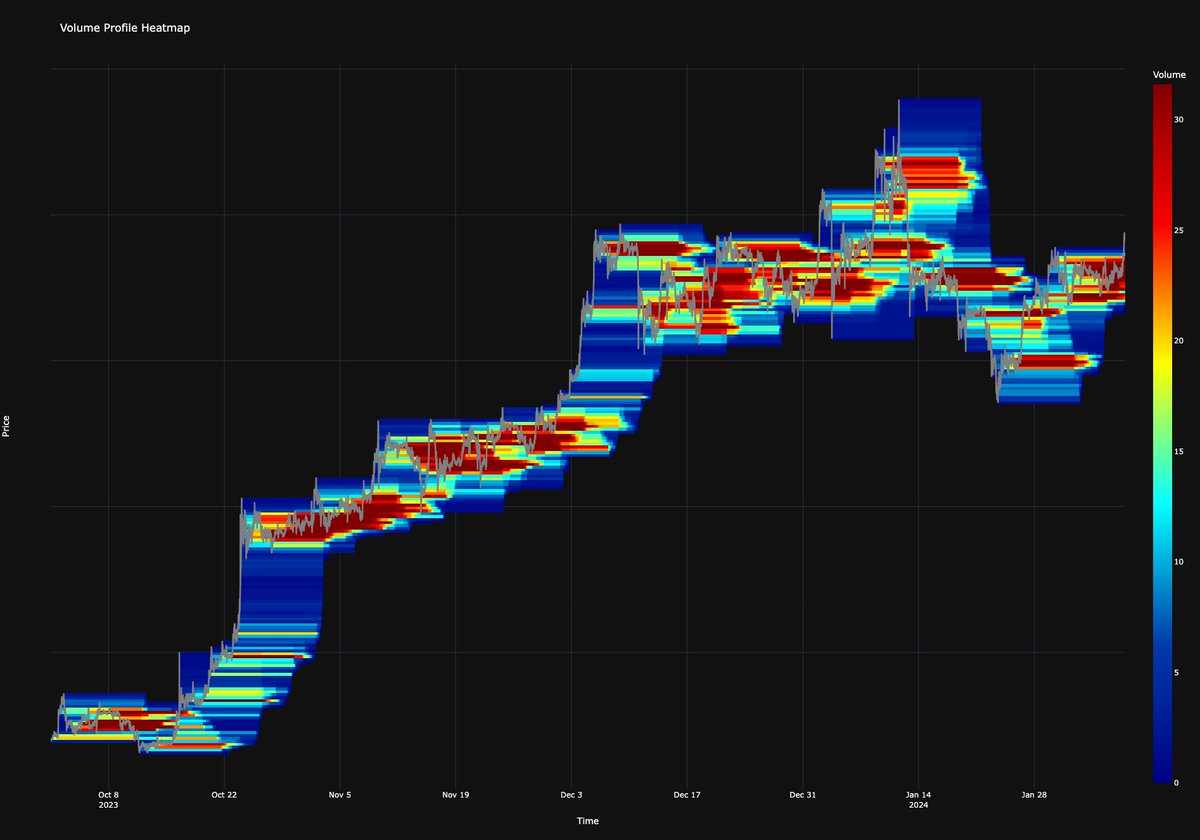
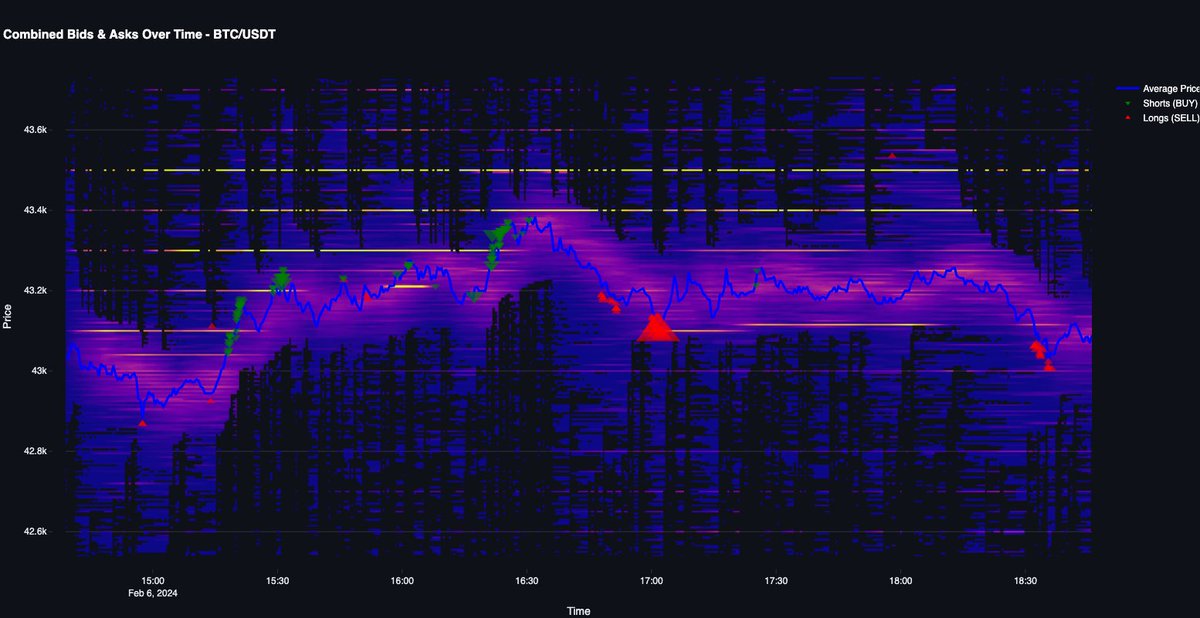
#BTC Market Update: Volatility is on display as the order book heatmap flashes with activity. Long liquidations (red triangles) signal a tough session for bulls, with key support levels being tested. Keep an eye on these zones; they're crucial for the next price move.
116
28 Sep 2023
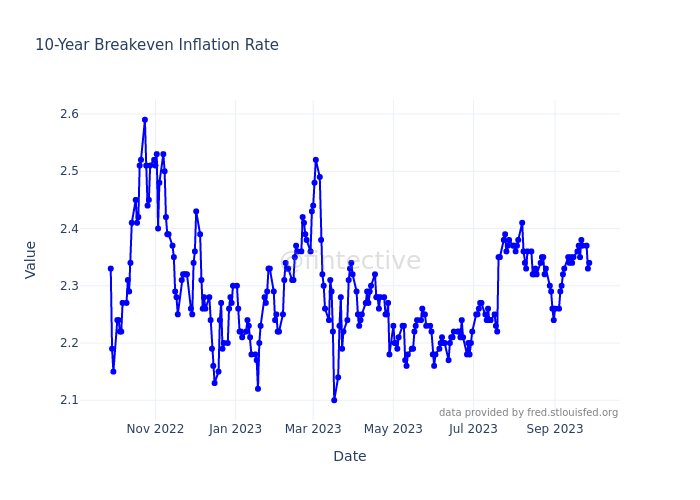
📈 New data for '10-Year Breakeven Inflation Rate':
Latest Value: 2.34 (2023-09-27)
Previous Value: 2.33 (2023-09-26)
Change: 0.43%
🧵👇🏼
1
84
28 Sep 2023
showing a slight increase in inflation expectations. This suggests that investors anticipate a modest rise in prices for goods and services over the long term. 🏷️📈
🔮 Keep an eye on this trend as it can impact interest rates, investment decisions, and the
1
25
28 Sep 2023
overall economy. Higher inflation expectations may lead to higher borrowing costs, affecting consumer spending and corporate profits. 💼💸 #InflationExpectations #Finance #EconomicIndicators
19
28 Sep 2023
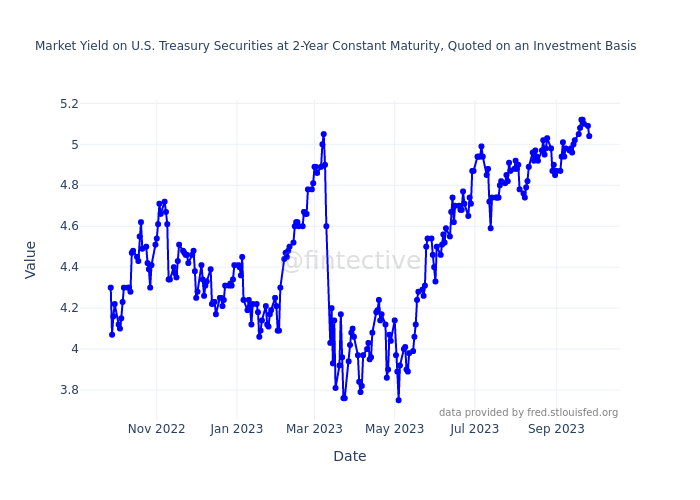
📈 New data for 'Market Yield on U.S. Treasury Securities at 2-Year Constant Maturity, Quoted on an Investment Basis':
Latest Value: 5.04 (2023-09-26)
Previous Value: 5.09 (2023-09-25)
Change: -0.98%
📅 New Weekly Low!
🧵👇🏼
1
23
28 Sep 2023
📈 The Market Yield on U.S. Treasury Securities at 2-Year Maturity 🇺🇸 is on the rise, currently at 5.04%. This metric measures the interest rate on 2-year Treasury bonds. As it increases, it suggests that investors expect higher yields for shorter-term
1
14
28 Sep 2023
investments and may indicate expectations of rising interest rates or inflation. Keep an eye on this as it impacts borrowing costs for consumers and businesses. #Economy #InterestRates #Investing
10
28 Sep 2023
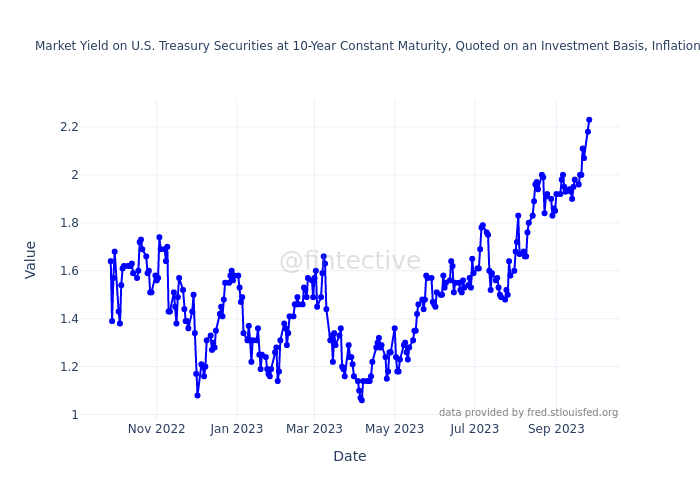
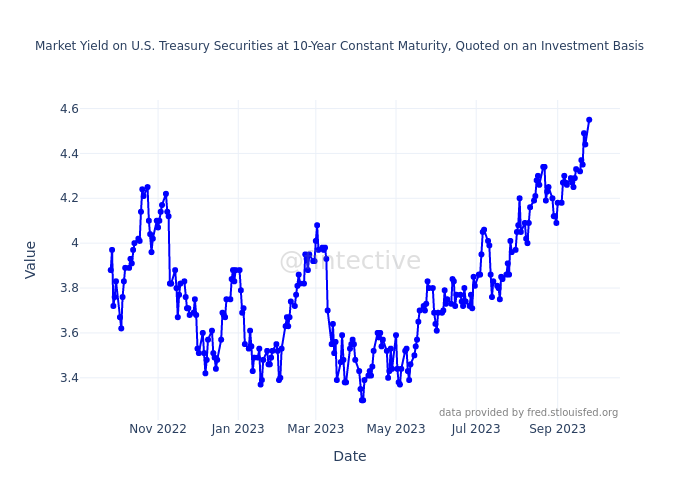
📈 New data for 'Market Yield on U.S. Treasury Securities at 10-Year Constant Maturity, Quoted on an Investment Basis, Inflation-Indexed':
Latest Value: 2.23 (2023-09-26)
Previous Value: 2.18 (2023-09-25)
Change: 2.29%
📅 New Monthly High!
🧵👇🏼
1
20
28 Sep 2023
concerns about inflation and the overall economic outlook.
💰 Higher values may indicate expectations of higher inflation and/or increased economic uncertainty. Lower values, on the other hand, may indicate lower inflation expectations and a more stable
1
9
28 Sep 2023
economic environment.
🔍 Keeping an eye on this metric can help us gauge market sentiment and make informed investment decisions. #Finance #Economy #Macroindicators
10
28 Sep 2023
📊 Finance Insights in a Nutshell! 📊
🔍 Economic indicators to watch! 🔍
💹 10-Year Breakeven Inflation Rate: 2.34% (⬆️ 0.43%)
📈 Indicates expectations of future inflation.
💰 SOFR Index: 1.10% (⬆️ 0.01%)
📅 New monthly high! Points to overnight borrowing
1
20
28 Sep 2023
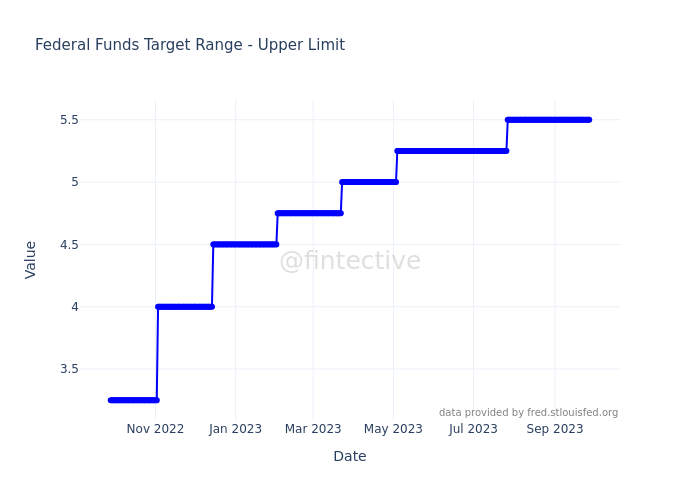
(No change)
🌚 No change. Reflects the Fed's target rate.
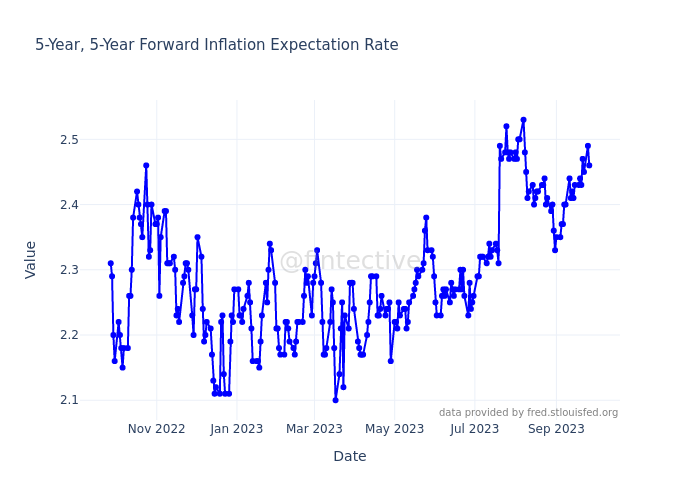
📉 5-Year, 5-Year Forward Inflation Expectation Rate: 2.45% (⬇️ 0.41%)
📌 Indicates long-term inflation expectations.
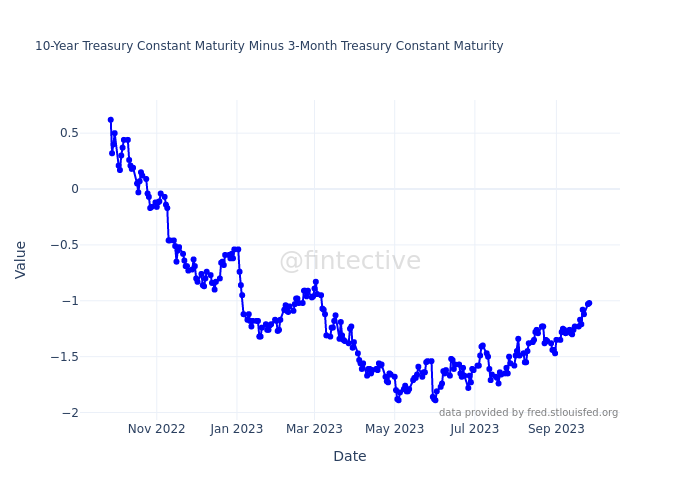
📈 10-Year Treasury Minus 3-Month Treasury: -0.97% (⬇️ 4.9%)
📅 New monthly high!
1
6
28 Sep 2023
Measures yield curve slope.
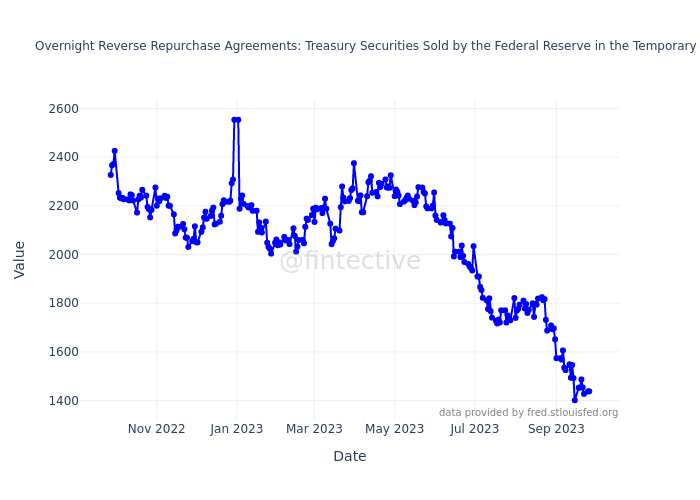
🌚 Overnight Reverse Repurchase Agreements Award Rate: 5.30% (No change)
🔒 No change. Shows rates for temporary operations.
📈 Stay informed for better financial decisions! 💼💡
7
28 Sep 2023
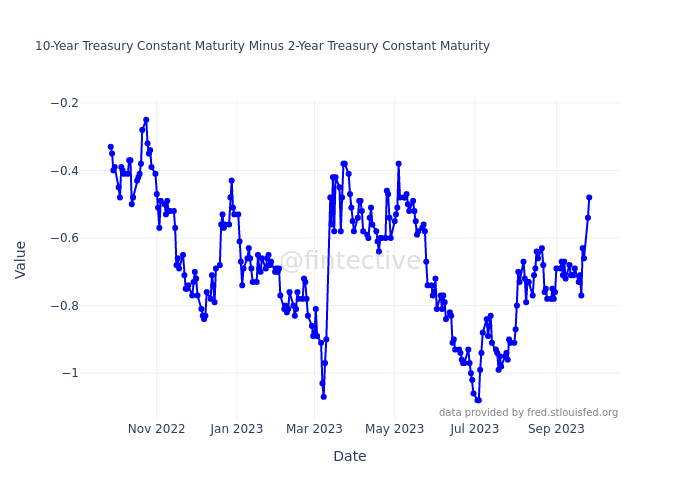
📈 New data for '10-Year Treasury Constant Maturity Minus 2-Year Treasury Constant Maturity':
Latest Value: -0.48 (2023-09-26)
Previous Value: -0.54 (2023-09-25)
Change: -11.11%
📅 New Monthly High!
🧵👇🏼
1
10
28 Sep 2023
📊 The 10-Year Treasury Minus 2-Year Treasury metric compares the yield on the 10-year bond with the yield on the 2-year bond, which gives insights into the market's expectations for future economic conditions.
📉 Currently at -0.48, the negative value
1
15
28 Sep 2023
suggests an inverted yield curve, indicating investors' concerns about the economy.
🔍 A declining trend may imply expectations of slower economic growth. Stay updated on macroeconomic indicators! 💼📉 #FinanceInsights #YieldCurve #EconomicIndicator
5