
Foresight Analytics is a leading provider of evidenced based investment consulting, data analytics, research and diligence solutions to global investors.
Joined October 2015
- Tweets 587
- Following 1,861
- Followers 339
- Likes 700
331 Photos and videos
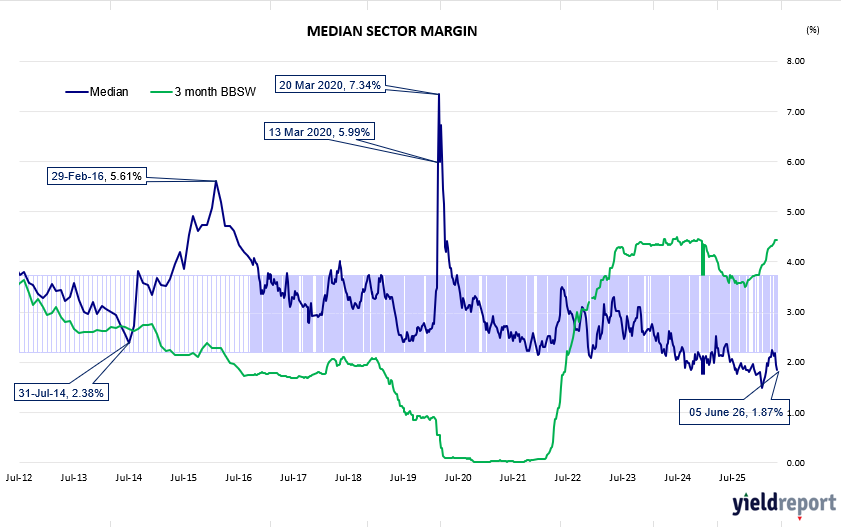


The ASX hybrid market concluded the week ending 5 June 2026 on a constructive note, with positive price momentum across much of the standard segment and income dynamics remaining firmly at the centre of investor decision-making in both cohorts.
Yield leadership held its familiar shape. Nufarm (NFNG) continued to head the non-standard space at 10.51%, with Ramsay Health Care (RHCPA) close behind at 9.17%. In the standard universe, Judo Capital (JDOPA) extended its lead to 9.78%, followed by Latitude (LFSPA) at 9.28% and Macquarie Bank Capital Notes 2 (MBLPC) at 9.10% — a trio that persists in offering a compelling yield premium relative to the densely clustered major bank names, sustaining their appeal among higher-income mandates.
Weekly price moves in the standard segment tilted decisively to the positive side. MBLPC was the week’s strongest performer, rebounding 2.22% after recent softness, while CBA PERLS 13 (CBAPJ) gained 1.07% and Latitude (LFSPA) recovered 2.09%. Challenger Capital Notes 4 (CGFPD) added 0.79% and Insurance Australia Capital Notes 2 (IAGPE) rose 0.59%. The principal detractor was Macquarie Group Capital Notes 4 (MQGPD), which gave back –4.67% following its sharp technical bounce the prior week, with Westpac Capital Notes 7 (WBCPJ) also slipping –0.80%. In the non-standard segment, NFNG eased a marginal –0.05% while RHCPA firmed 0.02%.
Trading margins sustained their barbell character. NFNG held at 6.04% and RHCPA at 4.70%, while within the standard cohort, Latitude (LFSPA) widened notably to 6.59% and MQGPD settled back to 3.95%. Core bank hybrids remained tightly ranged — AN3PL at 1.80%, WBCPM at 1.69%, and CBAPM at 1.68%. Closing prices stayed well above par for most names: JDOPA at 113.25, WBCPM at 106.95, AN3PL at 105.41, and CBAPM at 104.65, while NFNG edged higher to 84.50, continuing its gradual recovery.
The hybrid market reaffirmed its standing as a durable income allocation, with higher-beta names again delivering standout yield and core bank hybrids absorbing the week’s volatility with characteristic resilience.
zurl.co/H7Kzt
#foresightanalytics #yield #asx #termdesposit #cpi #finance #marketupdate
27
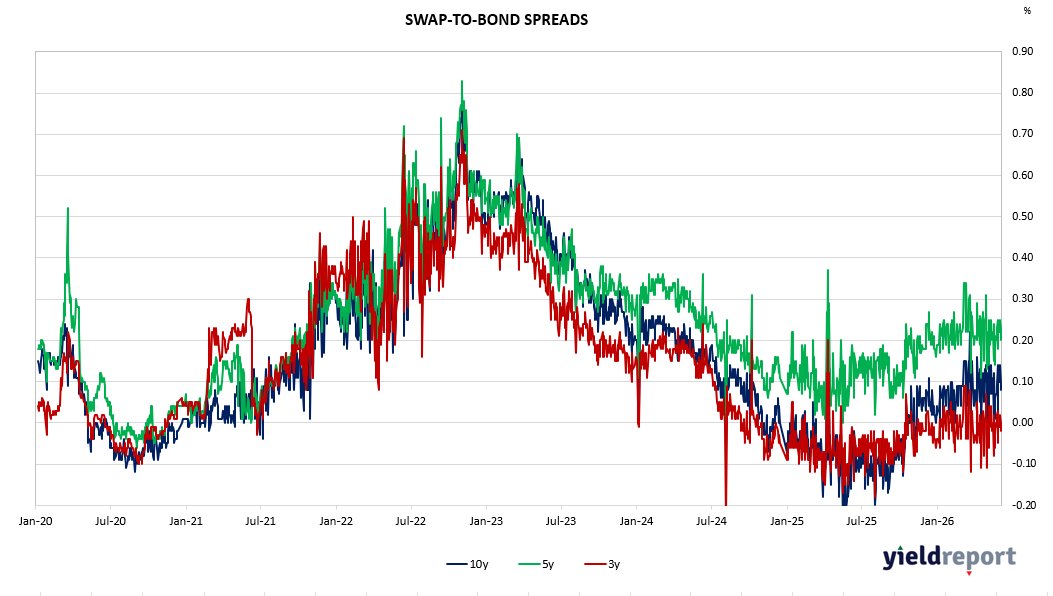
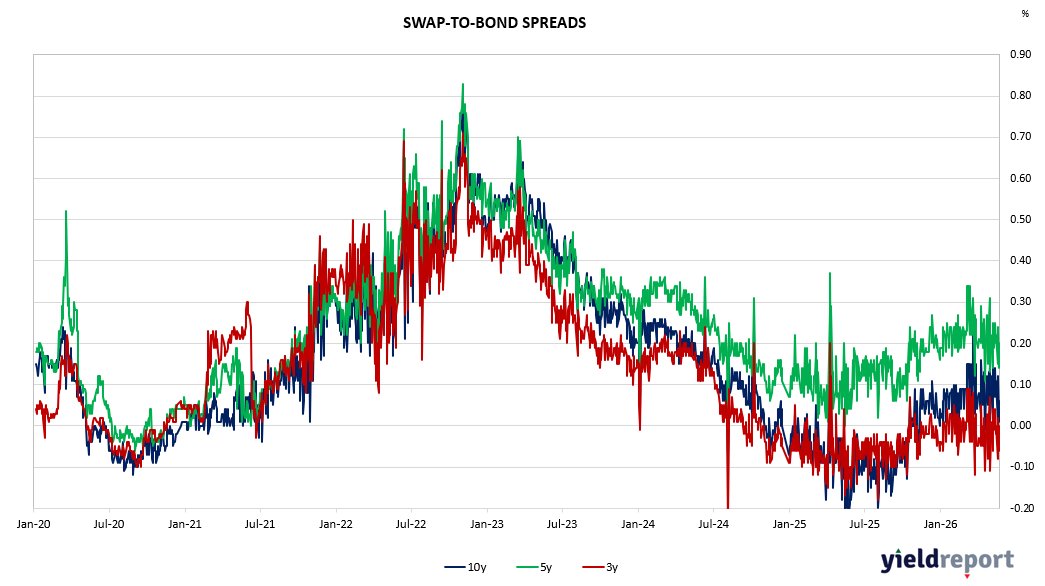
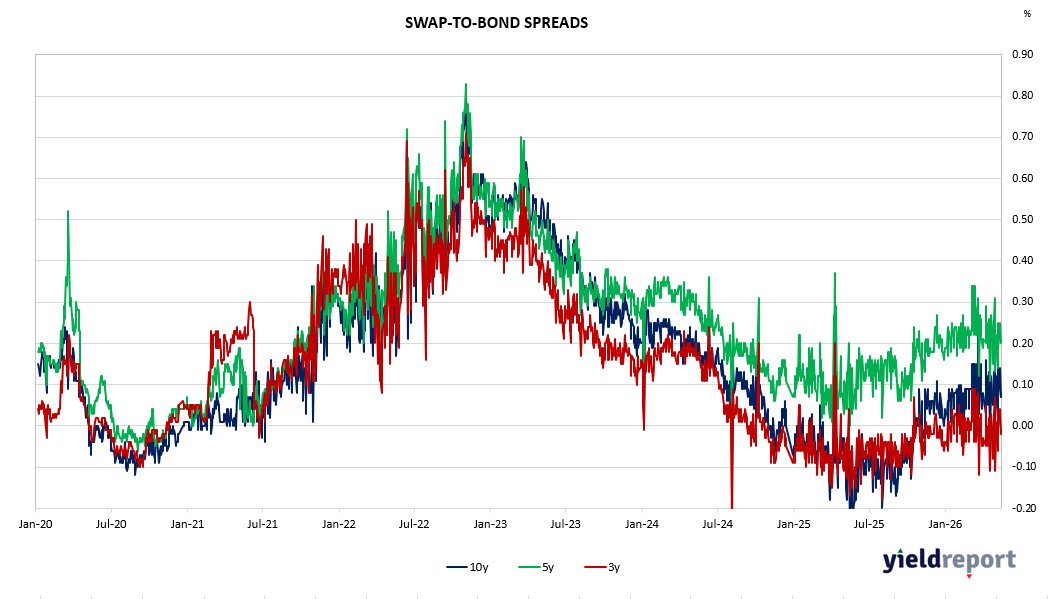
A notable split between near-term funding benchmarks and the interest rate swap curve continued to shape Australian fixed income through the week to 5 June 2026. Unlike the prior week’s divergence — where BBSW held firm while swaps retreated — both market segments registered gains in this period, yet the magnitude and direction of monthly moves remain starkly at odds, reflecting two distinct forces acting on either side of the yield structure.
Front-end BBSW rates extended their upward grind with characteristic tenacity, sustaining the firmness that has taken hold across the short end since late April. The 1-month tenor closed flat on the week at 4.30 per cent, yet its monthly advance of 8 basis points remains among the more pronounced gains across the strip — a consistent signal of tightness at the immediate funding horizon. The 3-month rate gained 3 basis points over the week to settle at 4.47 per cent, with a matching monthly gain of 8 basis points indicating that the pressure has spread further along the front end. The 6-month tenor posted the week’s largest BBSW move, climbing 6 basis points to 4.86 per cent, while its monthly rise of 13 basis points suggests conditions in the medium-term funding window are still tightening, rather than approaching the equilibrium seen at shorter horizons. The trajectory across all three tenors reinforces a picture of a funding market operating under sustained policy constraint.
The swap curve moved in the same upward direction on the week, though its monthly profile tells the opposite story. The 1-year rate added 4 basis points to 4.61 per cent, while the belly of the curve registered the strongest weekly advances: both the 3-year and 5-year tenors gained 7 basis points, settling at 4.54 per cent and 4.81 per cent respectively. The 10-year and 15-year maturities each rose 6 basis points, closing at 4.99 per cent and 5.13 per cent. Monthly changes, however, cut against these weekly gains — the 1-year has shed 4 basis points over four weeks, while the 3-year and 5-year tenors are down 7 and 5 basis points respectively, with longer maturities off 3 to 4 basis points. The swap curve appears to be recovering lost ground incrementally, even as the broader consolidation phase that defined recent months remains in force.
#FixedIncome #InterestRates #BBSW #InterestRateSwaps #BondMarket #AustralianMarkets #YieldCurve #MarketUpdate #InvestmentResearch #YieldReport #foresightanalytics
28
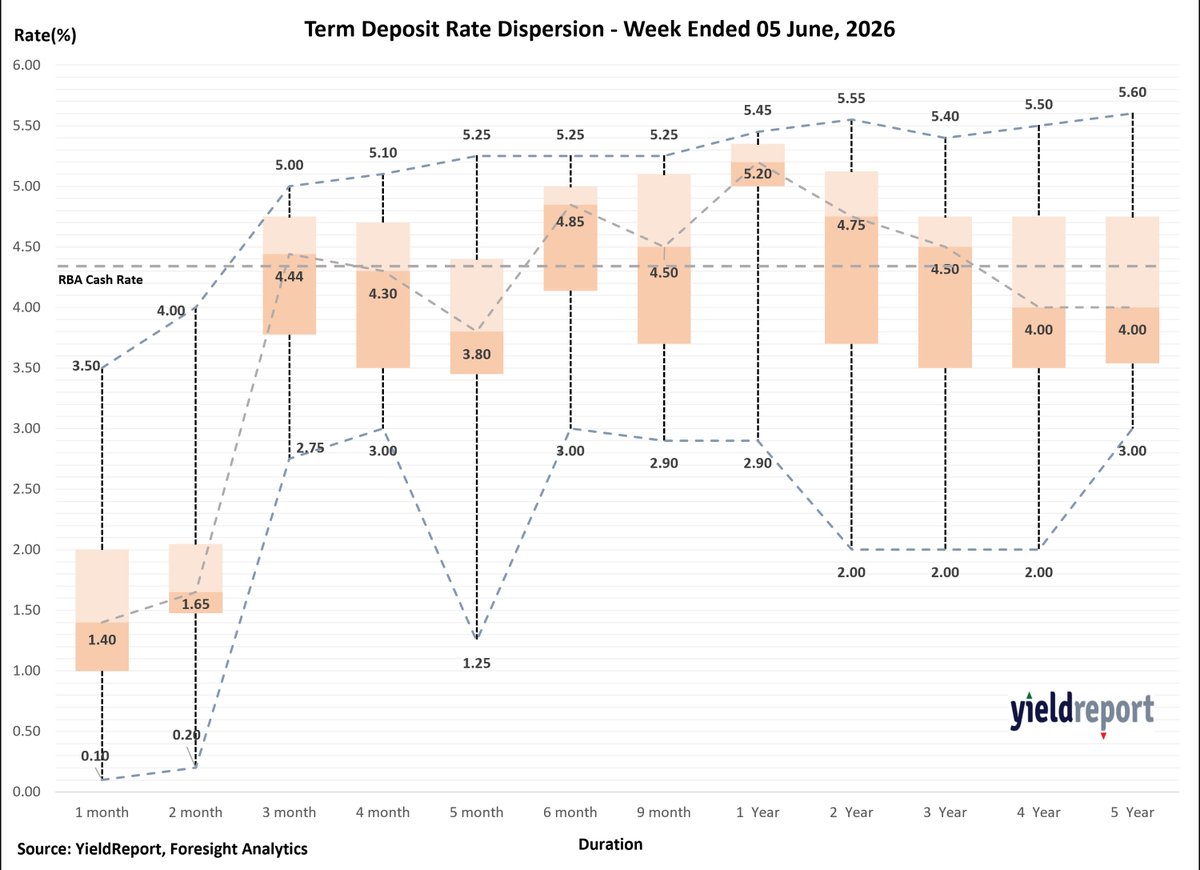
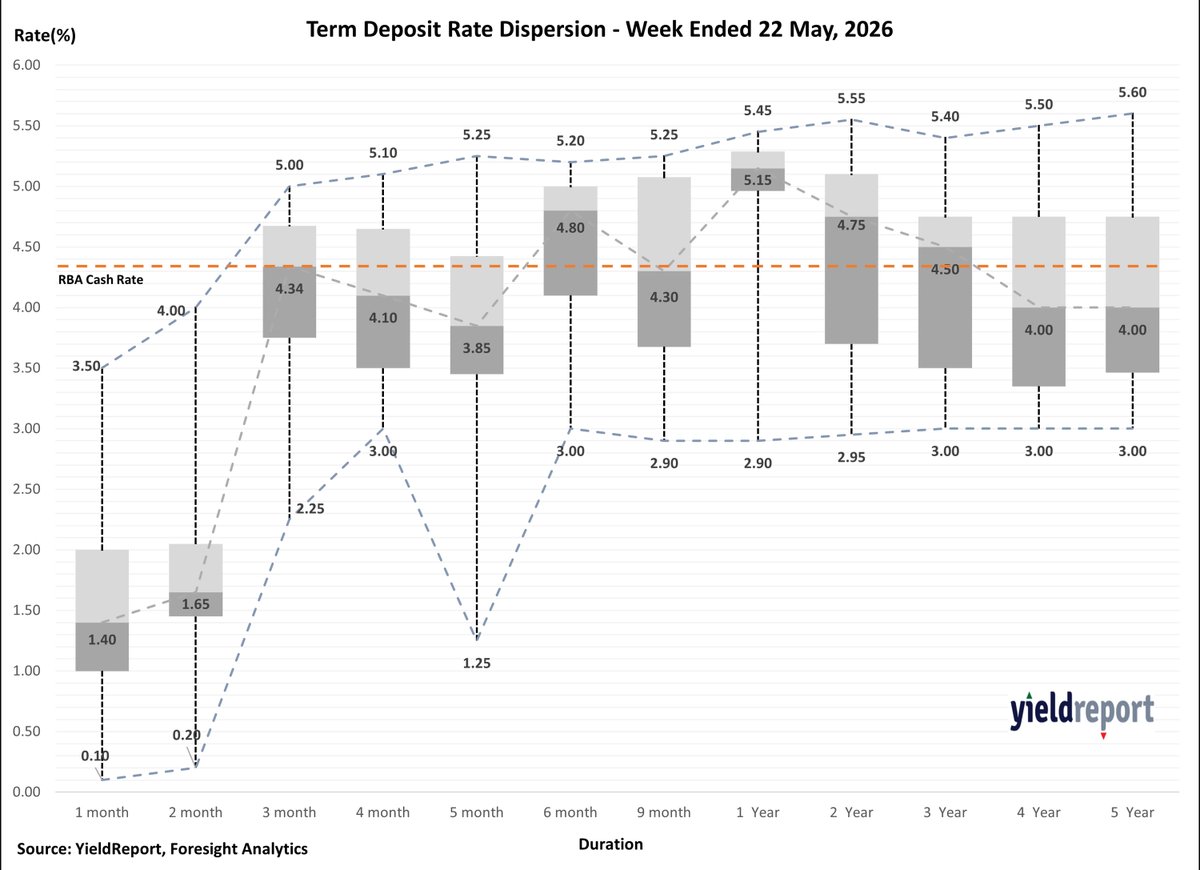
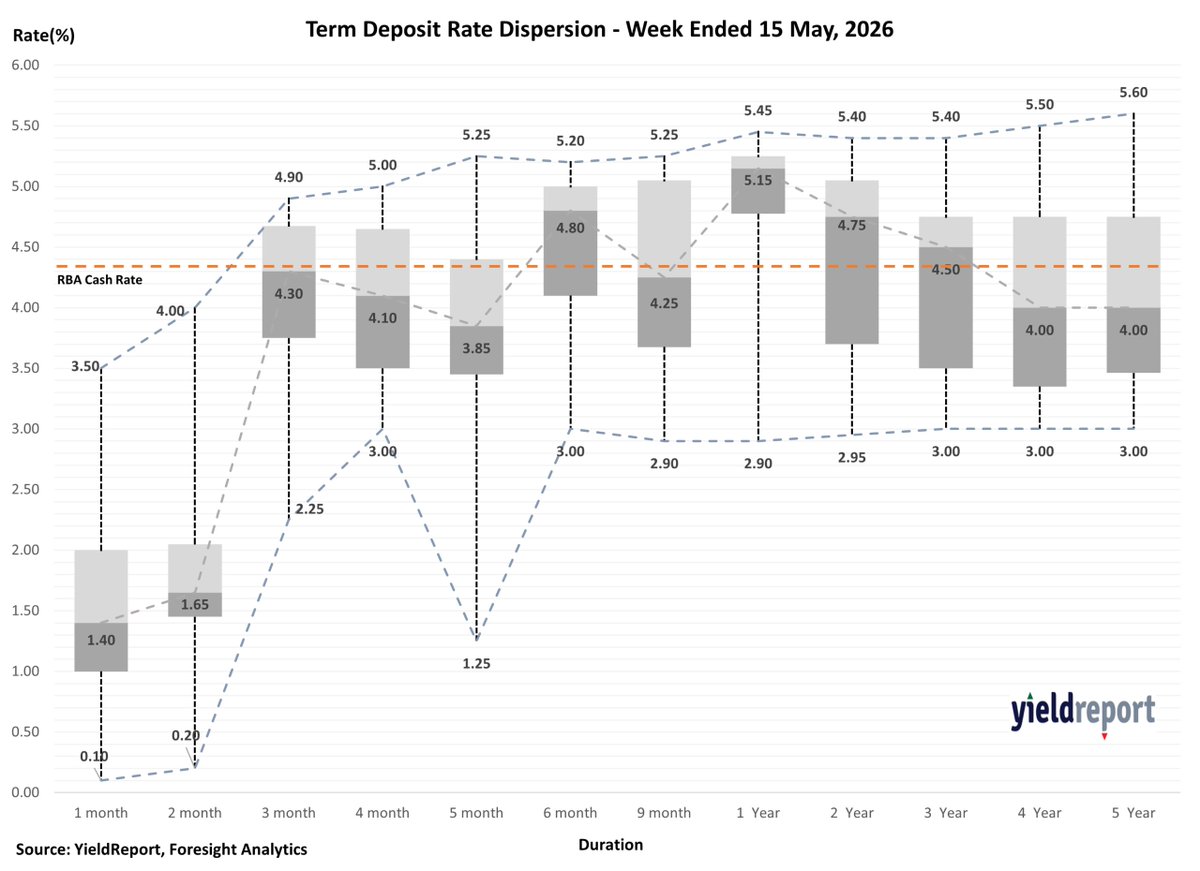
Weekly Australian Term Deposits Update | Week Ending 5 June 2026
The sweet spot in the term deposit market remains the 6–12 month segment, where competition is strongest and rates are most attractive.
🔹 1-Year deposits continue to lead the market, offering an average rate of 4.95%, with top rates reaching 5.45%.
🔹 6-Month deposits remain highly competitive, averaging 4.54%, with leading rates up to 5.25%, making them an attractive option for investors seeking flexibility and strong income.
🔹 Short-term deposits (1–2 months) continue to lag, with average rates below 2%, although a handful of institutions offer rates up to 4.00%.
🔹 Longer-term deposits (2–5 years) feature attractive headline rates, including 5.60% at 5 years, but broader market averages remain lower than the 6–12 month segment.
📈 Market dispersion remains highest in the 2-year and 4-year tenors, while 1-year rates are tightly clustered, highlighting strong competition and pricing consistency across providers.
For investors focused on balancing yield, certainty, and flexibility, the 6-month to 1-year range continues to provide the strongest value across the Australian term deposit curve.
Read more - zurl.co/RdslI
#termDeposits #InterestRates #YieldReport #FixedIncome #CashManagement #YieldInvesting #IncomeStrategy #AustralianMarkets #RBA #MarketCommentary #foresightanalytics
13
Explore our latest Cross-Asset Market Insights
The market is repricing and this time, it's happening everywhere at once.
The secular bull market driven by AI, digital infrastructure and electrification remains intact. But investors who confuse a strong long-term outlook with a smooth short-term journey are about to learn an expensive lesson.
Markets are confronting a single, uncomfortable possibility: interest rates may need to stay higher for longer. That realisation is rippling across every asset class simultaneously.
The long-term story hasn't changed. The journey just got bumpier.
📄 Read the full Foresight Analytics report here.
linkedin.com/feed/update/urn…
Not investment advice.
#CrossAssetVolatility #InterestRates #FederalReserve #AIInvesting #BondMarkets #FX #Gold #Bitcoin #Equities #MacroOutlook #ForesightAnalytics #InvestmentResearch #PortfolioStrategy #ForesightAnalytics
19
Australia – Korea and Tech Lead, Crypto Remains Under Pressure
The week ending 29 May 2026 was characterised by a continuation of the technology and Asia-focused rally, with South Korean and semiconductor exposures dominating the leaderboard. The iShares MSCI South Korea Capped ETF (IKO) was the standout performer with a 9.2% weekly return, extending its remarkable 12-month gain to 204.5% — the best across the entire Australian ETF landscape. The Betashares Asia Technology Tigers ETF (ASIA) followed at 7.7%, with the Betashares Space Industry ETF (RCKT) close behind at 6.8%. Global X’s suite performed well, with the FANG Currency Hedged ETF (FHNG) and Ultra Long Nasdaq 100 ETF (LNAS) each rising 6.7%, and the Semiconductor ETF (SEMI) adding 6.3%. Clean energy and AI also featured among weekly winners, with VanEck Global Clean Energy (CLNE) and Global X Artificial Intelligence (GXAI) each gaining around 6%.
On the downside, digital assets remained firmly out of favour. Ethereum products led the declines, with EETH falling 7.0% and Monochrome Ethereum (IETH) down 5.9%. Bitcoin ETFs shed between 4–6%, with EBTC and BTXX each declining 6.2% and SNAS (the inverse Nasdaq product) dropping 6.3%. Crude oil (OOO) was also a notable laggard, falling 9.5% for the week — the worst performer across the broader market — while Betashares Global Energy (FUEL) slipped 4.9%.
Over twelve months, the picture remains striking at the top end: South Korea (IKO, 204.5%), hydrogen (HGEN, 182.1%) and semiconductors (SEMI, 158.3%) continue to lead all comers. Battery tech and lithium (ACDC, 105.3%), green metals (GMTL, 109.3%) and physical silver (ETPMAG, 102.4%) have also more than doubled. At the other end, crypto products dominate the bottom of the 12-month table, with Bitcoin ETFs down roughly 38–40% and Ethereum products off around 34%.
On flows, the headline story of the week was a A$96.3m inflow into the Betashares Australia 200 ETF (A200), the largest single-week flow, pointing to renewed domestic equity conviction. Broad infrastructure products also attracted meaningful interest, with VanEck FTSE Global Infrastructure (IFRA) pulling in A$79.6m and VanEck FTSE International Property (REIT) adding A$60.9m — suggesting persistent appetite for defensive real assets alongside the risk-on tone in equities. On the redemption side, Betashares Australian High Interest Cash (AAA) saw the largest outflow at A$190.8m, potentially reflecting a rotation out of cash as risk appetite improved. Magellan Global (MGOC) and the Quay Global Real Estate funds also continued to experience significant outflows over both the YTD and 12-month periods.
Read more zurl.co/HlFIO
#ETF #ETFInvesting #Investing #USMarkets #ASX #SP500 #AustralianShares #GlobalMarkets #MarketUpdate #InvestmentStrategy #foresightanalytics #yield
136
Featured Macro Insight – Investment Boom, Consumption Bust: Australia’s Uneven March Quarter
Australia’s economy kept growing in the first three months of 2026, but only just. The 0.3% quarterly expansion — the weakest result in a year — fell well short of market expectations of 0.5% and marked a sharp step down from the 0.9% recorded in the December quarter. On an annual basis, output rose 2.5%, also below the 2.7% consensus forecast.
Strip back the headline, and the picture is even more sobering. GDP per capita — the measure that most closely reflects living standards — slipped 0.1% in the quarter, leaving it just 1.0% higher than a year ago. For most Australians, the sense that the economy has not been working for them is borne out in the data.
Read more - zurl.co/1Yb4w
#AustraliaEconomy #GDPGrowth #InvestmentBoom #ConsumptionBust #DataCentres #BusinessInvestment #LivingStandards #LabourMarket #MacroInsights #EconomicOutlook
7
Overview of the US Treasuries Market
Strong US Jobs Report Revives Rate-Hike Fears and Pushes Treasury Yields Higher
US bond markets experienced a sharp sell-off following a stronger-than-expected May employment report, reigniting concerns that the Federal Reserve may need to keep monetary policy tighter for longer. The move pushed Treasury yields significantly higher, strengthened the US dollar and prompted investors to reassess expectations for interest rates through the remainder of 2026.
The key catalyst was a robust labour market report showing nonfarm payrolls increased by 172,000 jobs in May, more than double market expectations of 80,000. In addition, payroll figures for the previous two months were revised upward by a combined 93,000 jobs, while the unemployment rate remained steady at 4.3%. The data suggested that labour market conditions remain resilient despite higher interest rates and ongoing geopolitical uncertainty. Markets interpreted the report as reducing the likelihood of near-term monetary easing. Instead, investors increasingly focused on the risk that persistent labour market strength could sustain inflationary pressures. Futures markets quickly repriced expectations, with the probability of at least one Federal Reserve rate hike by the end of 2026 rising above 70%, compared with just above 50% before the employment data was released.
The reaction was most evident at the front end of the yield curve. The two-year Treasury yield, which is highly sensitive to Fed policy expectations, climbed to 4.16%, its highest level since February 2025. The benchmark 10-year Treasury yield rose to 4.54%, marking its largest weekly increase in several weeks and ending a two-week decline in yields. The rise in yields reflected investors demanding higher compensation for holding government bonds in an environment where interest rates may remain elevated. The US dollar also strengthened as higher yields improved the attractiveness of US assets. Interestingly, this occurred despite a modest decline in oil prices as hopes for easing tensions in the Middle East emerged. Normally, lower oil prices would support lower inflation expectations and bond prices, but the strength of the employment report overwhelmed those effects.
Looking ahead, markets will focus closely on the upcoming Federal Reserve meeting and future inflation data. While some policymakers continue to leave the door open to rate cuts, the latest labour market data suggests the Fed may have little urgency to ease policy. Instead, investors are increasingly preparing for the possibility that the next move in US interest rates could be higher rather than lower.
#USTreasuries #BondMarket #TreasuryYields #FedPolicy #RateHikeFears #JobsReport #LabourMarket #InterestRates #USDollar #FixedIncome #GlobalMarkets
40
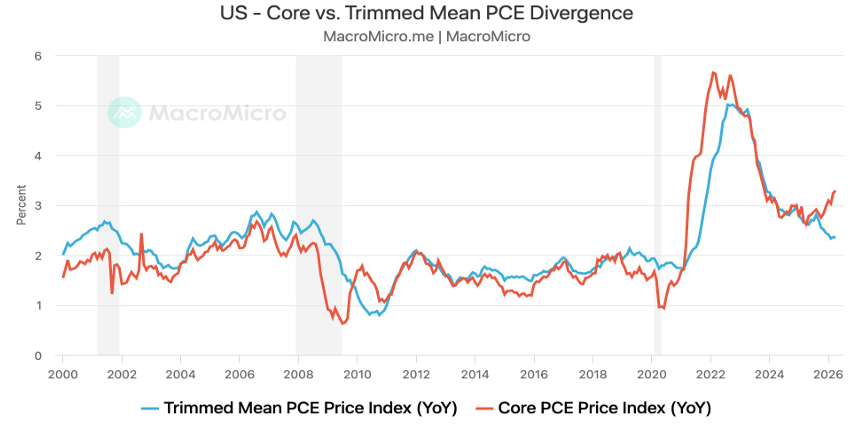
Chart of the Week - Warsh’s Preferred Gauge Points Lower, but Its Reliability Is in Question
Federal Reserve Chair Kevin Warsh has signalled a preference for the Dallas Fed’s trimmed mean inflation measure over traditional core inflation gauges, arguing it better captures broad-based price pressures by excluding extreme price movements. However, a growing divergence has emerged, with core PCE inflation re-accelerating while trimmed mean inflation continues to trend lower. Much of the gap reflects sharp increases in AI-related software prices, which carry a significantly larger weight in PCE than in CPI. Critics argue the trimmed mean measure may be understating inflation because its methodology excludes a disproportionate number of large positive price moves. Similar shortcomings were evident during the 2021 inflation surge, suggesting the current moderation in trimmed mean inflation may reflect limitations of the measure rather than genuine easing in underlying price pressures
Read more weekly update - zurl.co/iwiSp
#TrimmedMeanInflation #CorePCE #AIPricePressures #InflationMetrics #FedPolicy #UnderlyingInflation #MacroTrends #EconomicAnalysi #PriceDynamics #MonetaryPolicy
Srimanti Bagchi Jay Kumar Mitra M Prashant Kumar Divya Balasubramanian, CFA George Zhao, Ph.D. Karthiyaini Thangavel Brigi Meeha Karthiyaini Thangavel Sangeeta Kumar
67
Overview of the Australian Equities Market
Australian Shares Retreat as Commodity Weakness Weighs on Miners
Australian equities finished the week on a weaker footing, with falling commodity prices and ongoing uncertainty surrounding Persian Gulf peace negotiations weighing on investor sentiment. The S&P/ASX 200 fell 0.7% on Friday to close at 8,625.1, while the broader All Ordinaries Index declined 0.68%. Over the week, the ASX 200 lost 1.2%, reflecting growing caution among investors despite generally resilient global economic conditions.
The materials sector was the primary drag on the market as commodity prices continued to soften. Iron ore futures fell for a fourth consecutive week, declining from around US$112 per tonne to US$102 as increased global supply and weaker steel demand pressured prices. Major miners such as BHP and Rio Tinto came under selling pressure, while copper prices also dropped more than 4% over two trading sessions. Gold producers similarly struggled after gold prices retreated to around US$4,445 per ounce, and rare earth and battery mineral stocks also posted losses. losses. Financial stocks added to the market’s weakness, with the sector now declining in seven of the past eight weeks and ending at its lowest weekly close since December. Concerns around housing market conditions and a more cautious outlook for bank earnings continued to weigh on investor sentiment. Given that materials and financials represent more than half of the Australian share market, weakness in both sectors had a significant impact on overall index performance.
Energy stocks also softened as Brent crude oil hovered near US$95 per barrel. Although geopolitical tensions in the Persian Gulf remain elevated, investors appear increasingly focused on economic fundamentals and corporate earnings rather than day-to-day developments in peace negotiations. In contrast, defensive sectors such as healthcare, consumer staples and utilities continued to attract support, recording consecutive weekly gains. The standout performer was the information technology sector, which surged 7.6% over the week as investors rotated into data centre and artificial intelligence-related opportunities.
Among individual stocks, Megaport jumped more than 11% following a $518 million capital raising to expand its AI infrastructure strategy, while Nib Holdings gained after selling part of its Australian and New Zealand distribution business to Allianz. Meanwhile, the Australian dollar edged lower against major currencies, reflecting the broader risk-off tone across markets
#AustralianEconomy #CommodityMarkets #RiskOff #Inflation #InterestRates #GlobalMarkets #MarketOutlook #InvestmentStrategy #PortfolioManagement #AssetManagement
1
75
Weekly Overview of the US Equities Market
Strong Jobs Data Ends Wall Street Rally and Revives Rate-Hike Fears
Wall Street’s powerful rally came to an abrupt halt as stronger-than-expected US employment data triggered a sharp reassessment of interest rate expectations, leading to a broad sell-off across equities, bonds and cryptocurrencies. Markets had enjoyed a strong recovery since late March, supported by easing geopolitical tensions and enthusiasm surrounding artificial intelligence, but investors became increasingly concerned that resilient economic growth could keep inflation elevated and delay monetary easing. The technology sector bore the brunt of the sell-off. The Nasdaq 100 fell nearly 5%, its worst daily performance since April 2025, while a major semiconductor index plunged 10%. The S&P 500 dropped 2.6%, ending its attempt to record a tenth consecutive week of gains. The decline reflected growing investor concerns that valuations in AI-related stocks had become stretched after months of exceptional performance and strong earnings results. Some investors are now questioning whether the extraordinary growth rates achieved by AI leaders can be sustained.
The catalyst for the market reversal was a surprisingly strong US jobs report. Employment growth in May exceeded all forecasts, while the unemployment rate remained steady at 4.3%, reinforcing the view that the US economy remains resilient. While strong labour market conditions are generally positive for economic growth, they also raise concerns that inflationary pressures may persist, reducing the likelihood of Federal Reserve rate cuts. Markets have now begun pricing in the possibility that the Fed’s next move could be a rate increase rather than a cut. The shift in expectations pushed Treasury yields sharply higher, with the two-year Treasury yield rising 12 basis points to 4.16% and the 10-year yield climbing to 4.54%. The US dollar strengthened, while Bitcoin fell more than 4% and Ethereum declined 11%, reflecting reduced appetite for speculative assets. Looking ahead, investors will focus closely on the upcoming Federal Reserve meeting under new Chairman Kevin Warsh. While many economists still expect the Fed to remain on hold, continued strength in employment and inflation data could bring rate hikes back into consideration. For now, the market is grappling with a familiar dilemma: strong economic growth is supportive of earnings, but it may also mean interest rates stay higher for longer.
Read more - zurl.co/PBoEo
#USEquities #StockMarket #WallStreet #SP500 #Nasdaq #Investing #Markets #Equities #MarketUpdate #FinancialMarkets
30
Australian inflation delivered a headline surprise in April, with the Consumer Price Index (CPI) rising 0.4% in the month to stand 4.2% higher over the year — a notable moderation from the 4.6% annual pace recorded in March. At face value, the result appears encouraging. Beneath the surface, however, the picture is more complex. Volatile and policy-affected items masked what is an increasingly persistent underlying inflation story, and most analysts caution that the calm may be short-lived.
foresight-analytics.com/borr…
#cpi #inflation
11
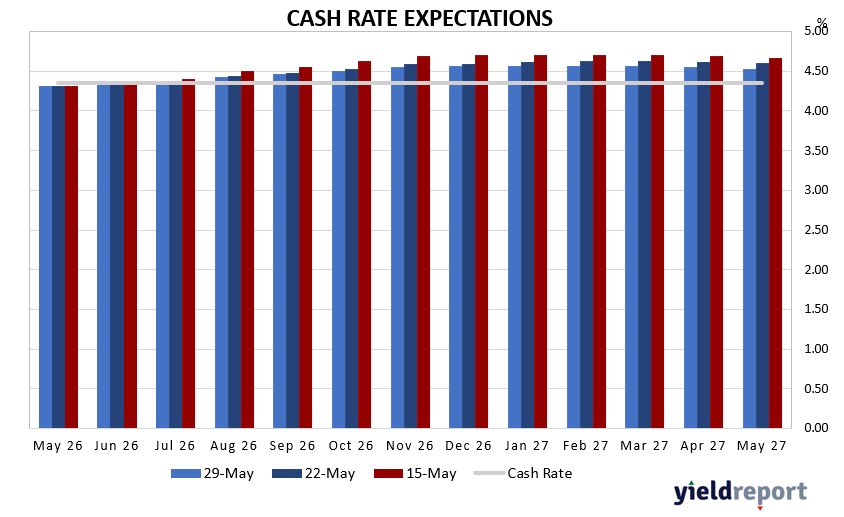
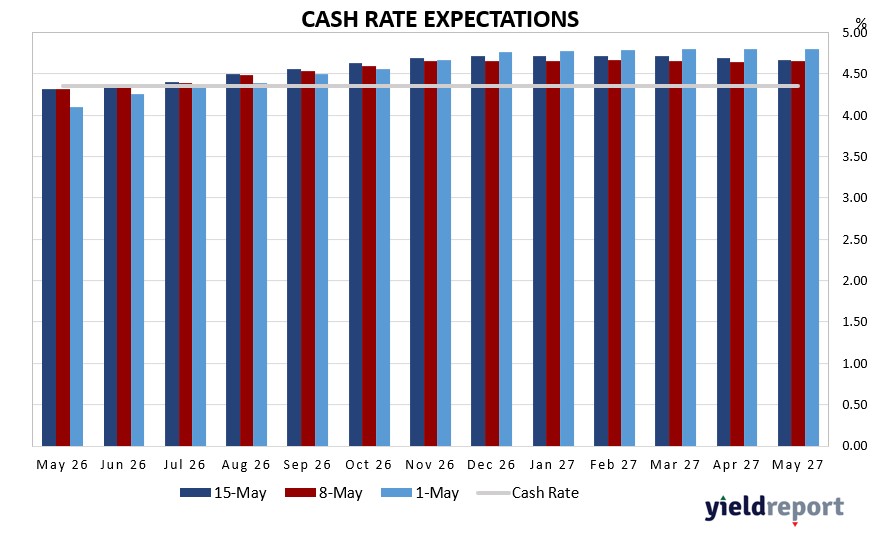
Weekly Cash Rate Update -
Australian interest rate market pricing has eased more decisively over the week to 29 May 2026, with the 29 May curve sitting visibly below both the 22-May and 15-May profiles across the forward horizon. The step-down is progressive and modest at the front end but increasingly pronounced through the middle and longer tenors, marking a clearer dovish shift compared to the consolidation observed in prior weeks. This repricing suggests markets are reassessing the likelihood of further tightening following the RBA’s May decision to lift the cash rate by 25 basis points to 4.35%.
Read more - zurl.co/Oovmt
#WeeklyCashReport #RBACashRate #InterestRateOutlook #AustralianMarkets #SavingsAccounts #foresightanalytics
#FixedIncome #MonetaryPolicy
8
Over the past week, ending May 29, 2026, the strongest opportunity across the deposit curve remains concentrated around 6 months to 1 year, where average rates are highest and competition is deepest. The standout tenor is 1 year, with an average rate of 4.93%, median 5.18%, and top rates of 5.45% from RACQ Bank. This suggests the 1-year segment continues to offer the best balance of yield, breadth and reliability.
For shorter terms, value remains uneven. 1–2-month deposits have low average rates of 1.53% and 1.78%, with wide ranges driven by a few high-rate outliers. Great Southern Bank and in1bank lead at 3.50%–4.00%, but most institutions are materially lower. These terms suit liquidity parking only.
The 3–5-month range is more attractive. The 3-month average is 4.17%, median 4.34%, with top rates led by Great Southern Bank and Bank Australia at 5.00%, RACQ Bank, Bank First, ING Direct and Macquarie Bank at 4.90%. At 5 months, P&N Bank at 5.25% and Judo Bank at 5.20% stand out, although dispersion remains high due to BOQ’s low 1.25% outlier.
Read more - zurl.co/HumAD
#TermDeposits #DepositRates #FixedIncome #SavingsStrategy #AustralianMarkets #IncomeInvesting #YieldReport #InterestRates
35
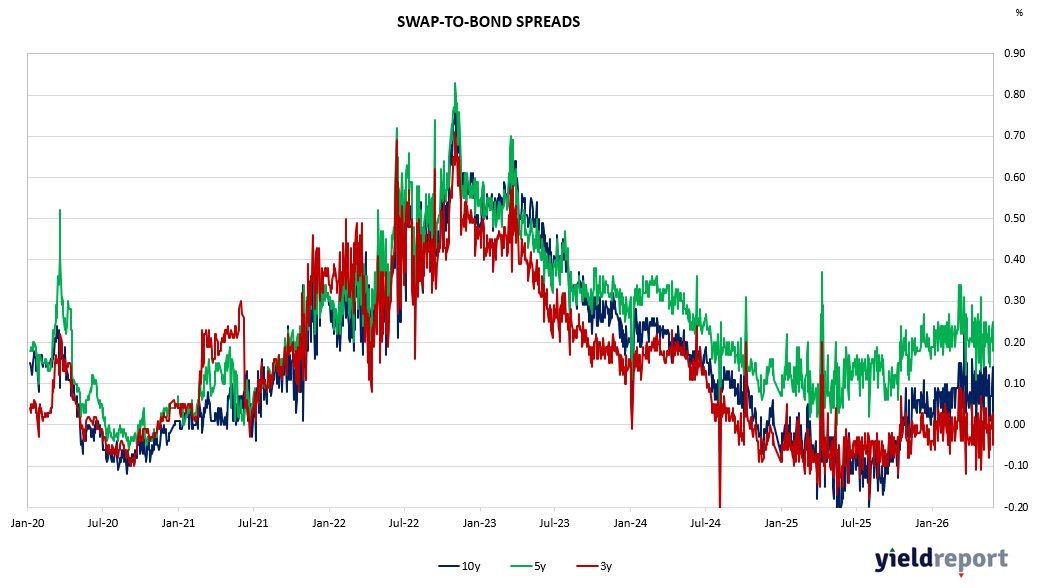
A sharp divergence between near-term funding markets and the interest rate swap curve defined Australian fixed income through the week to 29 May 2026. Rather than moving in concert, BBSW rates held their ground or edged marginally higher while swap rates retreated across every tenor — most decisively in the belly of the curve — pointing to a meaningful reassessment of medium-term rate expectations in the wake of sustained upward pressure over recent months.
Read more - zurl.co/YWDm5
#BankBillSwaps #InterestRates #FixedIncome #AustralianMarkets #YieldReport #BBSW #MonetaryPolicy #IncomeInvesting #foresightanalytics
17
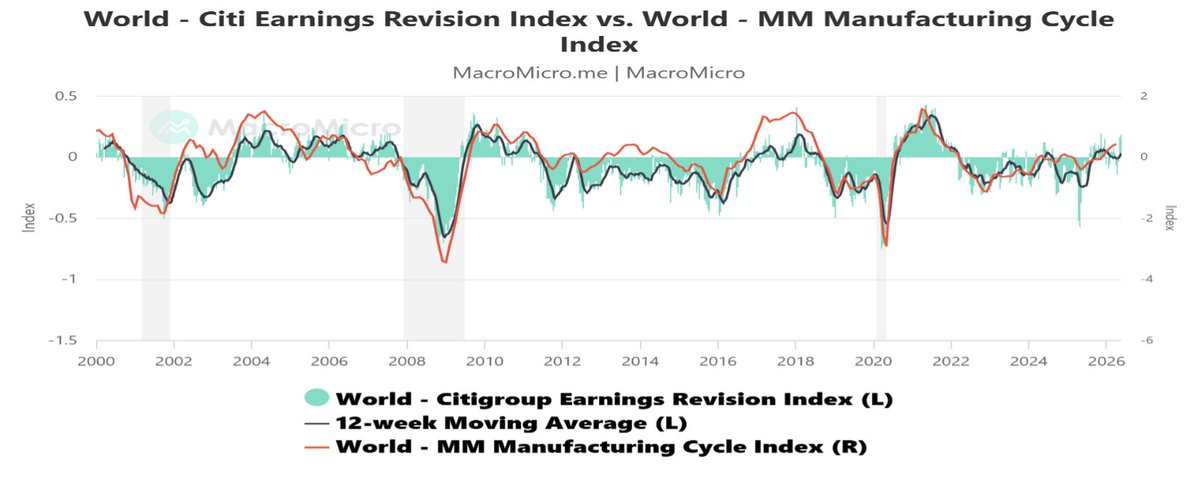
Chart of the Week –Cyclical Upswing – Global Earnings and Manufacturing Cycle
Despite heightened geopolitical tensions and market volatility, the outlook for equities remains constructive. While risks warrant close monitoring, periods of uncertainty often create investment opportunities. Two key factors support this view. First, economic and corporate fundamentals remain strong. Taiwan’s export growth and strong commentary from TSMC reinforce the view that the global manufacturing cycle continues to improve, driven largely by the accelerating adoption of AI technologies. Second, earnings expectations across global markets continue to be revised upward, particularly within technology and AI-related sectors. Although some valuation measures appear stretched, price-to-earnings ratios remain reasonable, with AI beneficiaries such as Taiwan, South Korea, Japan and the US experiencing justified structural re-ratings supported by robust earnings growth.
#EquityOutlook #GlobalMarkets #AIAdoption #TechEarnings #MarketOpportunities #TSMC #TaiwanExports #StructuralReRating #InvestingInsights #GeopoliticsAndMarkets
20
Overview of the US Treasuries Market
Fixed income markets as investors confront rising inflation, geopolitical instability, elevated fiscal deficits and the prospect of a prolonged higher-for-longer interest rate environment. While US Treasuries remain the world’s dominant reserve asset, growing volatility and concerns around long-term debt sustainability are increasingly reshaping global capital flows and sovereign bond demand.
#FixedIncomeMarkets #GlobalCapitalFlows #RisingInflation #GeopoliticalInstability #FiscalDeficits #HigherForLonger #USTreasuries #DebtSustainability #BondVolatility #SovereignDemand
8
Overview of the Australian Equities Market
ASX Rallies on Peace Hopes and Cooling Inflation
Australian shares ended a volatile week on a positive note, with investors embracing signs of easing geopolitical tensions in the Middle East and softer domestic inflation data. The S&P/ASX 200 rose 1.6% on Friday to close at 8,731.7, delivering a weekly gain of 0.9% despite ongoing uncertainty surrounding the Persian Gulf conflict.
Market sentiment improved after reports suggested a potential ceasefire extension between the United States and Iran. While investors remain cautious given the fragile nature of any agreement, the prospect of reduced geopolitical risk helped drive a broad-based rally across global and Australian equities. Falling oil prices further supported risk appetite, easing concerns about energy-driven inflation and economic disruption.
The mining sector was the standout performer, rising nearly 3% as gold prices rebounded above US$4,500 an ounce and investors rotated back into commodity-linked stocks. Major miners including BHP and Fortescue gained more than 2%, while copper, battery minerals and rare earth producers also attracted buying interest.Lower oil prices were particularly beneficial for transport and travel-related companies. Qantas and Virgin Australia surged as investors anticipated reduced fuel costs and improved earnings prospects. Consumer discretionary stocks also extended their recent recovery, suggesting growing confidence that households may benefit if inflation pressures continue to moderate.
Financial stocks participated in the rally but remain under scrutiny. Concerns over elevated bank valuations, slowing housing activity and the impact of high interest rates continue to temper enthusiasm for the sector. Meanwhile, real estate stocks posted another solid week as investors increasingly price in the possibility that the Reserve Bank may not need to tighten policy further.
Looking ahead, markets will focus on Australian GDP data, US employment figures and European inflation reports. While investor sentiment has improved, much will depend on whether geopolitical tensions continue to ease and whether inflation remains on a downward trajectory. For now, markets appear willing to look through near-term uncertainty and position for a more constructive second half of 2026.
#ASX200 #AustralianEquities #MarketRally #PeaceHopes #CoolingInflation #MiningSector #CommodityStocks #OilPrices #TravelAndTransport #ConsumerDiscretionary #FinancialStocks #RealEstateMarkets #GlobalEquities #InvestorSentiment #EconomicOutlook
1
14
Overview of the US Equities Market
S&P 500 Extends Historic Rally as Investors Look Beyond Geopolitical Risks
US equities continued their remarkable advance, with the S&P 500 recording its ninth consecutive weekly gain, the longest winning streak since 2023 and one of only a handful of similar runs seen over the past four decades. The rally has been driven by a combination of easing geopolitical concerns and continued strength in corporate earnings, particularly within technology and artificial intelligence-related sectors.
Investor sentiment improved as hopes grew that a ceasefire extension between the United States and Iran could eventually lead to a broader de-escalation of tensions in the Middle East. While uncertainty remains around the final details of any agreement, markets have increasingly priced in a scenario where major disruptions to global energy supplies are avoided. Falling oil prices have reinforced this optimism, helping reduce concerns that energy-driven inflation could force central banks to tighten policy further.
At the same time, the AI investment boom continues to underpin equity markets. Strong earnings and forward guidance from technology companies, including a sharp rally in Dell Technologies, reinforced confidence that demand for AI infrastructure remains robust. Market participants increasingly view AI-related investment as a powerful earnings driver capable of offsetting the economic impact of uncertainty. Bond markets also stabilised during the week, with Treasury yields edging lower as investors reassessed inflation risks following the decline in oil prices. However, concerns remain that inflation could stay above the Federal Reserve’s target, potentially limiting the scope for future interest rate cuts.
The broader message from markets is clear: investors are choosing to focus on resilient corporate earnings, strong economic fundamentals and the transformative potential of AI rather than geopolitical risks. While markets may have already priced in a favourable ceasefire outcome, momentum remains firmly positive. As long as earnings growth continues and energy markets remain stable, risk assets appear well supported despite ongoing global uncertainty.
#SP500 #USEquities #HistoricRally #AIInvestment #TechEarnings #GeopoliticalRisks #OilPrices #BondMarkets #FederalReserve #InvestorSentiment #EconomicFundamentals #CorporateEarnings #AIInfrastructure #MarketMomentum #GlobalMarkets #foresightanalytics
9
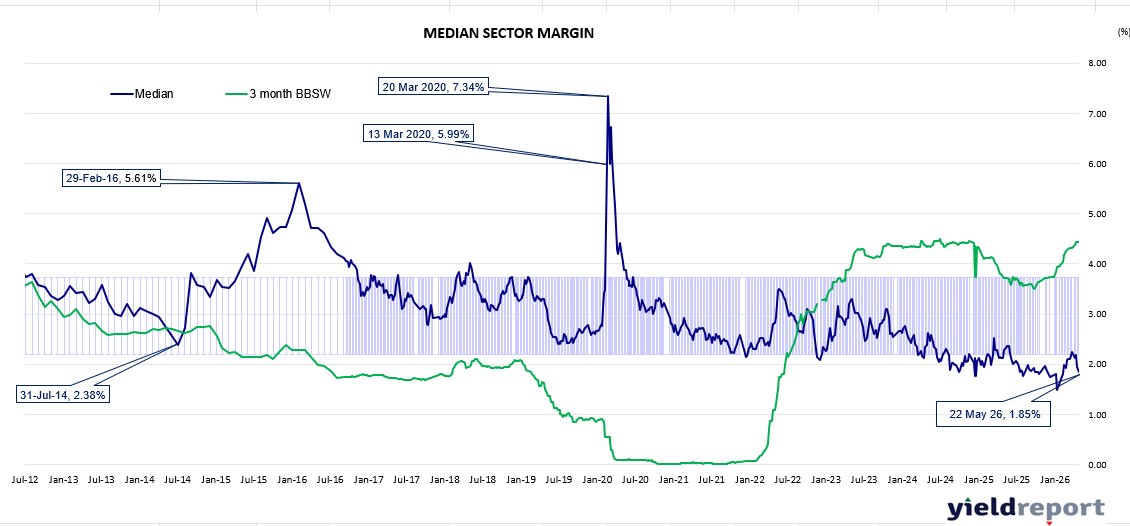
Both the standard and non-standard segments of the ASX hybrid market closed the week ending 22 May 2026 in broadly stable fashion, with income characteristics continuing to underpin investor appetite even as price action remained largely range-bound.
Yield spread remained the market’s most prominent organizing principle. Among non-standard issues, Nufarm (NFNG) retained its position as the highest-yielding name at 10.82%, trailed by Ramsay Health Care (RHCPA) at 9.12%. The standard universe was anchored at its upper end by Judo Capital (JDOPA) at 9.88%, with Latitude (LFSPA) at 9.22% and Macquarie Bank Capital Notes 2 (MBLPC) at 9.01% also standing well clear of the tightly packed major bank cluster a spread differential that continued to attract selective income-oriented positioning.
Read more - zurl.co/istRR
#ASXHybrids #FixedIncome #YieldSpreads #IncomeInvesting #foresightanalytics
9
Weekly overview of Bank Bill Swap Rates
A pronounced divergence characterised Australian short-term and fixed income markets through the week to 22 May 2026, with front-end bank bill rates continuing their measured ascent while the interest rate swap curve pulled back uniformly across all tenors. Rather than a synchronised directional impulse, the period was defined by a split: near-term funding rates grinding higher under the weight of a restrictive policy setting, while swap markets re-priced lower most sharply at the belly, pointing to a reassessment of medium-term rate expectations following recent upward momentum.
Read more - zurl.co/U1M21
#foresightanalytics #BankBillSwaps #FixedIncome #AustralianMarkets #InterestRates
13