
Joined March 2022
- Tweets 34,147
- Following 13
- Followers 3,350
- Likes 38,364
1,560 Photos and videos


Pinned Tweet

Jun 4
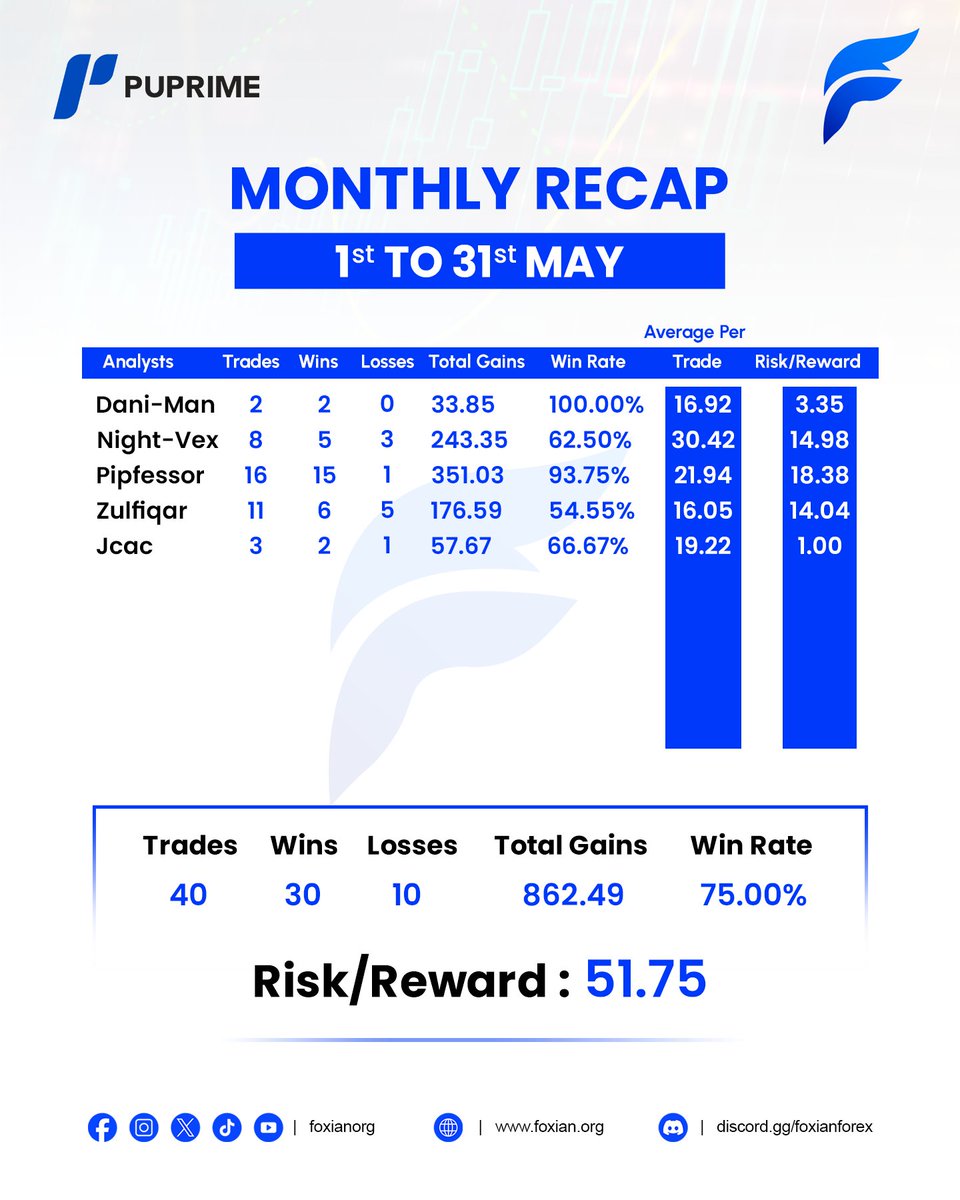
FOXIAN's MAY TRADE RESULTS 📈
CRYPTO: 80% WIN RATE AND 830% UNLEVRAGED GAINS
STOCKS: 92% WIN RATE AND 570% UNLEVRAGED GAINS
FOREX: 75% WIN RATE AND 860 PIPS
📊 Many people say that the market is in a bad state right now and that trading is not possible. Many people make other excuses, but as you can see, our analysts achieved the best results in all areas, Crypto, Forex and Stocks
Join Foxian Now:
discord.gg/foxianorg
45
42
49
4,424
6h
Decent Profit From Our Great Analyst🔝
$MDL Long, clean setup 📈
Entry: $0.3040
SL: $0.2850
one shot, one kill.
6R secured. Discipline > emotions.
Foxian stays locked in ⚡️
Stay locked in ✅️bigger moves loading discord.gg/foxianorg
7
6
11
111
Foxian retweeted

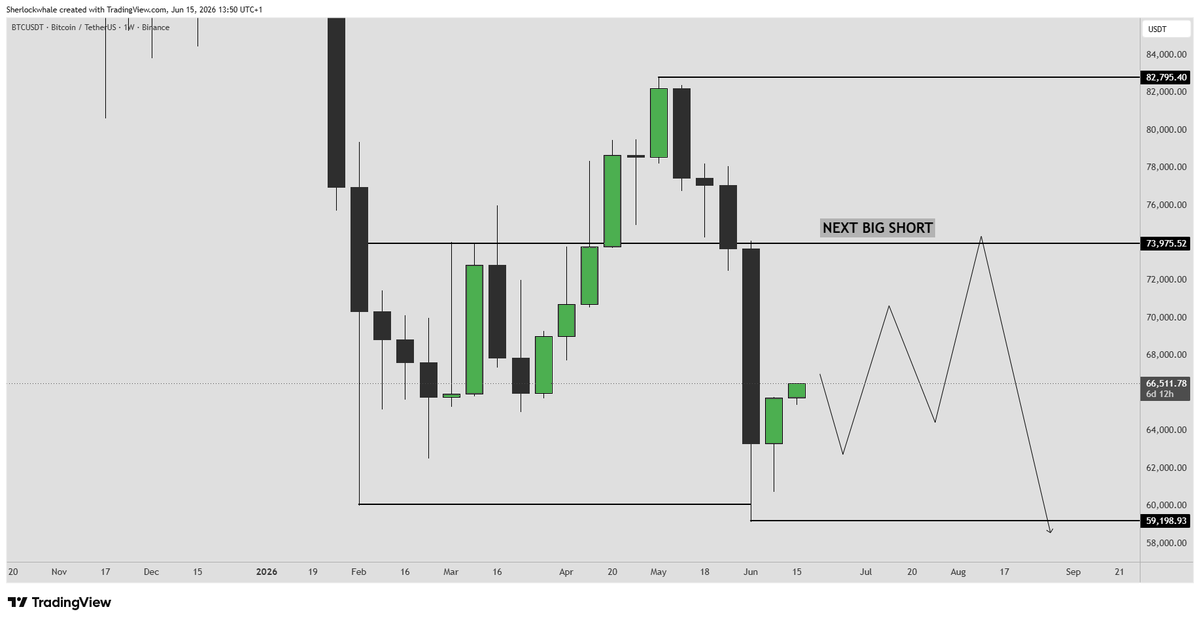
I found an interesting Bullish Bitcoin pattern that is active right now.
Since 2017, whenever BTC printed a huge red weekly candle, followed by a green weekly candle completely trapped inside that red candle, price almost always squeezed higher in the next few weeks.
This has happened 14 times since 2017.
In 13 out of 14 cases, Bitcoin traded at least 12% higher within the next 8 weeks. That is a 92.9% hit rate.
The probability of this happening randomly is around 0.18%, or roughly 1 in 546.
Two weeks ago BTC printed the massive red weekly candle from $73.6K to $63.3K, with the low at $59.1K. Last week BTC printed the green inside candle and closed at $65,746.
A 12% move from that close gives $73,636. In other words, this pattern points almost exactly to the $74K weekly range high.
This does not mean the bear market is over. Actually, it means the opposite.
If Bitcoin squeezes into $74K from here, that is where I think the next major shorting opportunity appears, because that would likely be the sweep of the weekly range high before the bigger move lower.
11
14
84
4,840
Jun 13
Why Most Traders Lose:✔️
• Poor risk management
• Emotional decisions (fear & greed)
• Overtrading
• No clear plan or edge
• Using too much leverage
The biggest killers are emotions and poor risk management. 📉
We handle the risk, you focus on the profits✨️
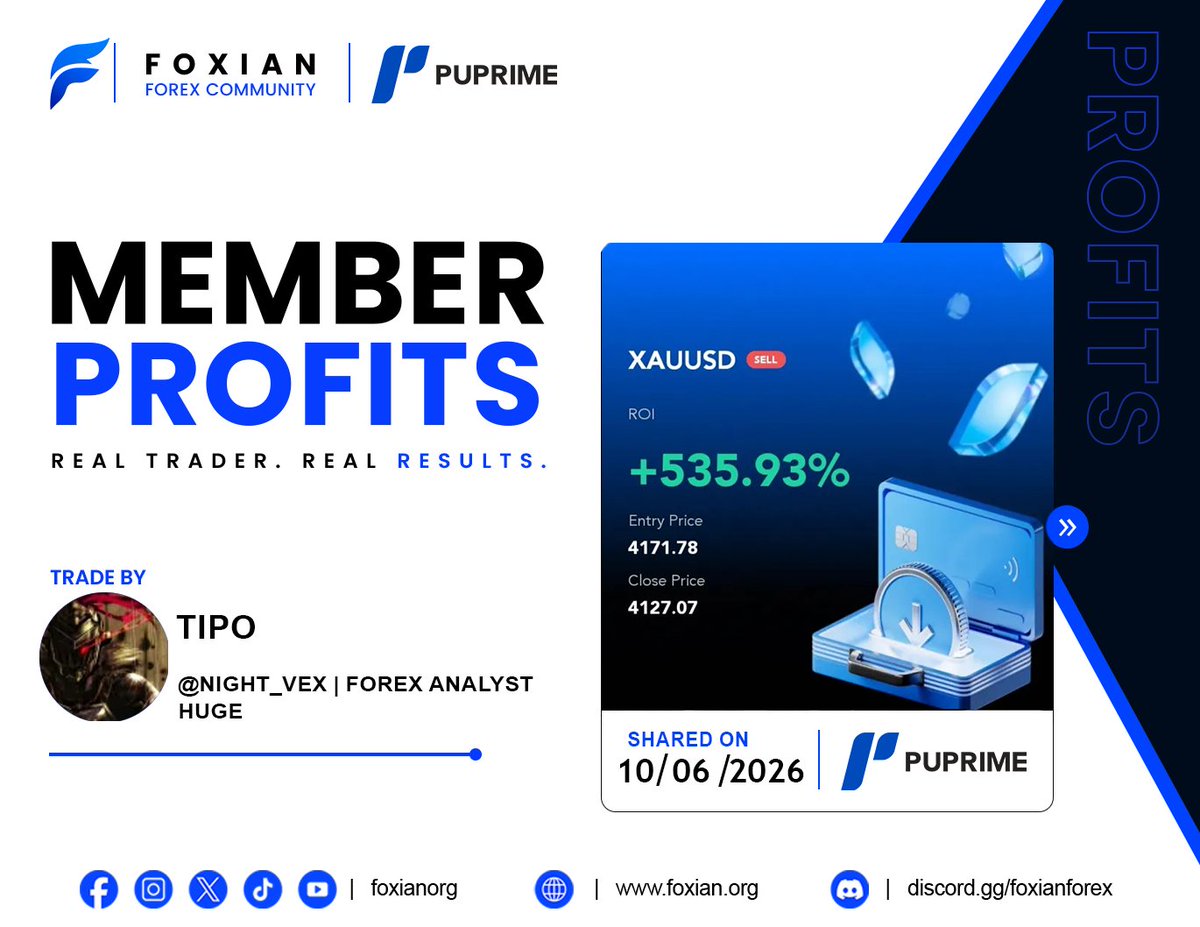
Forex Community Is On Fire 🔥
$XAUUSD 535.93% 📉
Awesome analysis from the genius @_Night_Vex_ 🔝 and a sweet move from Tipo 🔥
Don't miss the next move discord.gg/foxianforex
8
6
17
287
Jun 12
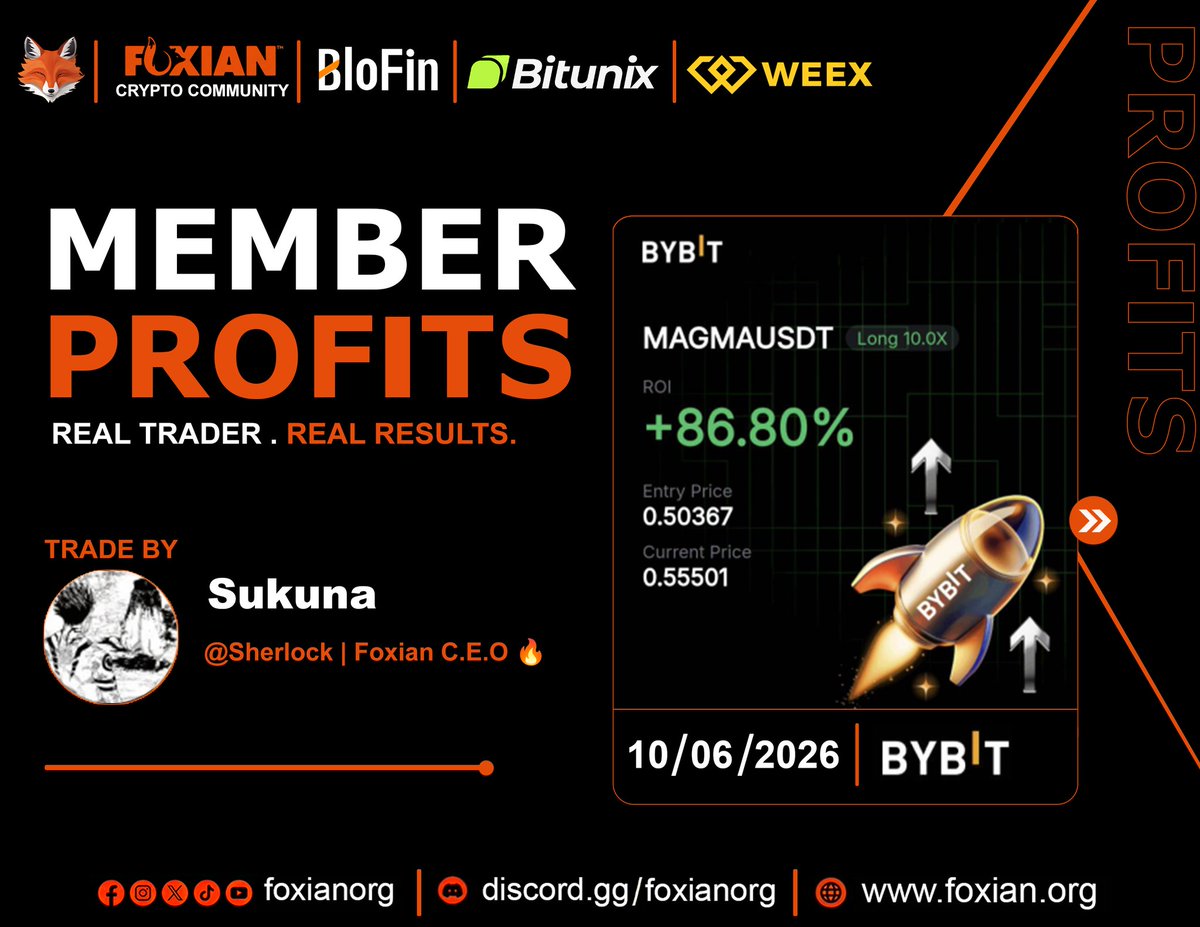
𝗙𝗿𝗲𝘀𝗵 𝗼𝗳𝗳 𝘃𝗮𝗰𝗮𝘁𝗶𝗼𝗻 𝗮𝗻𝗱 𝗮𝗹𝗿𝗲𝗮𝗱𝘆 𝗽𝗿𝗶𝗻𝘁𝗶𝗻𝗴 𝘄𝗶𝗻𝘀.🔥
@Sherlockwhale IS ON FIRE 🌟
$MAGMAUSDT LONG ✅️ 86.80%
Entry => 050367
Current Price => 055501
JOIN THE WINNING SQUAD discord.gg/foxianorg
7
4
11
191
Foxian retweeted
Jun 10
🚨 NEW EDUCATIONAL ARTICLES NOW LIVE ON FOXIAN WEBSITE
• How to Protect Your Crypto Portfolio During Rising Geopolitical Risk 📊
This is a complete educational guide for all traders on how to protect funds and manage risk during uncertain market conditions.
Learn how geopolitical events impact crypto volatility and how to avoid emotional trading.📚
All articles are free for all members.
LINK HERE 👇
foxian.org/how-to-protect-yo…
6
6
10
361
Jun 9
Foxian's New Weekly Report Uploaded On Website (30 MAY - 5 JUNE )
Still Not receiving it? Subscribe/Register your Email at The Bottom of Foxian.org and Receive all by free
To read the latest report, check the link below 👇
🔗foxian.org/crypto-reports/
6
4
11
229
Jun 9
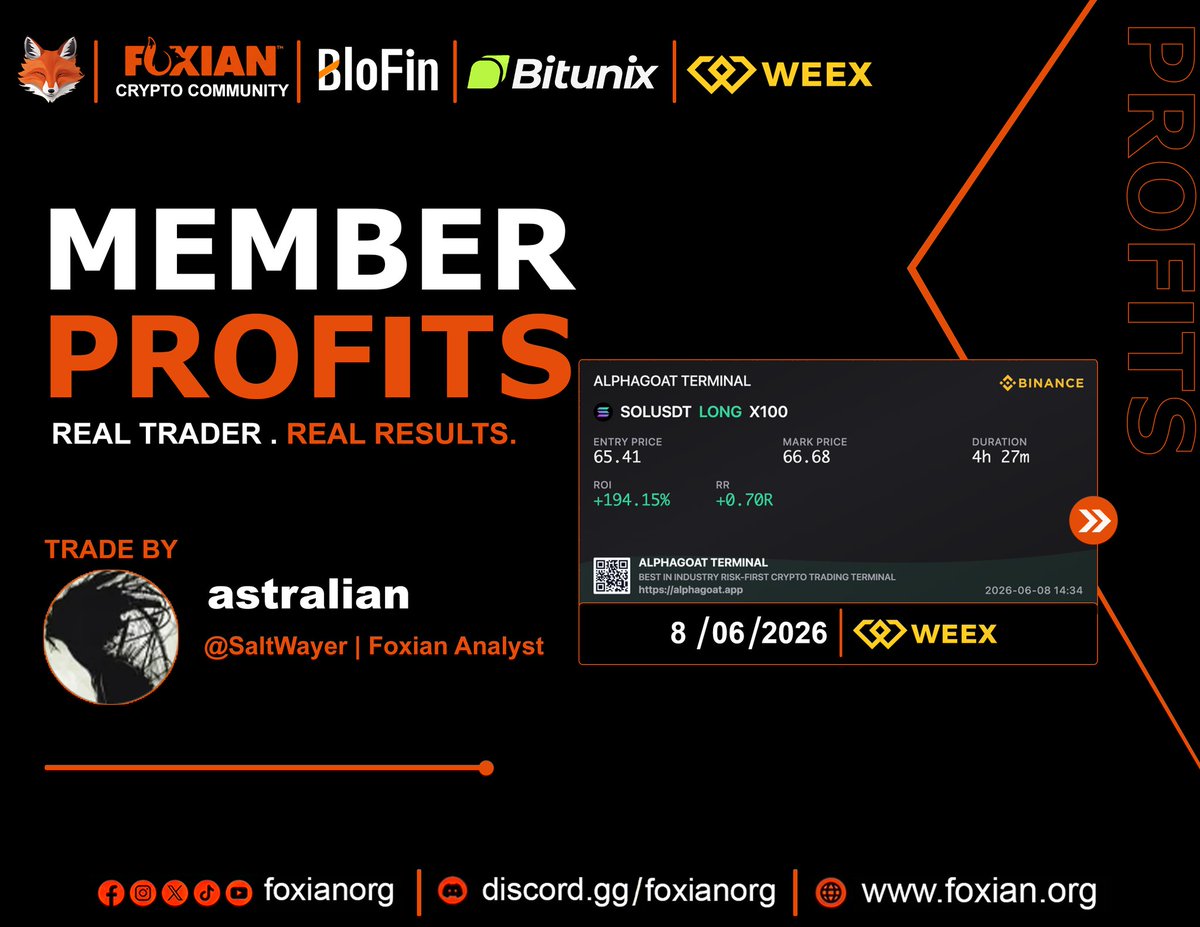
🔥 𝗔𝗻𝗼𝘁𝗵𝗲𝗿 𝗰𝗹𝗲𝗮𝗻 𝗵𝗶𝘁 𝗳𝗿𝗼𝗺 𝗦𝗮𝗹𝘁𝗪𝗮𝘆𝗲𝗿
$SOLUSDT LONG x100 📍 Entry: 65.41 🎯 Exit/Mark Price: 66.68 ⏱ Trade Duration: 4h 27m
Big respect to @Saltwayer_ for delivering yet another high-quality trade for the Foxian community. 🦊🚀
Join the winning side ➡️ discord.gg/foxianorg
7
4
13
281
Jun 6
𝗚𝗼𝗹𝗱 𝗴𝗼𝘁 𝗵𝘂𝗻𝘁𝗲𝗱🏅🎯
Another member win from the Foxian Forex server
✅ XAUUSD SELL
✅ Entry: 4454.71
✅ Close: 4439.43
✅ ROI: 171.42%
Big respect to @mr_pipfessor for another quality setup. This is the level of analysis our members get access to every day🚀
Join the movement For 💯 FREE discord.gg/foxianforex
7
5
13
378
Jun 4
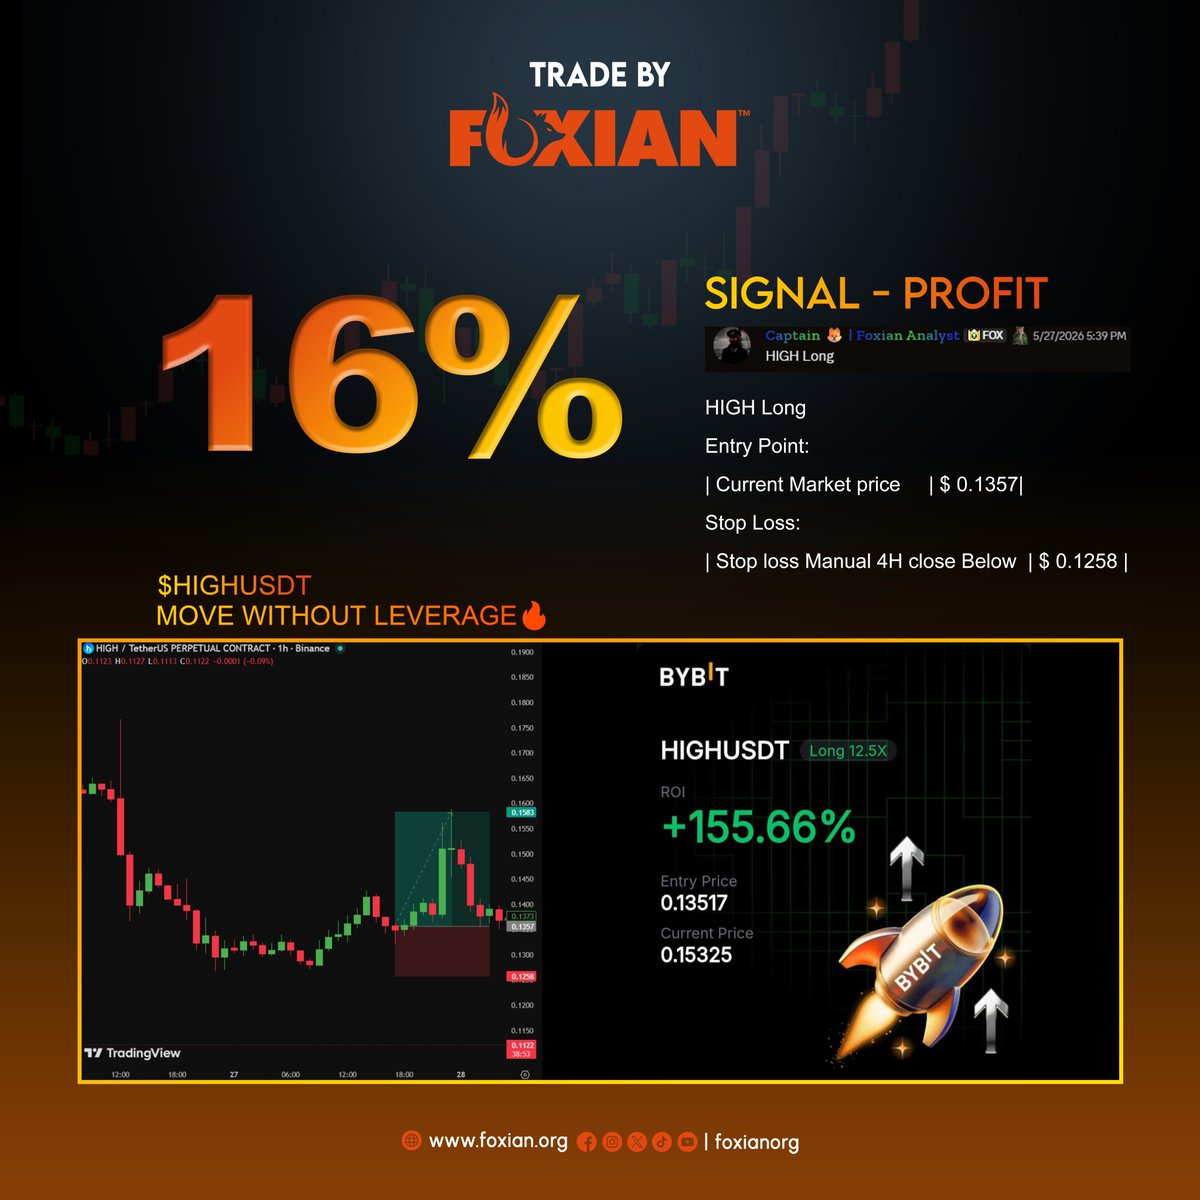
🦊✈️ 𝗙𝗼𝘅𝗶𝗮𝗻 𝗙𝗹𝗶𝗴𝗵𝘁 $𝗛𝗜𝗚𝗛𝗨𝗦𝗗𝗧 𝗵𝗮𝘀 𝗼𝗳𝗳𝗶𝗰𝗶𝗮𝗹𝗹𝘆 𝗹𝗮𝗻𝗱𝗲𝗱.
@CaptainCypto called the route.
📈 Foxian cleared for takeoff.
🎯 Entry: 0.13517
🛡️ Stop Loss: 0.1258
📈 Destination: Profit Zone
$HIGHUSDT reached cruising altitude with a clean 16% spot move and over 155% ROI on leverage
Fasten your seatbelts, we're flying profit class ➡️ discord.gg/foxianorg
5
3
11
302
Jun 2
Foxian's New Weekly Report Uploaded On Website
NEW WEEK, NEW WEEKLY REPORT, THIS IS FOXIAN
🎁For Free Members:You can now also read and download all latest and previous reports directly on our website
📩Still not receiving it? Subscribe/Register your Email at The Bottom of Foxian.org and Receive all by free
For reading The last one, check the Link below 👇
🔗foxian.org/crypto-reports
3
3
6
167
Foxian retweeted
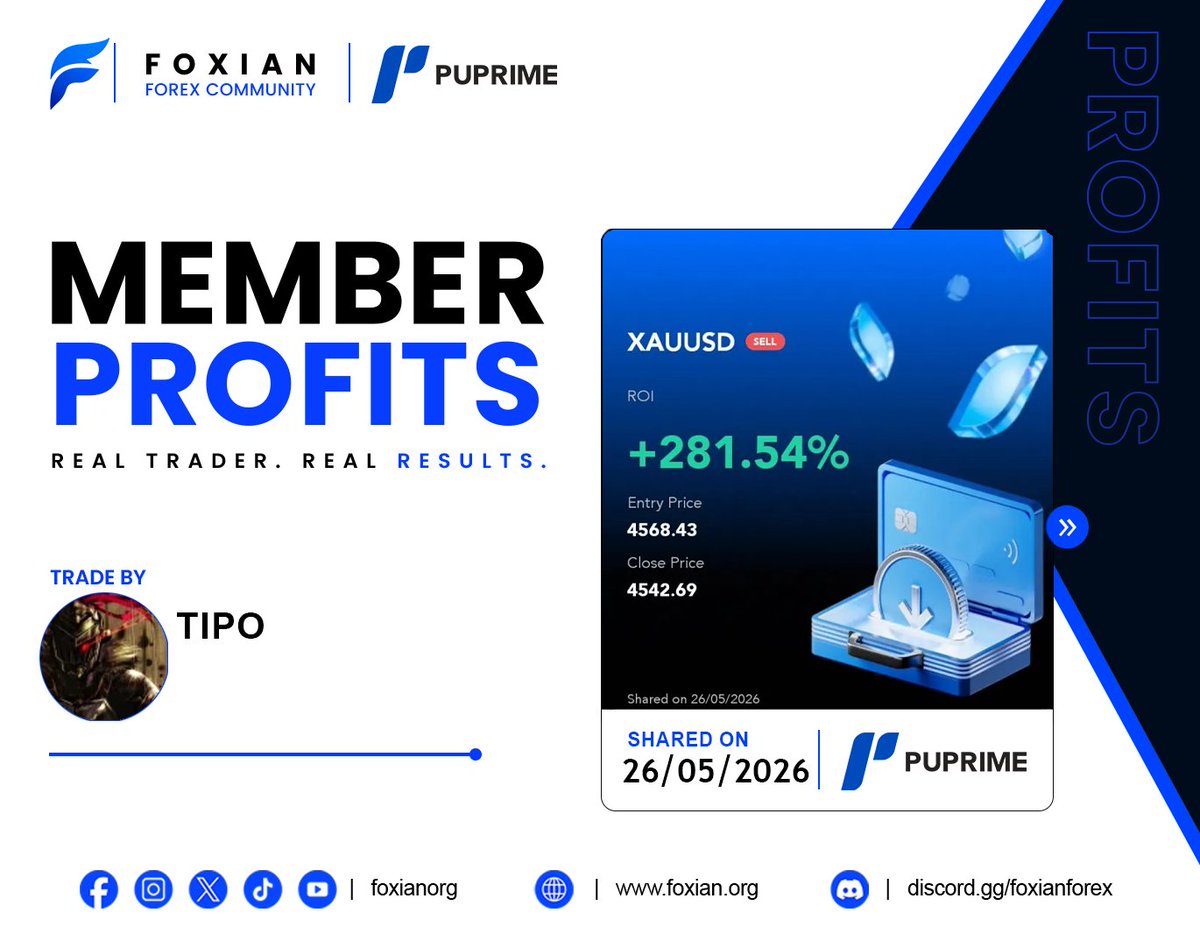
Jun 1
Just another day inside Foxian Forex. 🚀🦊
Gold sold. Profit secured.
📈 281.54% ROI on XAUUSD
Think you’re ready to level up your trading game? Join the pack
discord.gg/foxianforex
6
4
12
324
May 30
🔥NEW ARTICLES PUBLISHED🔥
Two new articles are now live on the Foxian website.
1⃣ Whats Wallet Tracking Actually Tells You (And What It Doesn't):
Every serious trader in 2026 has a watchlist, an alert system, and at least one paid analytics dashboard, this article is for you.
2⃣ How Crypto Became a Weapon in Modern Financial Warfare:
Complete Guide How Crypto Became a Weapon in Modern Financial Warfare Governments, rogue states, terror groups and ordinary citizens are all using the same blockchain rails - for very different reasons.
Both articles are free to read for all members
Here are the links to both articles. 👇
🔗foxian.org/whats-wallet-trac…
🔗foxian.org/how-crypto-became…

8
7
10
443
May 30
🛫 Captain called the route, we just followed the flight plan
$HIGHUSDT took off perfectly and the foxes landed safely in profit. 📈🦊
Respect to @Captain for another smooth flight through the charts
Join The Winning Side = discord.gg/foxianorg
6
4
9
313
May 28
Foxes keep cooking while the market keeps paying out 🦊📈
Another clean short by Fefe on $VVVUSDT , precision entry, smooth execution,
Solid ROI.✅️
25x leverage.
14.38% secured.
Real traders. Real results
Join The Winning Side discord.gg/foxianorg
6
4
10
283
May 27
EID MUBARAK TO ALL🌙
-------------------------------
Wishing you a blessed Eid. May this Eid bring new opportunities, growth, and happiness into your life ♥️
May your home be filled with peace, goodness, and calm
Foxian wishes you a joyful heart, peace of mind, and good health this Eid and always ✨
8
4
12
291
May 25
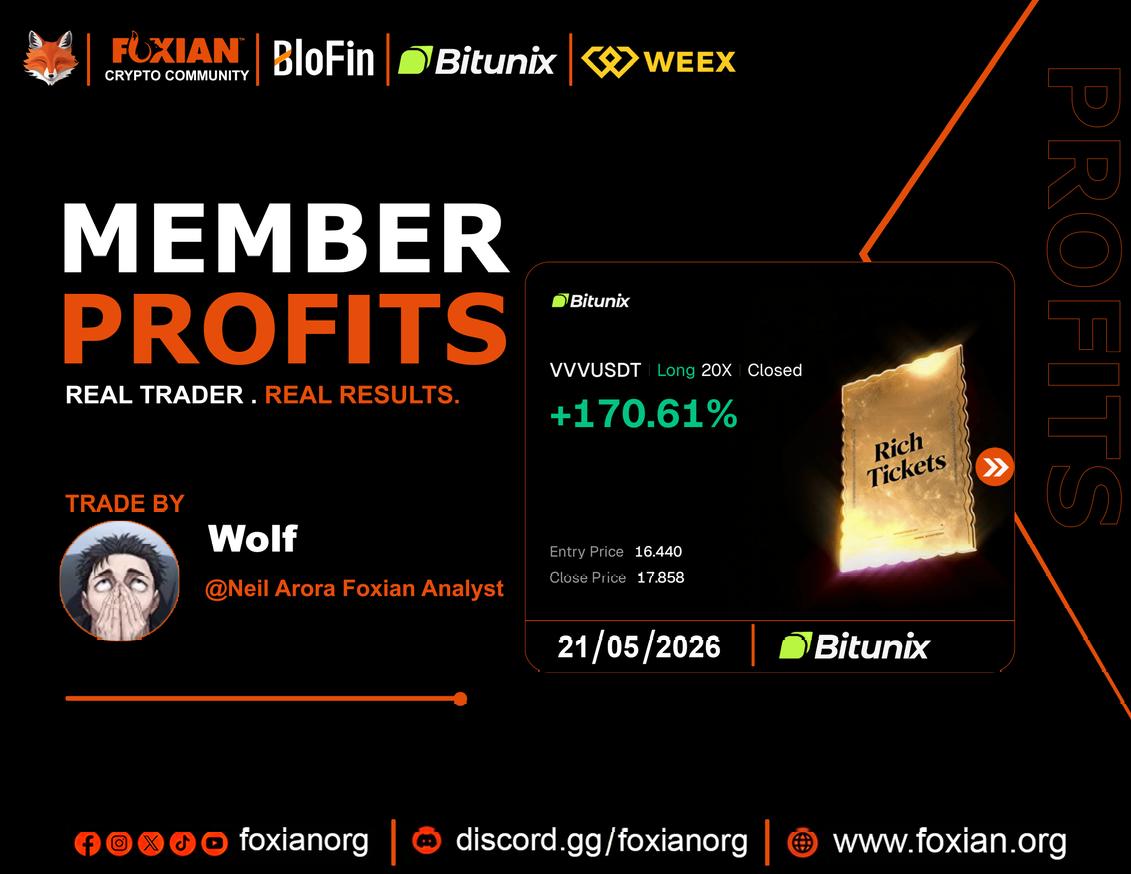
𝗪𝗮𝗻𝗻𝗮 𝗴𝗿𝗮𝗯 𝘁𝗵𝗲 𝗥𝗶𝗰𝗵 𝘁𝗶𝗰𝗸𝗲𝘁? 🎟️
𝗢𝗻𝗹𝘆 𝘄𝗮𝘆 𝗶𝗻 𝗶𝘀 𝗷𝗼𝗶𝗻𝗶𝗻𝗴 𝘁𝗵𝗲 𝗙𝗼𝘅𝗶𝗮𝗻 𝗣𝗿𝗲𝗺𝗶𝘂𝗺𝘀 𝗮𝗻𝗱 𝘀𝘁𝗮𝗰𝗸𝗶𝗻𝗴 𝗷𝘂𝗶𝗰𝘆 𝗽𝗿𝗼𝗳𝗶𝘁𝘀 𝗲𝘃𝗲𝗿𝘆 𝘀𝗶𝗻𝗴𝗹𝗲 𝗱𝗮𝘆🦊
$VVV 170.61% 🔥
Entry > 16.440
Close Price > 17.858
Join The Winning Side = discord.gg/foxianorg
2
4
9
215
May 23
𝗙𝗼𝘅𝗲𝘀 𝗿𝗲𝗮𝗹𝗹𝘆 𝗼𝘂𝘁 𝗵𝗲𝗿𝗲 𝘁𝘂𝗿𝗻𝗶𝗻𝗴 𝗰𝗹𝗲𝗮𝗻 𝘀𝗲𝘁𝘂𝗽𝘀 𝗶𝗻𝘁𝗼 𝗰𝗿𝗮𝘇𝘆 𝗥𝗢𝗜 🦊📈
Caught the $XAUUSD move from 4657.00 and closed around 4676.53
Clean confirmation, precise execution, and the foxes secured another 419% ROI 🦊
Join the movement discord.gg/foxianforex

2
4
9
207