
highly performative computing
Joined December 2017
- Tweets 1,242
- Following 313
- Followers 201
- Likes 576
214 Photos and videos


thom✨ retweeted

Jun 13
europe just got out regulated while they were sleeping
24
44
1,353
38,787

21h
perfect spot to write b200 QR decomposition kernels for the new gpu mode leaderboard
5
48


Jun 12
47/100 of GPU Grind
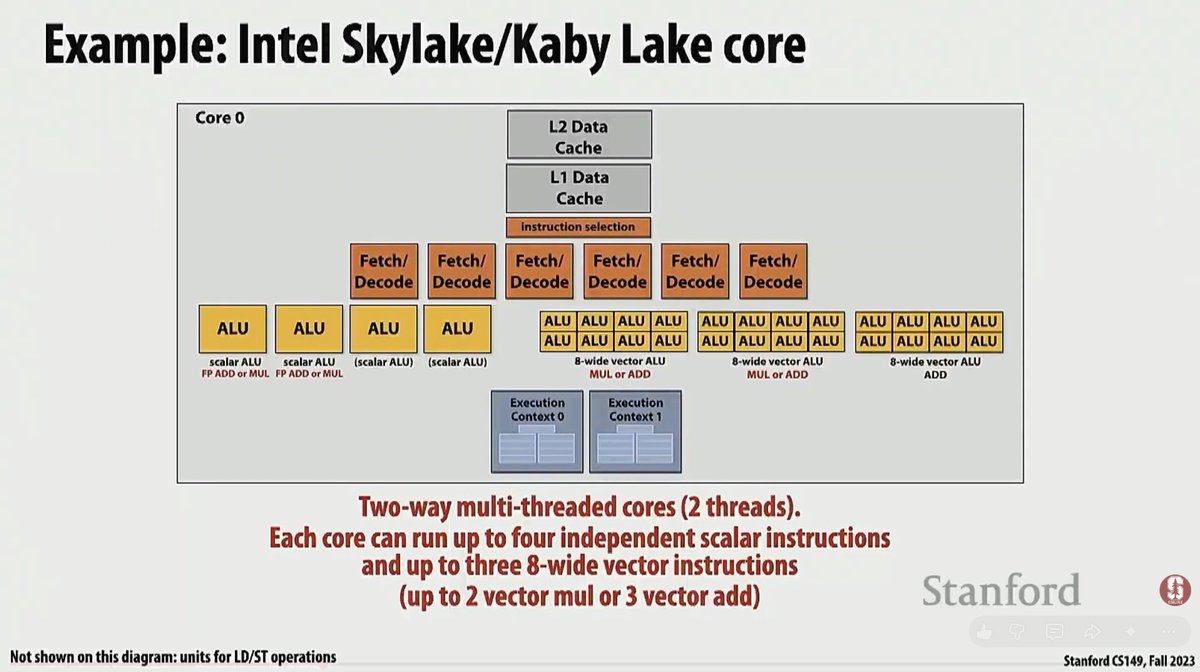
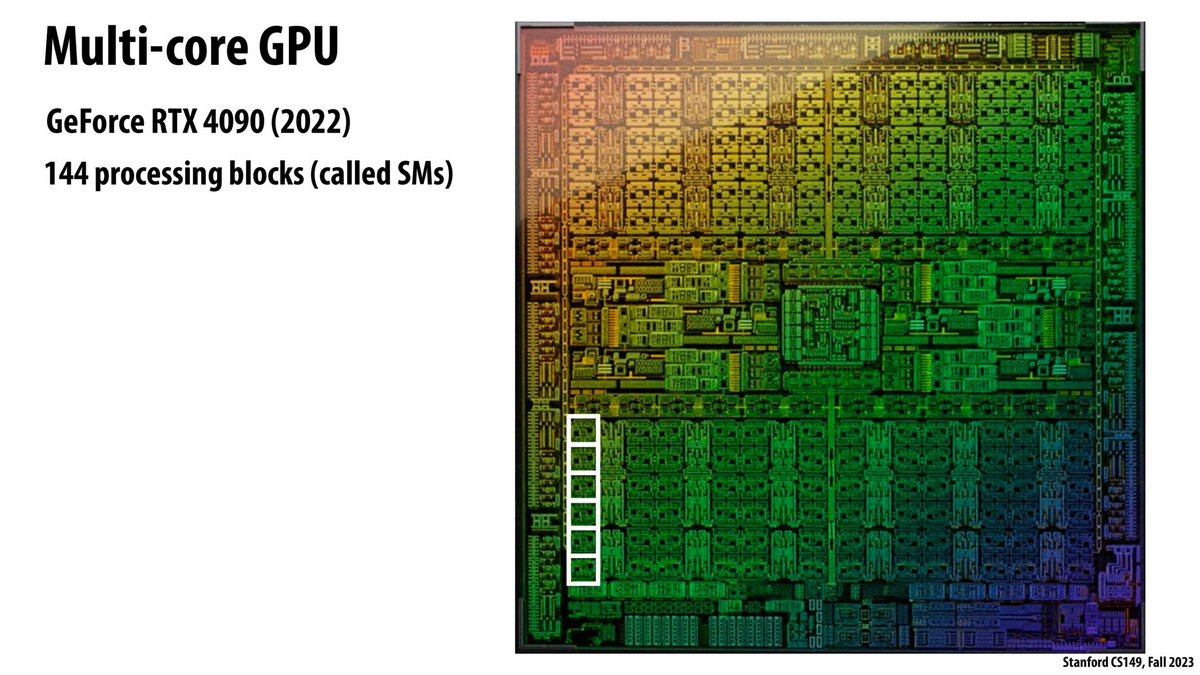
following stanford cs149 with lecture 3, covering cpu multithreading to hide stalls and maximise core utilization, the example of Intel Kaby-Lake cpu with superscalar core in which multiple instructions can run per clock cycle. Also covering heterogeneous superscalar cores (with scalar and SIMD ALUs) that can run in the same clock cycle
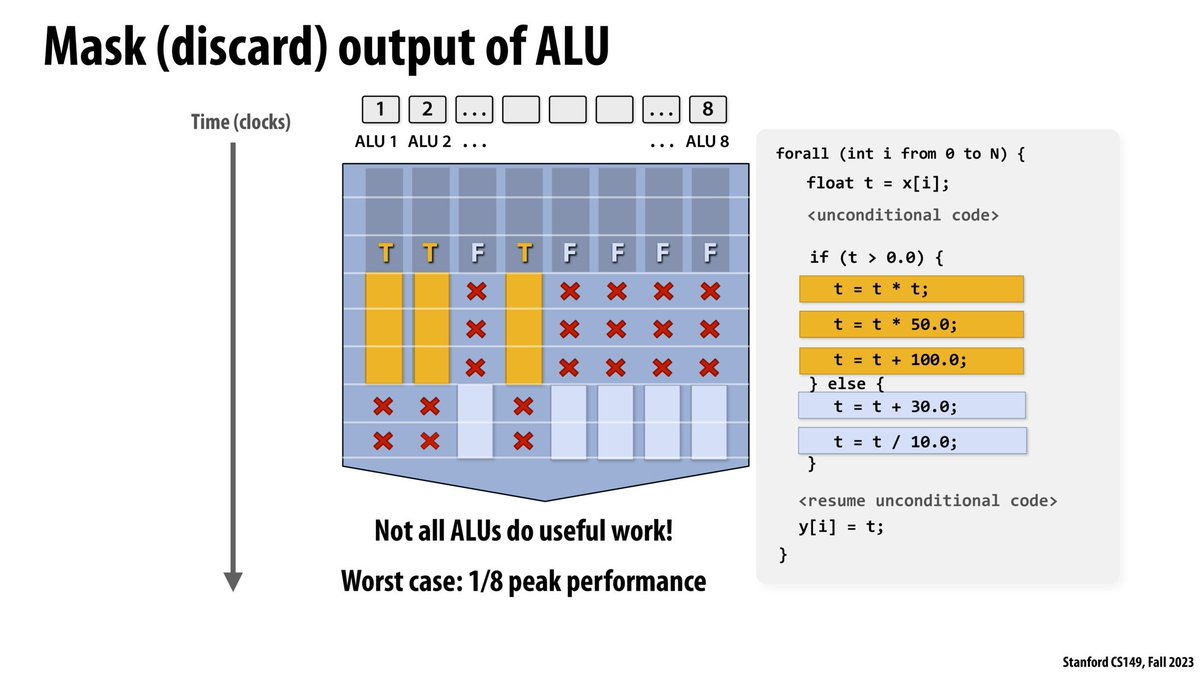
also covering GPU SIMT with a simplified explanation of warps and warp divergence
i love re-watching a course about "beginner" concepts of HPC and see how it is explained by different professors, the laundry pipelining analogy was funny 😆


Jun 8

46/100 of GPU Grind
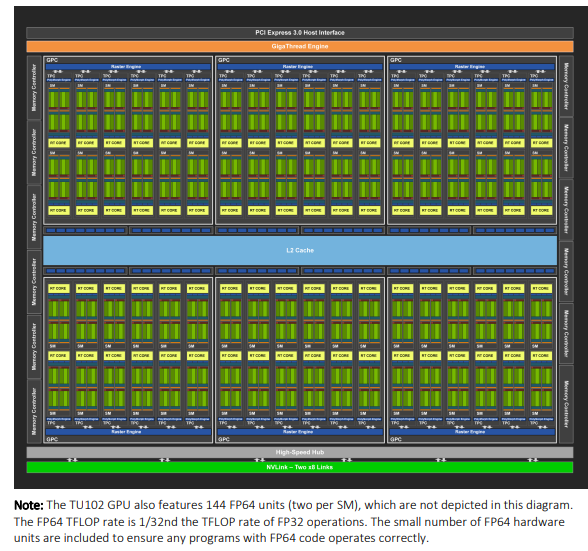
starting to work on a fp16 gemm kernel, playing with the __half api for now, all intrinsics it feels like i'm writing avx512 but in a cuda program. i'm setting up all the reference computations etc, and i was surprised to see the difference between fp64 flops and fp16 flops (i run it on a 2060 for now, going to run it on ampere ultimately to be able to use more features).
like the fp64 to fp16 ratio for cuBLAS gemms is 1/36, which is not even that much considering the hardware peak of fp64 is 1/32 of fp32 which is 1/2 of fp16, it's just that i forgot the chip had that few fp64 cores. the way they say it in the whitepaper is literally "we just included bare minimum fp64 cores so that fp64 program can run correctly". i knew that at some point but i forgot and was still surprised 😅

1
22
926
thom✨ retweeted

Jun 9
They didn’t mean pause AI research, they meant pause *your* AI research
50
347
5,036
103,700
Jun 8
46/100 of GPU Grind
starting to work on a fp16 gemm kernel, playing with the __half api for now, all intrinsics it feels like i'm writing avx512 but in a cuda program. i'm setting up all the reference computations etc, and i was surprised to see the difference between fp64 flops and fp16 flops (i run it on a 2060 for now, going to run it on ampere ultimately to be able to use more features).
like the fp64 to fp16 ratio for cuBLAS gemms is 1/36, which is not even that much considering the hardware peak of fp64 is 1/32 of fp32 which is 1/2 of fp16, it's just that i forgot the chip had that few fp64 cores. the way they say it in the whitepaper is literally "we just included bare minimum fp64 cores so that fp64 program can run correctly". i knew that at some point but i forgot and was still surprised 😅
Jun 7
45/100 of GPU Grind
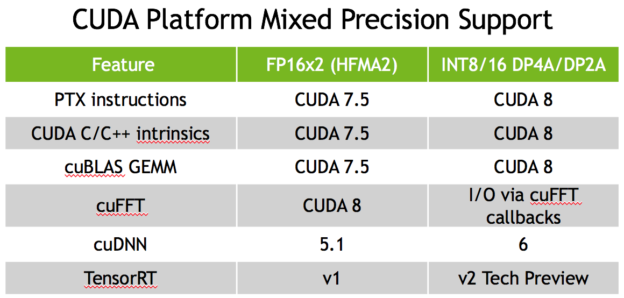
reading more about quantization today, different datatypes etc, the idea of going from fp32 to fp16 then to fp8 or even fp4 is quite simple, it’s gonna be interesting to see how its implemented though; since these are not datatypes that are necessarily natively supported in c/c
i didnt know fp8 was only supported since hopper, i think i’m going to work on a fp16 ampere hgemm first to play with the fp16 api, and then maybe a fp8 one on hopper which would also allow me to explore all the new hopper features
2
1,036
Jun 7
45/100 of GPU Grind
reading more about quantization today, different datatypes etc, the idea of going from fp32 to fp16 then to fp8 or even fp4 is quite simple, it’s gonna be interesting to see how its implemented though; since these are not datatypes that are necessarily natively supported in c/c
i didnt know fp8 was only supported since hopper, i think i’m going to work on a fp16 ampere hgemm first to play with the fp16 api, and then maybe a fp8 one on hopper which would also allow me to explore all the new hopper features
Jun 6
43-44/100 of GPU Grind
been working on a routines library, kinda BLAS-like except that i just put the routines im interested in, which means some that are not part of BLAS, and i dont necessarily implement all the transpose variants etc; its mostly just to group most of my kernel work in a single project.
its not directly about kernels but it’s getting closer to something production-ready than just a bunch of separated projects with duplicated code, and im making progress in cpp! also it takes time now but it should allow me to be faster the next times i want to work on a new routine
1
8
595
thom✨ retweeted

they gonna make jensen a idol soon and put him in a boy band
4
3
107
7,329
thom✨ retweeted

Same guy btw


138
904
12,809
1,032,372
Jun 6
43-44/100 of GPU Grind
been working on a routines library, kinda BLAS-like except that i just put the routines im interested in, which means some that are not part of BLAS, and i dont necessarily implement all the transpose variants etc; its mostly just to group most of my kernel work in a single project.
its not directly about kernels but it’s getting closer to something production-ready than just a bunch of separated projects with duplicated code, and im making progress in cpp! also it takes time now but it should allow me to be faster the next times i want to work on a new routine
Jun 3
42/100 of GPU Grind
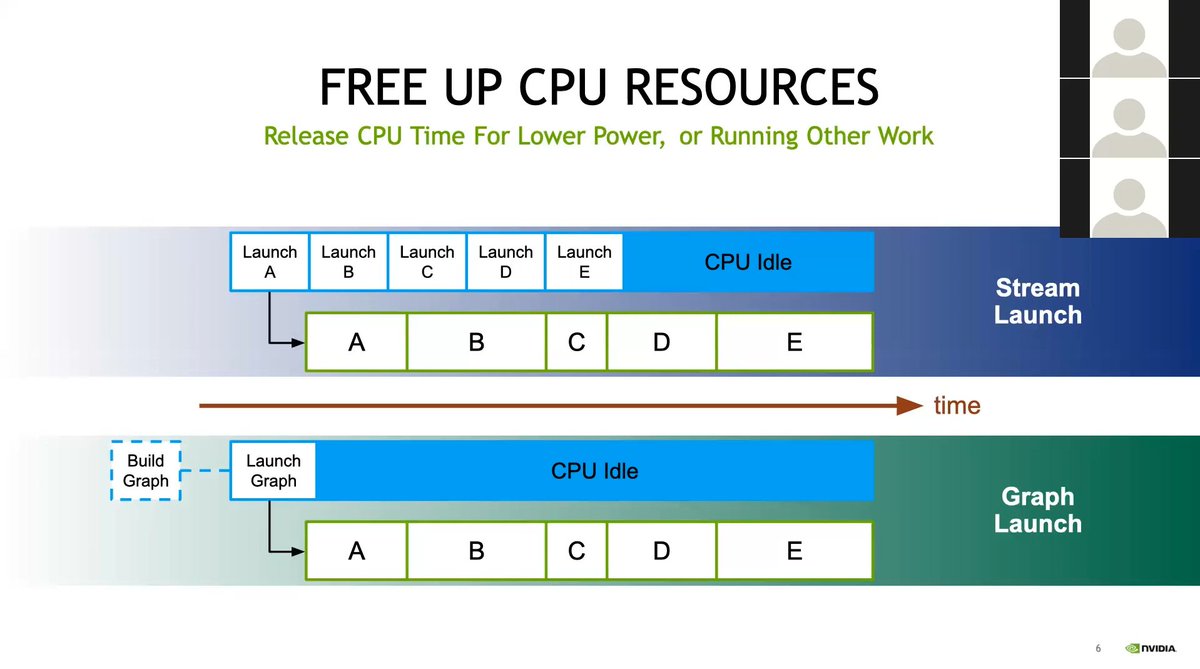
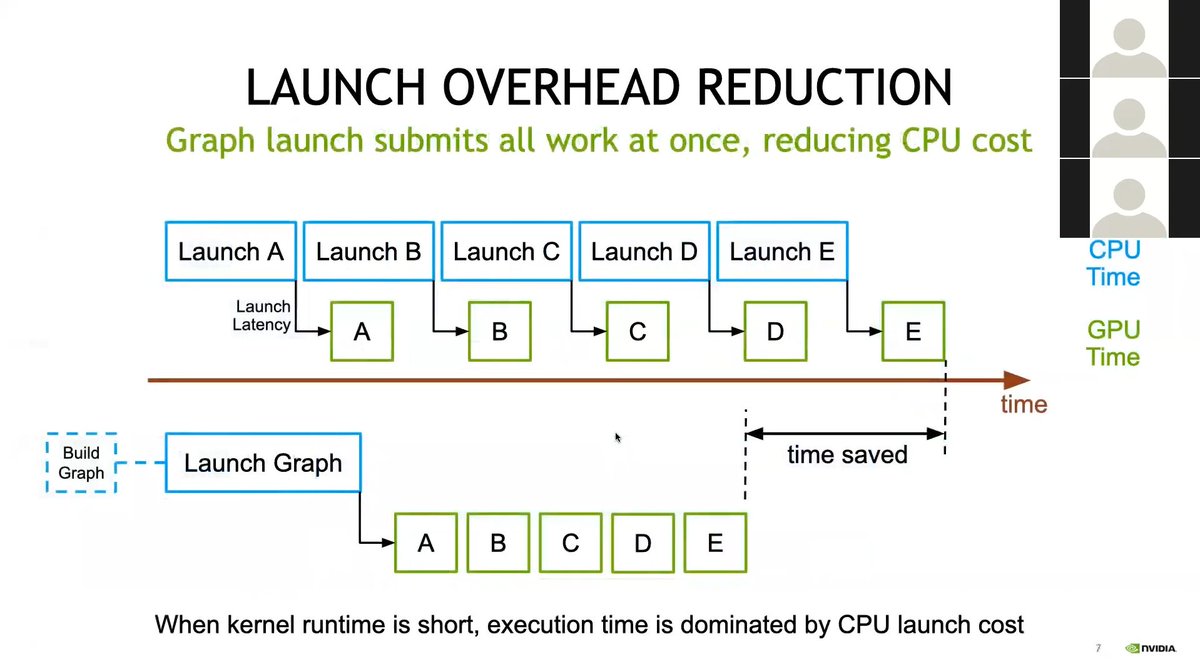
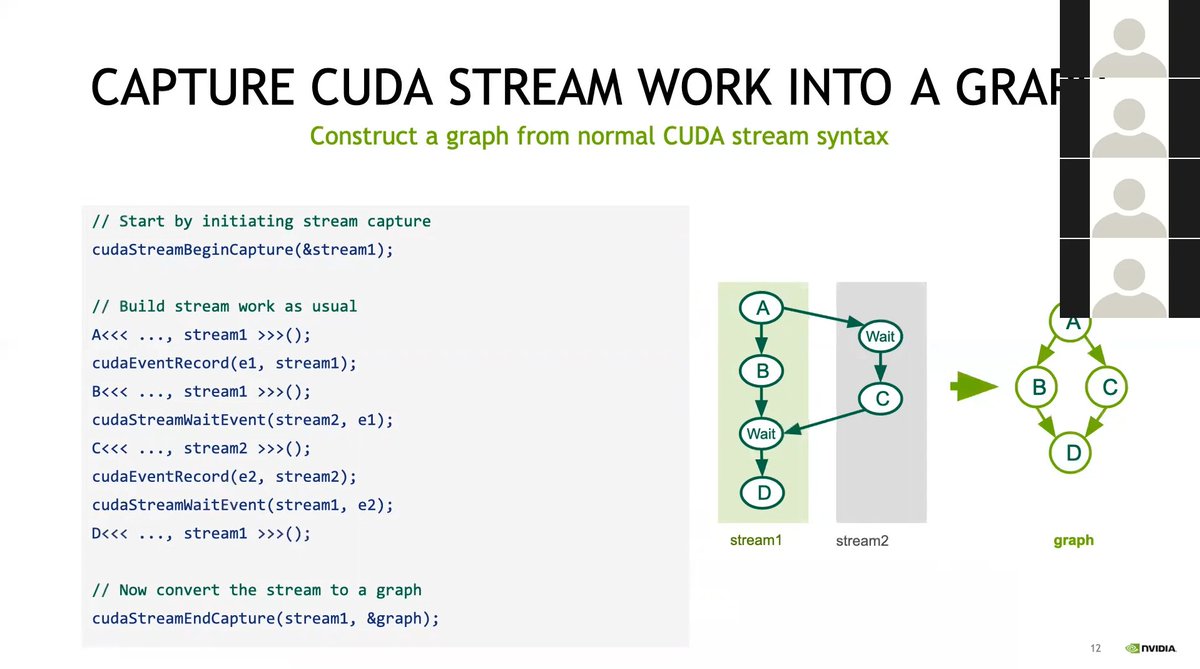
ran into some code with cuda graphs today and as i wasn't familiar enough with it i looked for some resources and found a lecture given for a oak ridge training series, by nvidia employees
straight to the point, explaining clearly the point of using cuda graphs to reduce cpu launch overhead, and how to create one using either stream capture or by describing them manually (or mixing both!)
1
6
786
Jun 3
42/100 of GPU Grind
ran into some code with cuda graphs today and as i wasn't familiar enough with it i looked for some resources and found a lecture given for a oak ridge training series, by nvidia employees
straight to the point, explaining clearly the point of using cuda graphs to reduce cpu launch overhead, and how to create one using either stream capture or by describing them manually (or mixing both!)
May 31
41/100 of GPU Grind
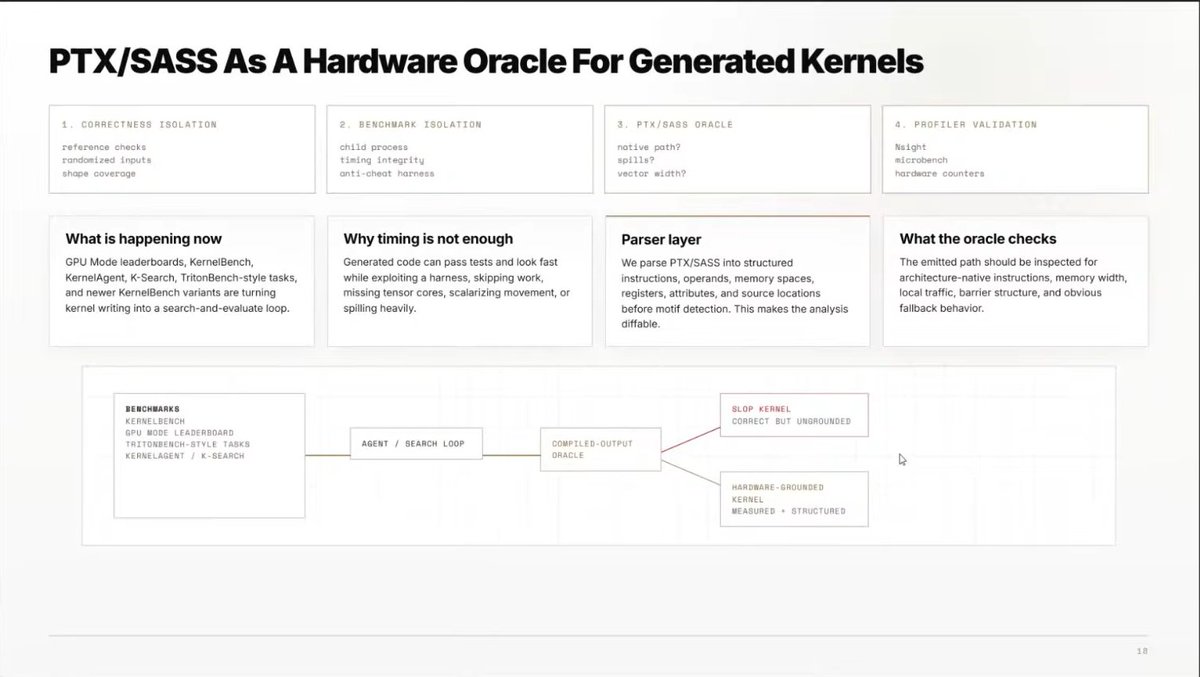
watched yesterday GPU mode's lecture on PTX/SASS from Gestwell founders ; some insights on ptx and sass behaviors, and how to read it. i think one of the speakers even said he looked more at the generated ptx than the profiler when writing a kernel, found that surprising at first but i guess when you have enough expertise with ptx that makes sense, you directly understand how things are going to be from the ptx.
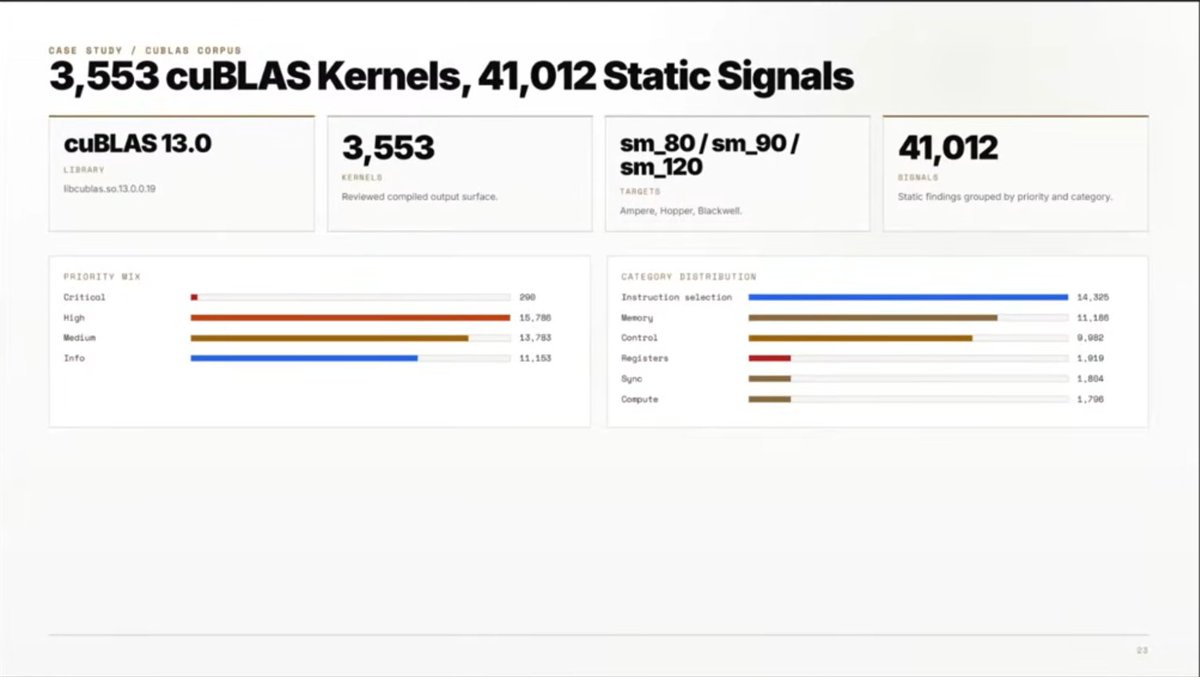
they presented a tool they created to analyze generated PTX and compare it to what you would expect for a given algorithm for a given compute capability, it flags unexpected behaviors and you can review it manually. i thought it didn't make much sense on their first example, failed to see how you couldn't have drawn the same conclusion from looking at cpp source code, but for larger libraries to analyze a lot of compiled kernels at once, it looked super cool ! they ran it on cuBLAS (3553 kernels), and got 41k signals organized by priority etc, i guess such a tool would be useful for cuBLAS developers for example (if the signals are actually interesting)

350
May 31
41/100 of GPU Grind
watched yesterday GPU mode's lecture on PTX/SASS from Gestwell founders ; some insights on ptx and sass behaviors, and how to read it. i think one of the speakers even said he looked more at the generated ptx than the profiler when writing a kernel, found that surprising at first but i guess when you have enough expertise with ptx that makes sense, you directly understand how things are going to be from the ptx.
they presented a tool they created to analyze generated PTX and compare it to what you would expect for a given algorithm for a given compute capability, it flags unexpected behaviors and you can review it manually. i thought it didn't make much sense on their first example, failed to see how you couldn't have drawn the same conclusion from looking at cpp source code, but for larger libraries to analyze a lot of compiled kernels at once, it looked super cool ! they ran it on cuBLAS (3553 kernels), and got 41k signals organized by priority etc, i guess such a tool would be useful for cuBLAS developers for example (if the signals are actually interesting)
May 30
40/100 of GPU Grind
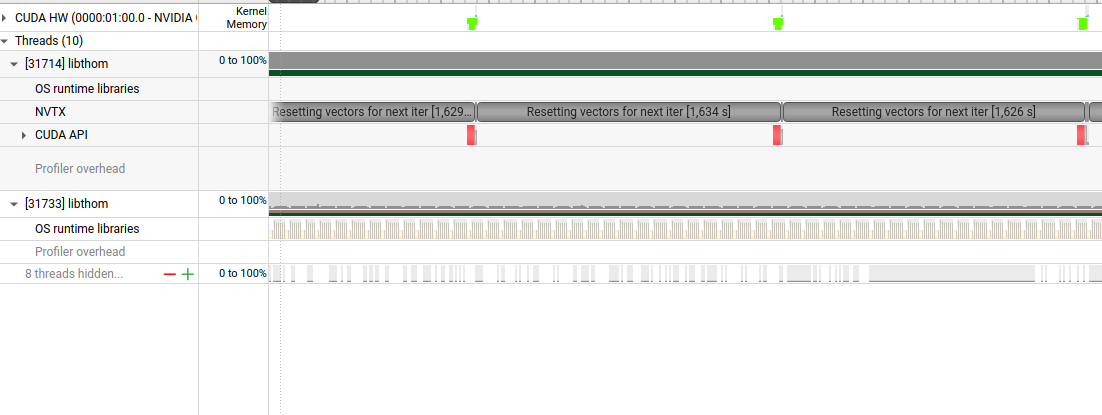
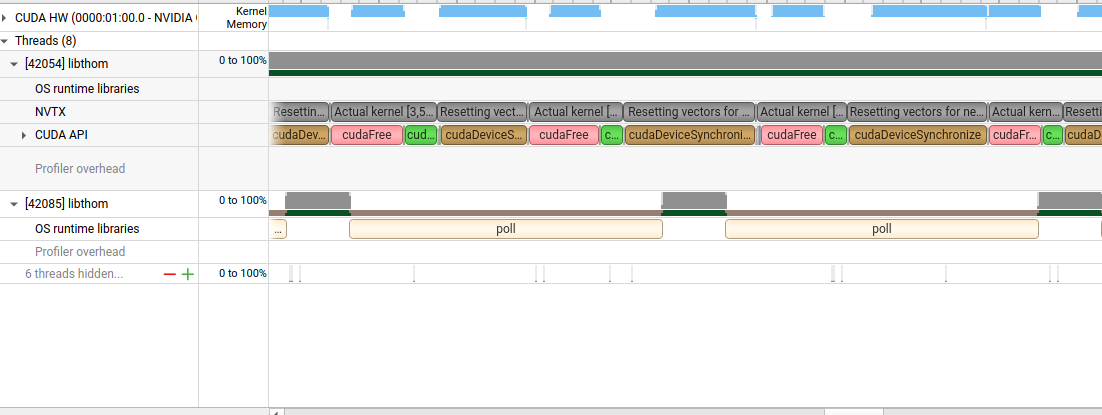
worked a little on a routines library i'm making, and after implementing the benchmark part, profiling the application with nsight systems i realized most of the time the application ran was spent in the vector initializations (i reset them to random numbers between each runs). this also allowed me to discover nvtx to instrument my code and find everything in the profiler. i don't time this initialization part so it doesn't matter for the result in itself, but it's still time i spend waiting in front of the screen, and modal credits i'm burning for no reason.
so i replaced my manual method with calls to cuRAND, and it cut the total execution time of the benchmark by like x20 !! it's much better, now the main "bottleneck" regarding the sizes of problems i can benchmark is the kernel itself or the available memory (i still need to allocate them on cpu for result checking etc)
1
144


May 30
40/100 of GPU Grind
worked a little on a routines library i'm making, and after implementing the benchmark part, profiling the application with nsight systems i realized most of the time the application ran was spent in the vector initializations (i reset them to random numbers between each runs). this also allowed me to discover nvtx to instrument my code and find everything in the profiler. i don't time this initialization part so it doesn't matter for the result in itself, but it's still time i spend waiting in front of the screen, and modal credits i'm burning for no reason.
so i replaced my manual method with calls to cuRAND, and it cut the total execution time of the benchmark by like x20 !! it's much better, now the main "bottleneck" regarding the sizes of problems i can benchmark is the kernel itself or the available memory (i still need to allocate them on cpu for result checking etc)
May 27
39/100 of GPU Grind
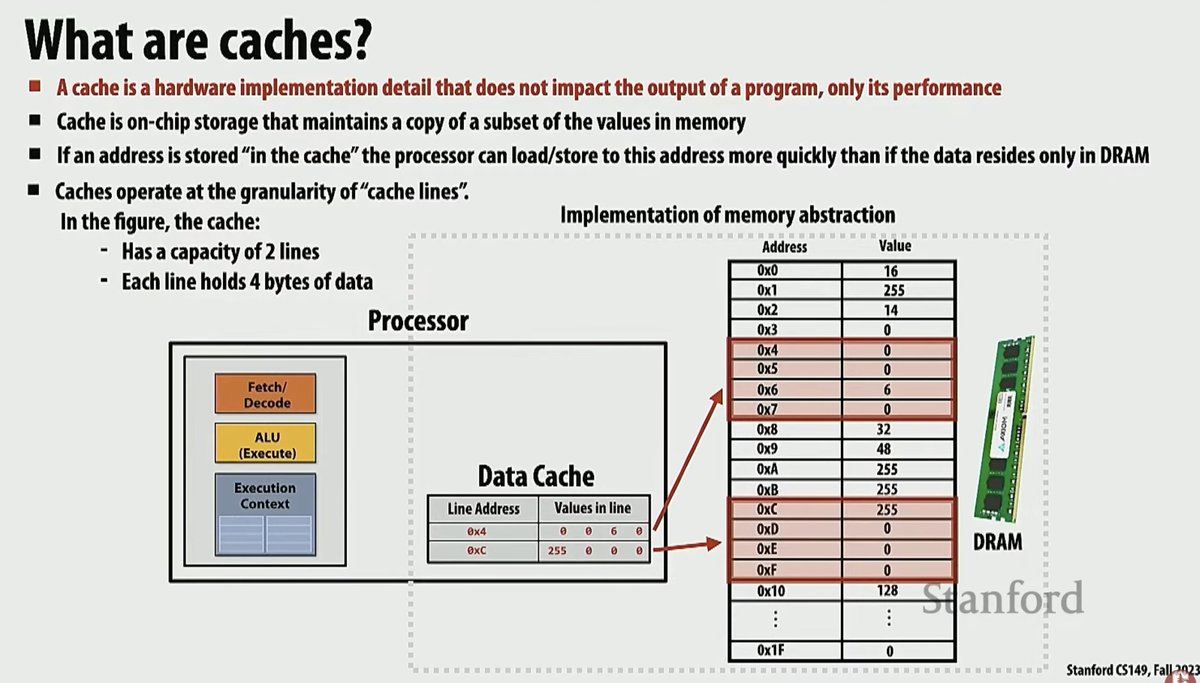
continuing the cs149 parallel programmin course, watching lecture 2 ! it's about multi-core processors, SIMD concepts and examples with avx intrinsics, caches hierarchy etc
it's quite interesting to see how there's bridges with how a gpu works everywhere in those explanations, for example the simd divergence issues / warp divergence issues

121
May 27
39/100 of GPU Grind
continuing the cs149 parallel programmin course, watching lecture 2 ! it's about multi-core processors, SIMD concepts and examples with avx intrinsics, caches hierarchy etc
it's quite interesting to see how there's bridges with how a gpu works everywhere in those explanations, for example the simd divergence issues / warp divergence issues
May 25
38/100 of GPU Grind
i've seen screenshots of it on the tl multiple times, and it got my interest so i'm starting course cs149 on parallel computing from stanford, the lectures are available on youtube. i expect to know already most of the concepts from there since i just did a semester of high performance computing a few months ago, but i think it'll still be interesting to have some refreshers when i'm tired, and also see if stanford professors address the topic differently
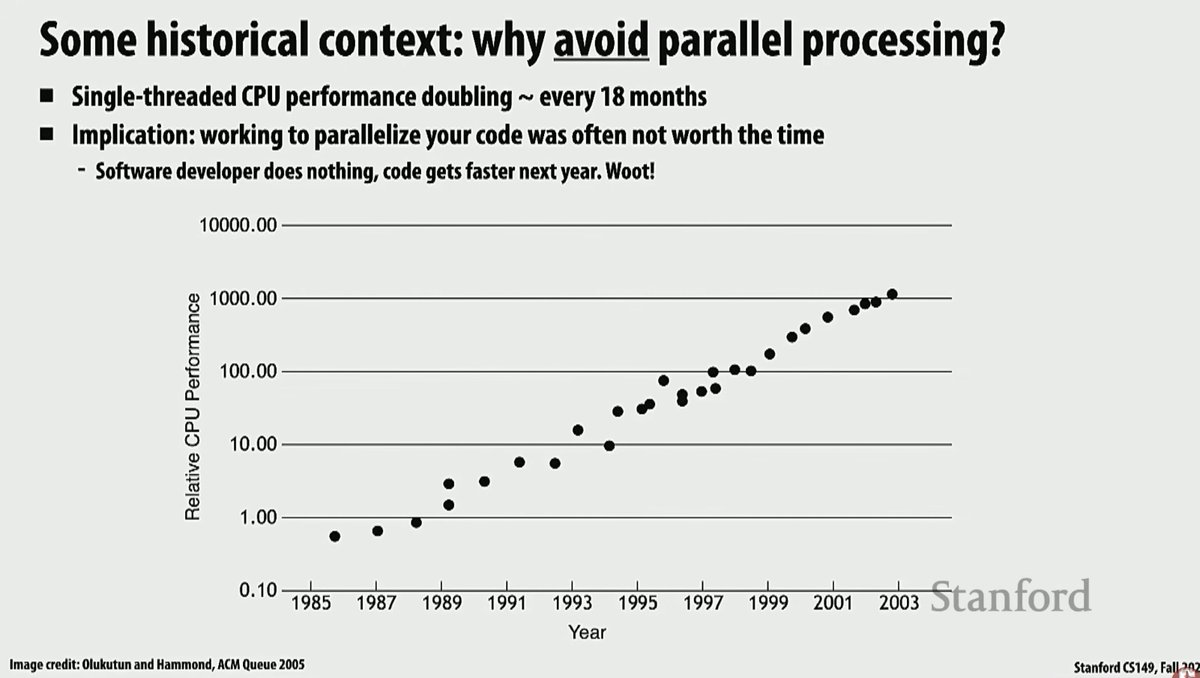
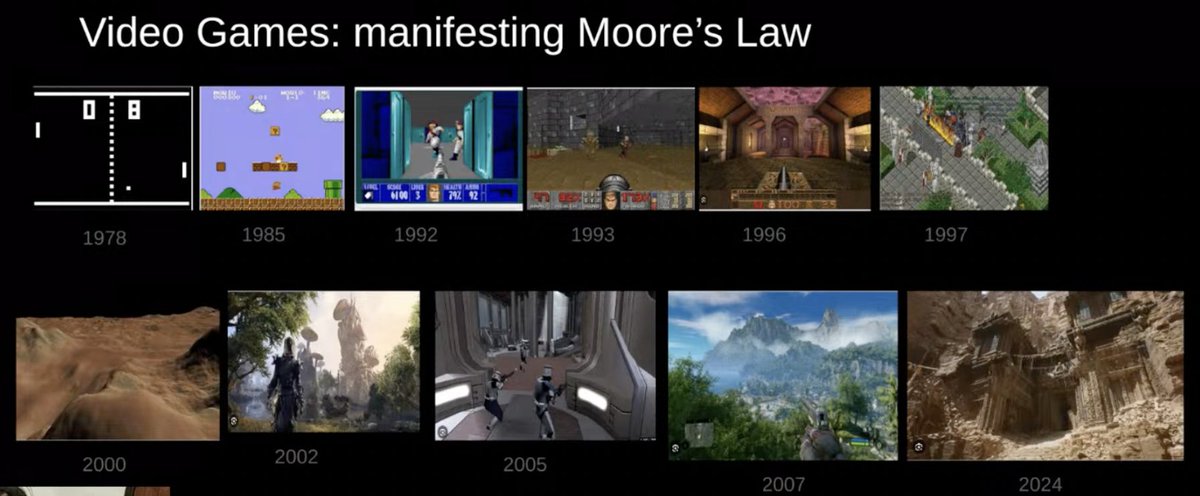
first lecture was really an introduction, making students perform parallel computing things (like counting the number of students in class) with different methods, introducing moore law's etc.. quite funny how most of the figures were the exact same we saw in class, i guess every professor use those


1
130
May 25
38/100 of GPU Grind
i've seen screenshots of it on the tl multiple times, and it got my interest so i'm starting course cs149 on parallel computing from stanford, the lectures are available on youtube. i expect to know already most of the concepts from there since i just did a semester of high performance computing a few months ago, but i think it'll still be interesting to have some refreshers when i'm tired, and also see if stanford professors address the topic differently
first lecture was really an introduction, making students perform parallel computing things (like counting the number of students in class) with different methods, introducing moore law's etc.. quite funny how most of the figures were the exact same we saw in class, i guess every professor use those
May 23
37/100 of GPU Grind
i spent a lot of time setting up my development environment for CUB, and while my tests were building (multiple hours actually 🫠 ) i watched the gpu mode lecture on consumer gpus from Jake Cannel (vast ai), which was actually a lot of background on pre-cuda gpu programming, in the graphics ecosystem early 2000s and its evolution
to stick with the topic of consumer gpus performance, the benchmarks in the talk show that you get more flops per dollar with a 4090 than with a H100, that might be common knowledge but i was actually quite surprised. however h100 gets obviously more flops, and also has more memory
3
406
May 23
37/100 of GPU Grind
i spent a lot of time setting up my development environment for CUB, and while my tests were building (multiple hours actually 🫠 ) i watched the gpu mode lecture on consumer gpus from Jake Cannel (vast ai), which was actually a lot of background on pre-cuda gpu programming, in the graphics ecosystem early 2000s and its evolution
to stick with the topic of consumer gpus performance, the benchmarks in the talk show that you get more flops per dollar with a 4090 than with a H100, that might be common knowledge but i was actually quite surprised. however h100 gets obviously more flops, and also has more memory
May 21
35-36/100 of GPU Grind
trying to find a project in which i can apply my cuda skills to actually do something useful, instead of just writing kernels for the sake of learning (which i love to do, but i think it'd be cool to do both!)
familiarized myself with the CUB repository, i like the idea, header only library providing building blocks for high performance kernels, the CCCL repo (which contains thrust, cub, libcu ) is very active but there seems to be things i could contribute to. though it's not easy to understand how things work in the project just by myself, there's a lot of concepts (13k commits, obviously there's been so many things done on the project so there's a lot of depth), but i'm going to stick with this!
1
441