
Professor @HKUniversity. Statistical demographer working on estimating #migration and demographic forecasting, mainly using #rstats.
Joined January 2012
- Tweets 194
- Following 205
- Followers 1,182
- Likes 306
63 Photos and videos


Jun 11
🚨Out today in @Nature our new paper uses deep learning to map four decades of global human migration.
By building the first comprehensive dataset of global annual flows (1990-2023), we reveal that migration has nearly tripled since 2000.
🔗nature.com/articles/s41586-0…
14
338
1,284
122,768
Jun 11
📊The data explorer features a variety of interactive data visualisation methods.
Switch between the global maps, chord diagrams and Sankey charts to track migration across different country corridors - with options for toggling map types, filtering chord sizes and many more
1
4
20
1,621
Jun 11
📦Download the complete estimates of annual global migration flow and stock datasets:
🔗zenodo.org/records/15778301
🔗huggingface.co/datasets/ThGa…
🛠Access the full deep learning architecture and plot reproduction code on GitHub:
🔗github.com/ThGaskin/Migratio…
@LSEnews @HKUFoSS @IIASAVienna
4
11
1,220

Global migration has increased from 13 million people per year in 2000 to around 35 million in 2023. The data, published in Nature today, come from the most detailed maps of global migration produced in the 33 years.
go.nature.com/444iUfq
13
30
7,374
2 May 2025
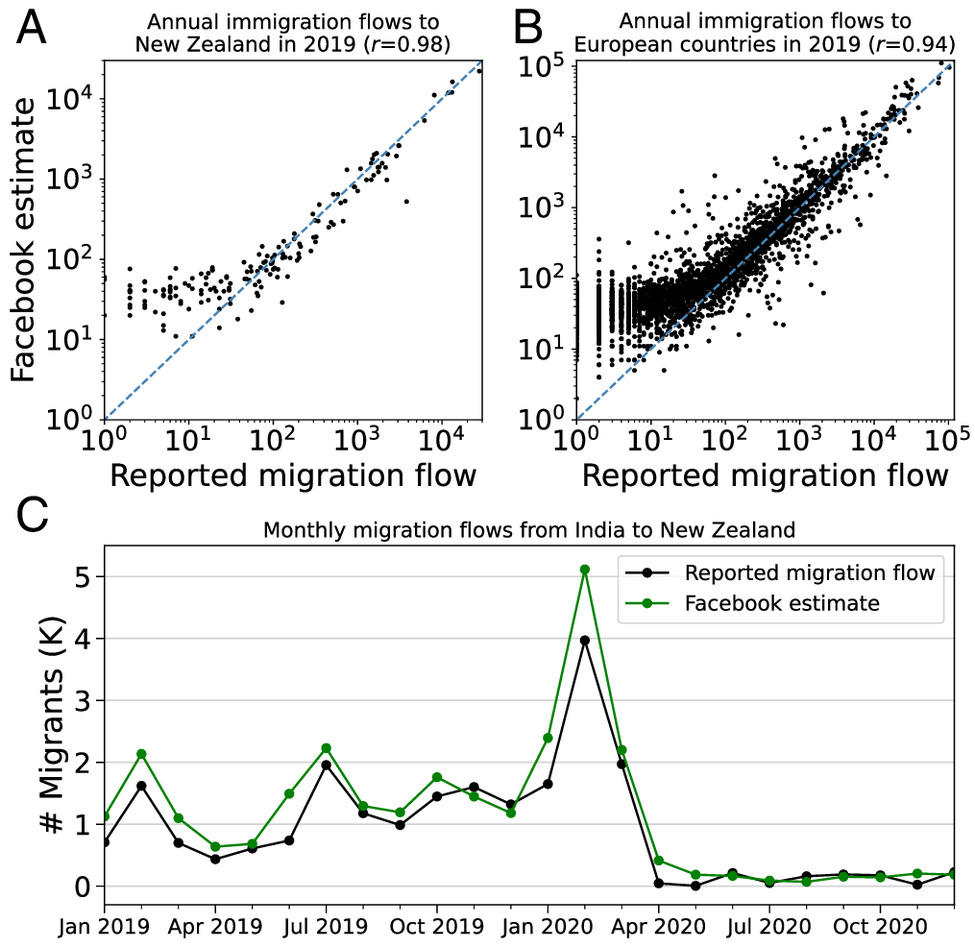
📢New paper out on measuring global #migration flows using online data in @PNASNews
We use privacy-protected records from over 3 billion Facebook users to estimate migration flows between 181 countries, accounting for biases in social media usage.
🔗pnas.org/doi/10.1073/pnas.24…
1
16
48
3,503
2 May 2025
The @nytopinion provide some amazing #dataviz of the estimates (behind their paywall): nytimes.com/interactive/2025… #dataviz
1
2
6
251
17 Apr 2025
The @nytopinion features a #dataviz of our new global migration flow estimates.
nytimes.com/interactive/2025…
Using privacy protected records from three billion Facebook users, we estimated country-to-country #migration flows at monthly granularity for 181 countries.
2
2
1
255
17 Apr 2025
An @arxiv paper on our method, led by @Meta Data for Good researchers, is out now: arxiv.org/abs/2504.11691
2
1
1
210
17 Apr 2025
Full #OpenAccess to the estimates will come soon, when the journal paper based on the work is published.
142
27 Mar 2025
Updated #migration flow estimates to match new @UNDESA stock data
📄Bilateral: doi.org/10.6084/m9.figshare.…
📄Bilateral by sex: doi.org/10.6084/m9.figshare.…
🖥️Update details: guyabel.com/publication/bila…
📔Original @ScientificData papers: nature.com/articles/s41597-0… & nature.com/articles/s41597-0…
4
11
878
Guy Abel 鄭蓋堡 retweeted

4 Mar 2025
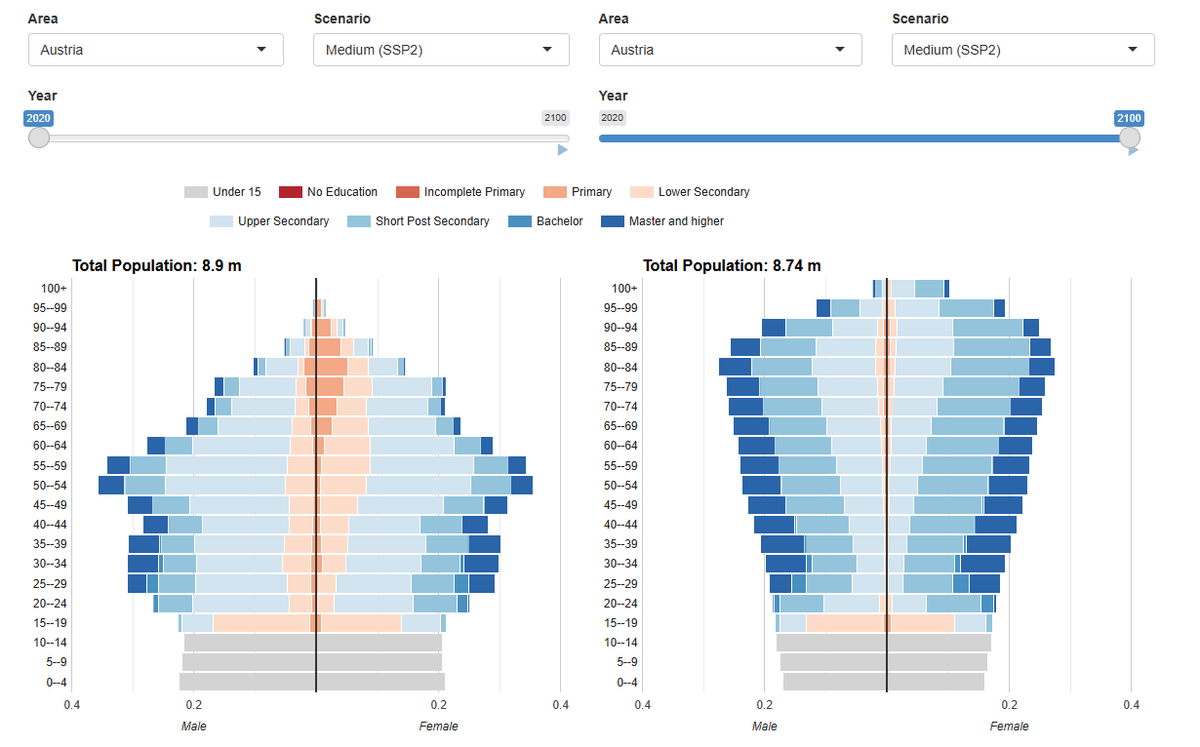
Access 𝗩𝗲𝗿𝘀𝗶𝗼𝗻 𝟯.𝟭 𝗼𝗳 𝘁𝗵𝗲 𝗪𝗶𝘁𝘁𝗴𝗲𝗻𝘀𝘁𝗲𝗶𝗻 𝗖𝗲𝗻𝘁𝗿𝗲 𝗗𝗮𝘁𝗮 𝗘𝘅𝗽𝗹𝗼𝗿𝗲𝗿 ⬇️
🔗 WIC Data Explorer: dataexplorer.wittgensteincen…
🔗 R package: guyabel.github.io/wcde/
🔗 Zenodo: zenodo.org/records/14718294
@IIASAVienna @WiCVienna @oeaw
6
23
1,008
3 Mar 2025
🚨JOB ALERT🚨
We are recruiting for multiple Research Assistant Professor (RAP) / Post-doctoral Fellow (PDF) positions in the HKU Research Hub of Population Studies.
jobs.hku.hk/en/job/531279/re…
#demography #population #poptwitter
6
6
926
30 Oct 2024
Updated country-to-country #migration flow estimates for WPP2024
📄Bilateral: doi.org/10.6084/m9.figshare.…
📄Bilateral by sex: doi.org/10.6084/m9.figshare.…
🖥️Update details: guyabel.com/publication/bila…
📔Original @ScientificData papers: nature.com/articles/s41597-0… & nature.com/articles/s41597-0…
31
86
6,389
Guy Abel 鄭蓋堡 retweeted

15 Oct 2024
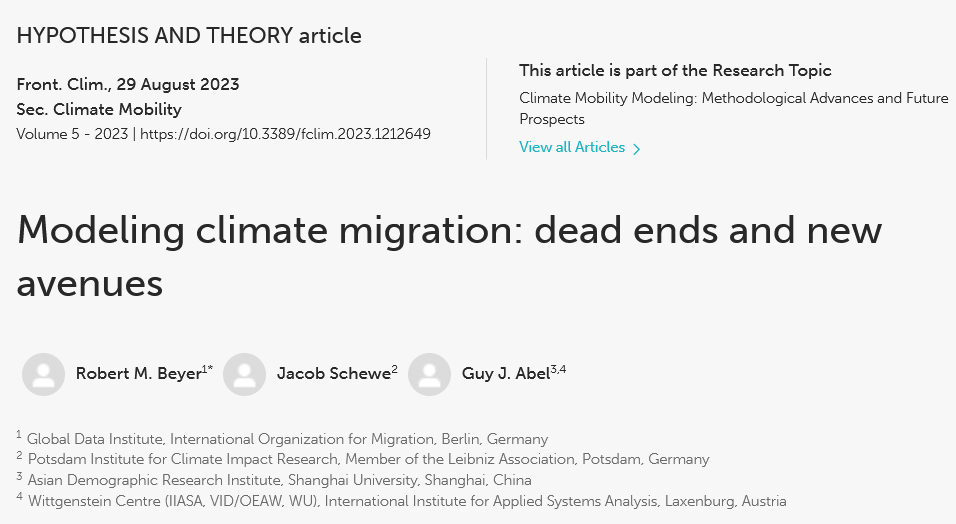
How is #ClimateChange reshaping #migration patterns? A new @NatureClimate study led by IIASA's @RmnHoffmann provides the first global analysis of how drought and aridity drive internal migration 📊
Read more 👉 iiasa.ac.at/news/oct-2024/cl… 🌍
@guyabelguyabel @popclima @WiCVienna @Unibo
1
6
14
1,105
Guy Abel 鄭蓋堡 retweeted

8 Aug 2024
Introducing a global model for projecting migration until 2050, Kluge et al. factor in age, education, and gender, revealing that socioeconomic scenarios significantly impact migration flows. Explore the new future migration projections with us!
demographic-research.org/art…
2
8
20
3,343
Guy Abel 鄭蓋堡 retweeted
24 Jun 2024
✍️New on the #IIASAblog: researchers @dil_yildiz and @guyabelguyabel highlight a new statistical model that merges traditional data with real-time Facebook data to estimate EU migrant populations, providing key insights for policymakers. #POPtwitter #demography @WiCVienna
➡️iiasa.ac.at/blog/jun-2024/pr…
1
6
8
2,118