
Jun 15
Data beats guesswork.
The strongest Amazon decisions come from analytics, not assumptions.
#SpectrumBPO #AmazonAnalytics #BusinessGrowth #eCommerce

ALT Data beats guesswork
3

From Data to Decisions: Building an Amazon Revenue Intelligence Dashboard 📊🚚
When I started learning Power BI, I thought dashboards were mainly about making charts look beautiful.
This project taught me something different:
Dashboards are not about visuals. They're about decisions.
For this Amazon Revenue Intelligence Dashboard, I focused on transforming raw data into meaningful business insights using:
✅ Power BI
✅ DAX Measures
✅ Star Schema Data Modeling
✅ Interactive Slicers
✅ HTML KPI Cards
✅ Business Intelligence Storytelling
📈 Key Insights
💰 ₦120.4M Revenue generated from 100,000 orders
👥 20,000 customers, with 69.4% Prime members, highlighting the importance of customer loyalty
📦 5,000 products across multiple categories, creating diversified revenue streams
Business Questions Answered
🔹 Which customer segment drives the most value?
🔹 Are loyalty programs actually working?
🔹 Which product categories deserve more investment?
🔹 Is revenue growth sustainable?
One part I'm particularly proud of is the backend architecture.
I designed the model using a Star Schema, built dynamic DAX measures, and created executive-style HTML KPI cards to combine performance with modern dashboard design.
🎯 Biggest Lesson
Data is more than numbers.
Revenue tells a story.
Customers reveal behavior.
Products highlight opportunities.
The goal isn't to build dashboards. The goal is to help businesses make smarter decisions.
🚀 Explore the Interactive Dashboard
🔗 lnkd.in/dmJNFFKp
If you were the decision-maker looking at this dashboard, what action would you take first?
👇 I'd love to hear your thoughts.
#PowerBI #DataAnalytics #BusinessIntelligence #DAX #DataVisualization #StarSchema #DashboardDesign #DataStorytelling #SQL #MicrosoftPowerBI #AmazonAnalytics #DataAnalyst
1
3
10
172
From Data to Decisions: Building an Amazon Revenue Intelligence Dashboard 📊🚚
When I started learning Power BI, I thought dashboards were mainly about making charts look beautiful.
This project taught me something different:
Dashboards are not about visuals. They're about decisions.
For this Amazon Revenue Intelligence Dashboard, I focused on transforming raw data into meaningful business insights using:
✅ Power BI
✅ DAX Measures
✅ Star Schema Data Modeling
✅ Interactive Slicers
✅ HTML KPI Cards
✅ Business Intelligence Storytelling
📈 Key Insights
💰 ₦120.4M Revenue generated from 100,000 orders
👥 20,000 customers, with 69.4% Prime members, highlighting the importance of customer loyalty
📦 5,000 products across multiple categories, creating diversified revenue streams
Business Questions Answered
🔹 Which customer segment drives the most value?
🔹 Are loyalty programs actually working?
🔹 Which product categories deserve more investment?
🔹 Is revenue growth sustainable?
One part I'm particularly proud of is the backend architecture.
I designed the model using a Star Schema, built dynamic DAX measures, and created executive-style HTML KPI cards to combine performance with modern dashboard design.
🎯 Biggest Lesson
Data is more than numbers.
Revenue tells a story.
Customers reveal behavior.
Products highlight opportunities.
The goal isn't to build dashboards. The goal is to help businesses make smarter decisions.
🚀 Explore the Interactive Dashboard
🔗 lnkd.in/dmJNFFKp
If you were the decision-maker looking at this dashboard, what action would you take first?
👇 I'd love to hear your thoughts.
#PowerBI #DataAnalytics #BusinessIntelligence #DAX #DataVisualization #StarSchema #DashboardDesign #DataStorytelling #SQL #MicrosoftPowerBI #AmazonAnalytics #DataAnalyst

2
15
247

Feb 28
أهم تقرير في Amazon Ads هو Search Term Report.
قسم الكلمات إلى 3 فئات:
1️⃣ Winners (مبيعات ACOS جيد) → زود الميزانية.
2️⃣ Testing (Clicks قليلة) → سيبها تكمل Data.
3️⃣ Losers (Clicks كتير بدون مبيعات) → Negative فورًا.
التقرير ده هو كنزك الحقيقي.
اللي بيتابعه أسبوعيًا دايمًا بيكسب.
#AmazonAnalytics #Optimization #AmazonSellers
ALT Search Term Report
4
322
Feb 28
كتير بيفرح لما يشوف CTR عالي ... بس السؤال الحقيقي:
هل الـ Clicks دي بتتحول لمبيعات؟
ال CTR بيعكس قوة:
الصورة
العنوان
السعر مقارنة بالمنافسين
لكن Conversion Rate بيعكس:
جودة المنتج
قوة الصفحة
الثقة (Reviews Social Proof)
ممكن يبقى عندك CTR عالي وConversion ضعيف →
ده معناه إن إعلانك جذاب … لكن منتجك مش مقنع كفاية.
💡 النجاح الحقيقي هو التوازن بين الاتنين.
#AmazonAnalytics #EcommerceTips #AmazonAds
ALT CTR
4
61

30 Mar 2024
New 'Data Dudes' episode alert! 🎧 Join us with Nhan Dinh as we explore the intersection of Amazon selling and software innovation. Discover how to harness data for your Amazon success. 📊💻 #DataDudes #AmazonAnalytics #SellerRevolution #Amazon
1
1
74

1 Feb 2024
Explore your #AmazonSeller data like never before!
#Junglytics Assistant is an AI-powered analytics tool that lets sellers ask questions from their business data.
junglytics.com/?utm_source=s…
#AmazonTips #AmazonDataAnalytics #AmazonAnalytics #AmazonAI
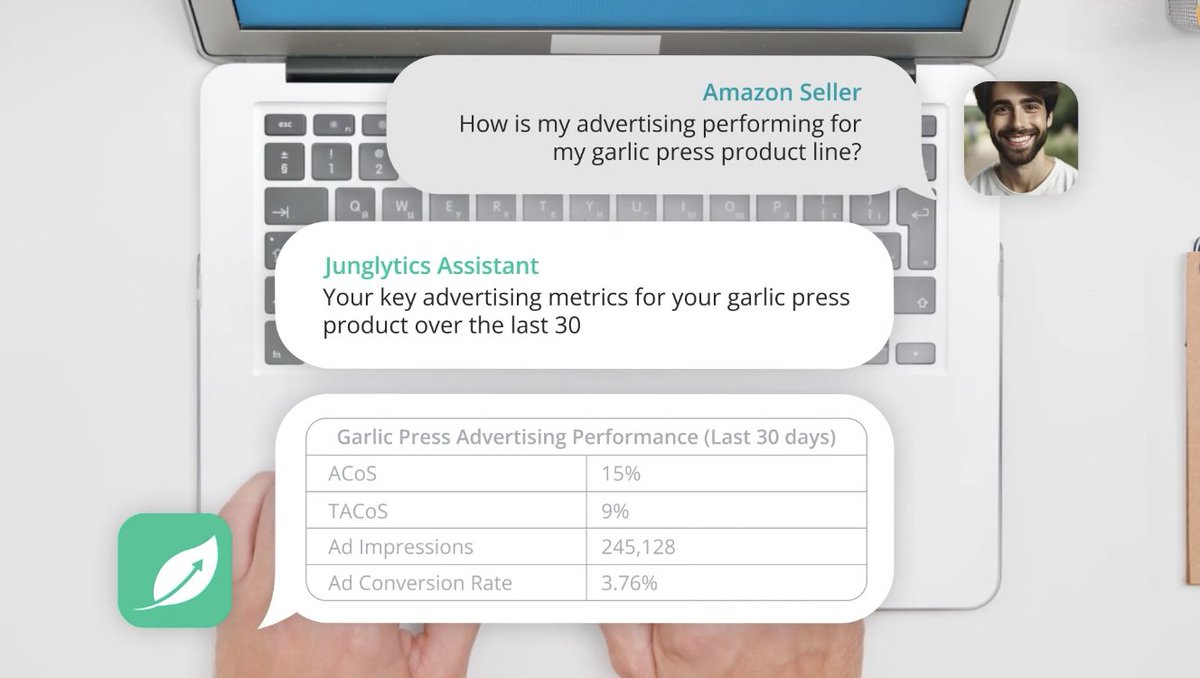
ALT A chat exchange with Junglytics Assistant, an AI analytics tool for Amazon sellers. The questions reads: "How is my advertising performing for my garlic press product line?" Junglytics Assistant answers: "Your key advertising metrics for your garlic press product over the last 30 days: ACoS 15%, TACoS 9%, Ad Impressions 245128, Ad Conversion Rate 3.76%."
1
1
76
30 Nov 2023
Customizable Amazon analytics:
🍃 Easy to use
🍃 Deeper insights
🍃 Understand and meet your goals
Here's a quick rundown of how to use Junglytics for Amazon analytics:
youtu.be/4FNyG5CFOhw?si=hW30…
#AmazonAnalytics #AmazonSellerCentral #AmazonFBA #AmazonData #AmazonFBM
1
38
24 Nov 2023
What to Look for in an Amazon Analysis Tool
junglytics.com/blog/what-to-…
#AmazonFBA #FBASeller #AmazonSeller #AmazonAnalytics #FBAAnalytics
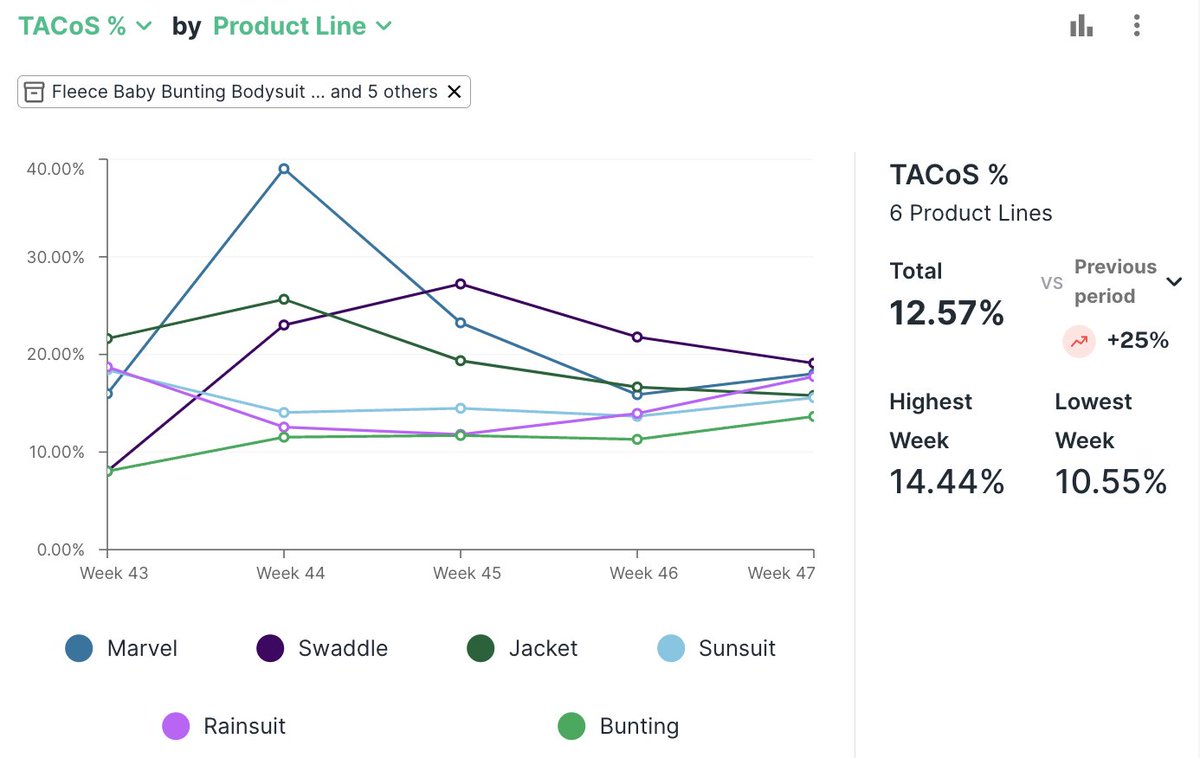
ALT An Amazon data analytics dashboard from Junglytics showing the total advertising cost of sale (TACOS) for six product lines across four weeks.
2
121

Our M2E Analytics app delivers deep insights into sales 📊, traffic 📈, and customer behavior 👨👩👧👦across eBay, Amazon, and now Walmart.
Try M2E Analytics today! ➡️ youtu.be/KpD3Bo-RbV8
#ecommerce #salesanalytics #ebayanalytics #amazonanalytics #walmartanalytics #analytics
1
2
32
M2E Analytics app📈 provides valuable insights into your customer behavior, sales trends, and more!
Watch this short video 🎥 to see M2E Analytics in action ➡️ youtu.be/cLIrAlsUmWQ
#ecommerce #salesanalytics #ebayanalytics #amazonanalytics #analytics
1
3
149
Unlock the potential of your eBay and Amazon sales 🏷with the M2E Analytics app!➡️ m2epro.com/analytics
Monitor your sales in real time 📈and gain valuable insights 📊with detailed product and customer analytics.
#ecommerce #salesanalytics #ebayanalytics #amazonanalytics
1
2
60

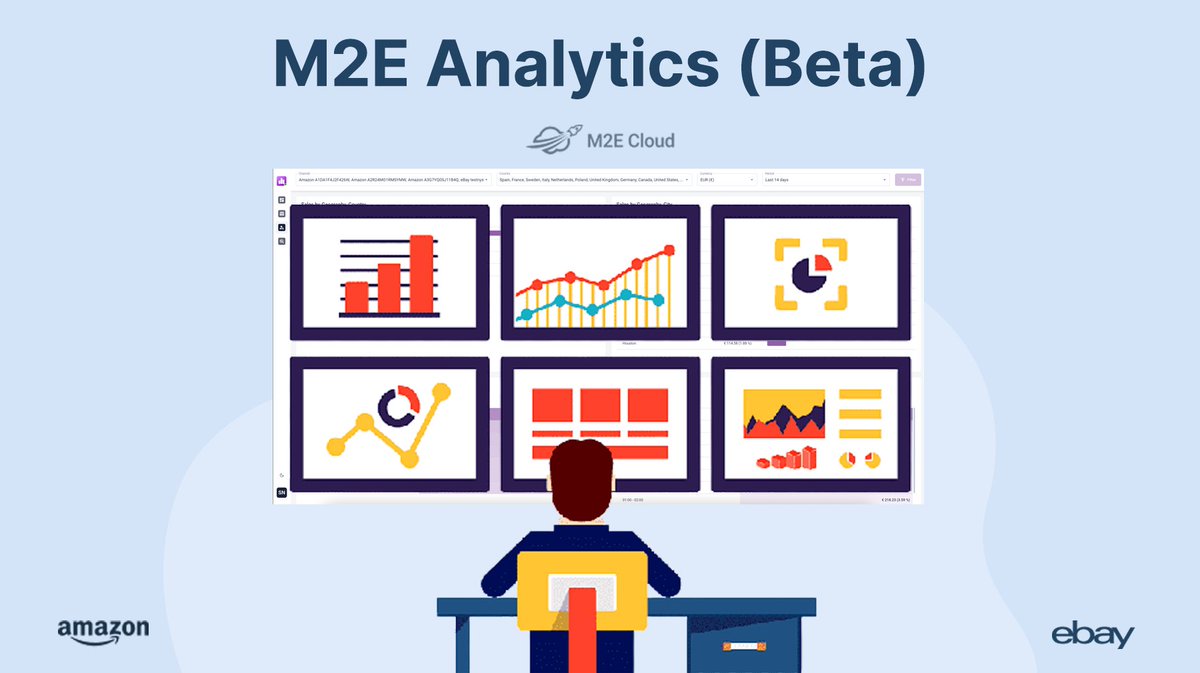
We are glad to announce the upcoming release of M2E Analytics 📊 an app that provides a detailed overview of your eBay & Amazon sales 🚀
Learn more about the app and request early access ⬇ m2ecloud.com/analytics-for-e…
#ecommerce #salesanalytics #ebayanalytics #amazonanalytics
2
24

20 Jul 2022
Gavin from Nature Provides shares how Nozzle has helped achieve a 30% uplift in new-to-brand customers, driving a 40% growth in sales year on year! 🤗
#amazonseller #amazonfba #amazonanalytics #amazonsales #amazonprivatelabel #amazonsellingstrategy
2
11 Jul 2022
Is Amazon Prime Day worth it for you? 🚀 💡
Head over to our blog page to find out more in this useful article from our Co-Founder and CEO Rael Cline.
buff.ly/3NPXOqU
#AmazonFBA #FBAseller #AmazonSeller #Ecommerce #AmazonAnalytics

2

1 Feb 2021
What does the data say about the top 10 amazon searches in 2020? Learn all about it in our latest blog post here:
hubs.ly/H0FMD020 #ecommerce #whatthedatasays #amazonsearches #amazonanalytics
2
2

1 Sep 2020
Eva Sales Analytics is live! Get a Complete View of your Amazon Business for FREE!
👉 Sign up today
bit.ly/3bjeuoM
#amazon #amazonsellers #amazonfba #amazonwholesale #amazonfbaseller #fba
#fbaseller #amazonbusiness #amazonadvertising #amazonppc #amazonanalytics

3

21 Jul 2020
Amazon Brand Analytics is Amazon’s own analytics tool, available to all brand registered #sellers. In this video, we are going to give you 6 tips that will aid you in creating the perfect #Amazonppc Campaign using ABA.
bit.ly/sellerapp-youtube
⏰July22, 12pm EST
#amazonanalytics

1
2

23 Aug 2018
#PrimeDay2018 was another record-breaking success for #Amazon. What happened, and how are competitors responding? Read our latest report to find out: bit.ly/AmazonAnalyticsReport… #Analytics #AmazonAnalytics #ConsumerInsights
1
2

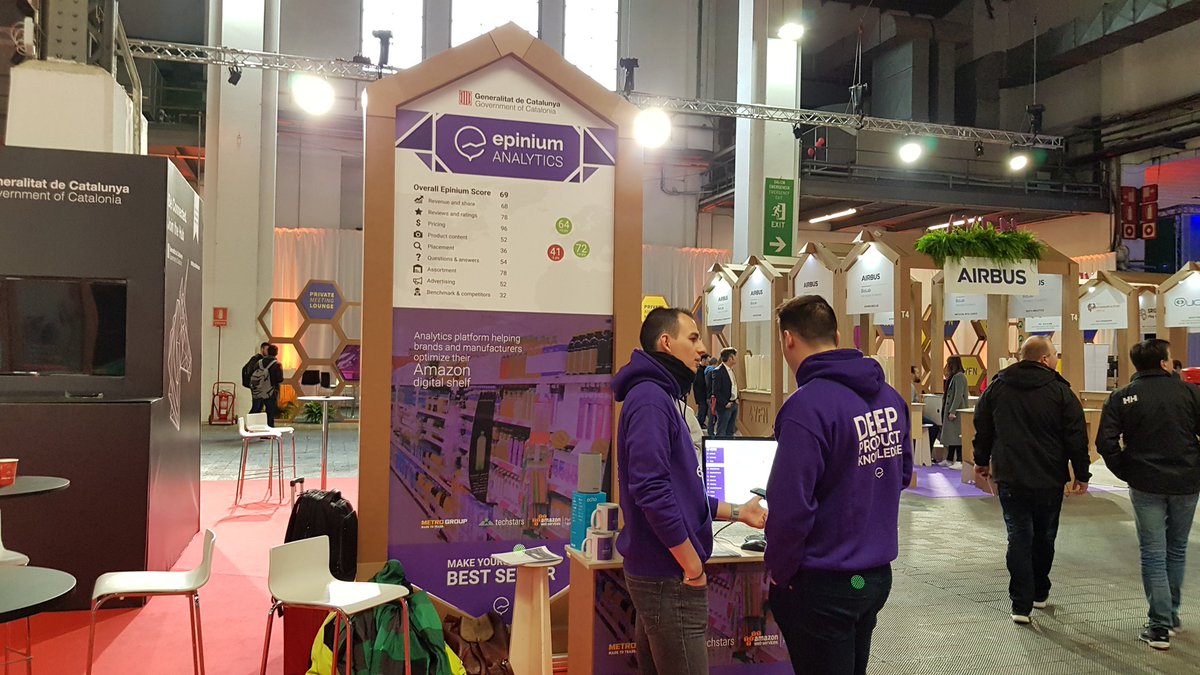
27 Feb 2018
Do you know how to improve your SEO in Amazon? Come to our booth R3.19 in the Generalitat de Catalunya area in #4YFN #amazonseo #boostamazon #amazontools #amazonanalytics
2
1