
【Angular Material】Treeコンポーネントを使ってディレクトリ構造を表示してみた #angularMaterial - Qiita qiita.com/nakamuuu_ow/items/…
1
2
76

Mar 30
🎥 Modern Angular - Video 9
Building the products grid with Angular Material and CSS Grid
Clean components, responsive layout, separation of concerns.
▶️ youtu.be/Lv6lllzZZKI
📚 Playlist: youtube.com/playlist?list=PL…
#ModernAngular #AngularMaterial

4
31
1,376

23 Dec 2025
🚀 Coming in #Angular 21.1
✔️ Virtual Scrolling for Material Tables
#AngularMaterial
Watch Now: youtu.be/KYNMGWamB2o&t=1s
3
18
871

22 Dec 2025
Nav With Inverse Overlap
A bold header. A layered content area. Zero layout headaches.
This premium stacked layout is built for modern Angular dashboards where navigation and content need clear visual hierarchy.
✨ Built with Angular Material
📐 Responsive by default
🧩 Clean overlap pattern that works in light & dark mode
🎉 Year End Sale — Flat 25% OFF
Available inside Angular Material Blocks
👉 Grab it before the sale ends: ui.angular-material.dev/bloc…
#Angular #AngularMaterial #DashboardUI #FrontendDev #UIDesign #YearEndSale


1
4
143
6 Nov 2025
Easily give your users a dropzone for files in your Angular project using Angular Material & Tailwind CSS!
Checkout demo at ui.angular-material.dev/bloc…
#AngularMaterial #AngularFileUpload #AngularForm
2
10
610

28 Oct 2025
Template dashboard from @ngMaterialDev comes with a power-packed @angular material table which includes:
- 3 filters
- column config
- overlay for rows selection
See it in action at template-dashboard.angular-m…
#AngularMaterial #Dashboard #AngularUI #WebDev
2
2
117
21 Oct 2025
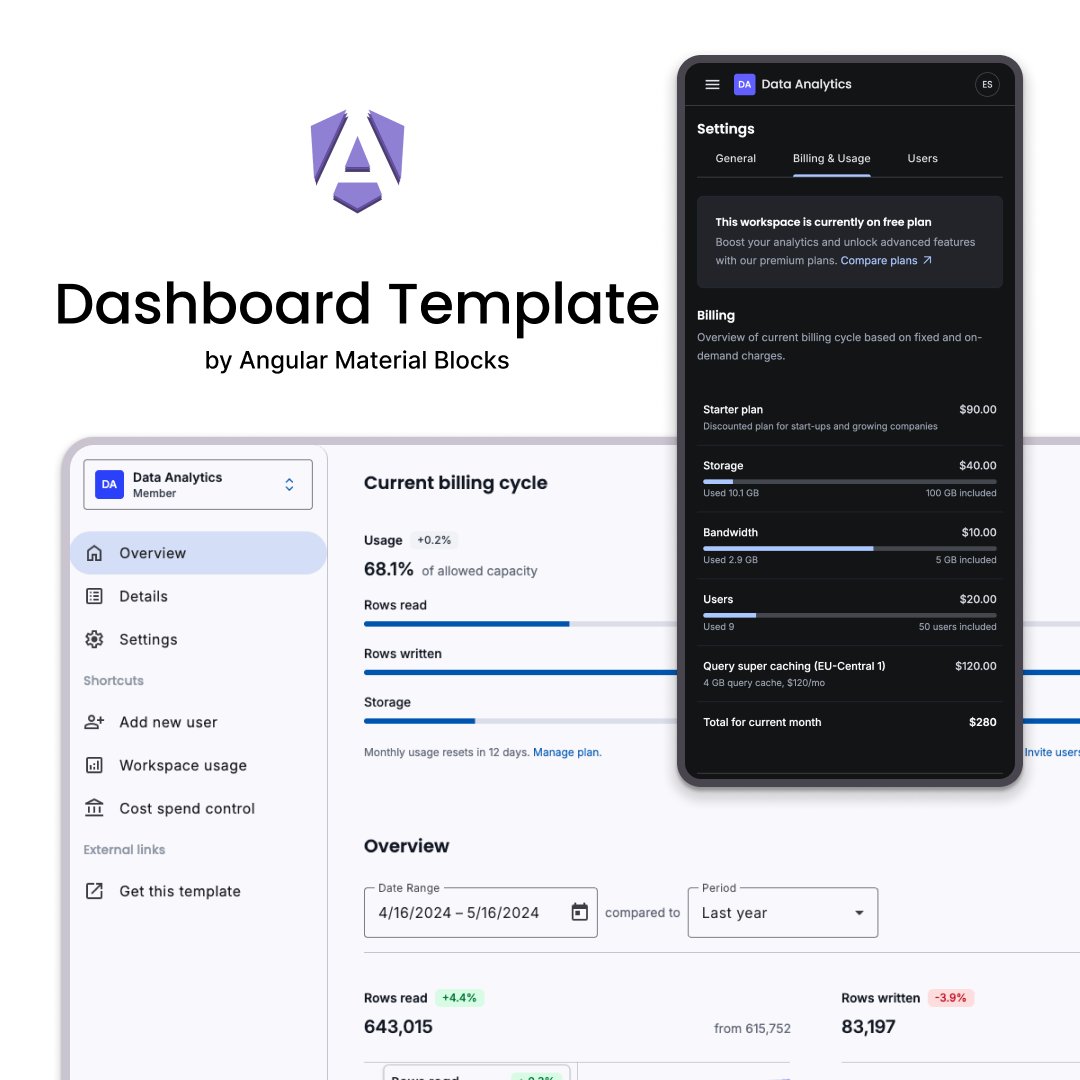
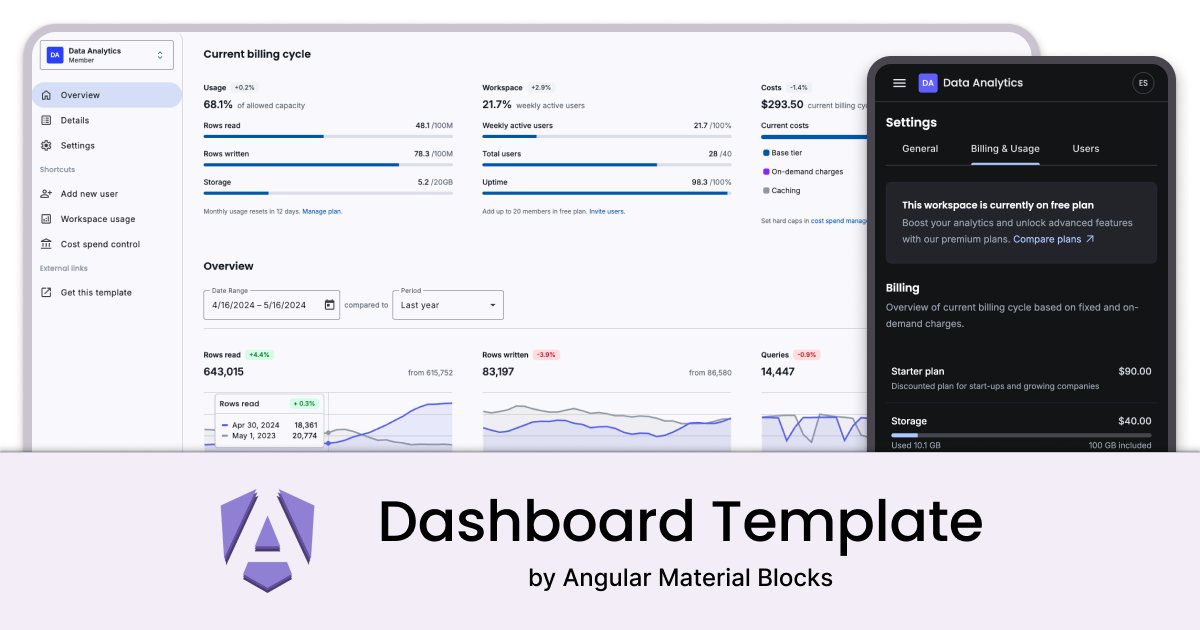
Build your SaaS dashboard in days, not months.
Our new "Dashboard" template is live!
🚀 A20, Zoneless, TW4 📊 Charts, tables, filters ⚙️ Settings, Billing, Users 🌓 Light/Dark modes
The complete analytics package.
#AngularMaterial #SaaS #UIUX
ui.angular-material.dev/temp…
21 Oct 2025

🔥 NEW TEMPLATE: The ultimate "Dashboard" for Angular.
We built this on a cutting-edge, production-ready stack:
✅ Angular 20 with Angular Material
✅ Zoneless
✅ Tailwind CSS 4
✅ New Animations API
✅ Chartjs with custom tooltip
#Angular #Zoneless #WebDev
Link in 1st comment
1
2
5
257
13 Oct 2025
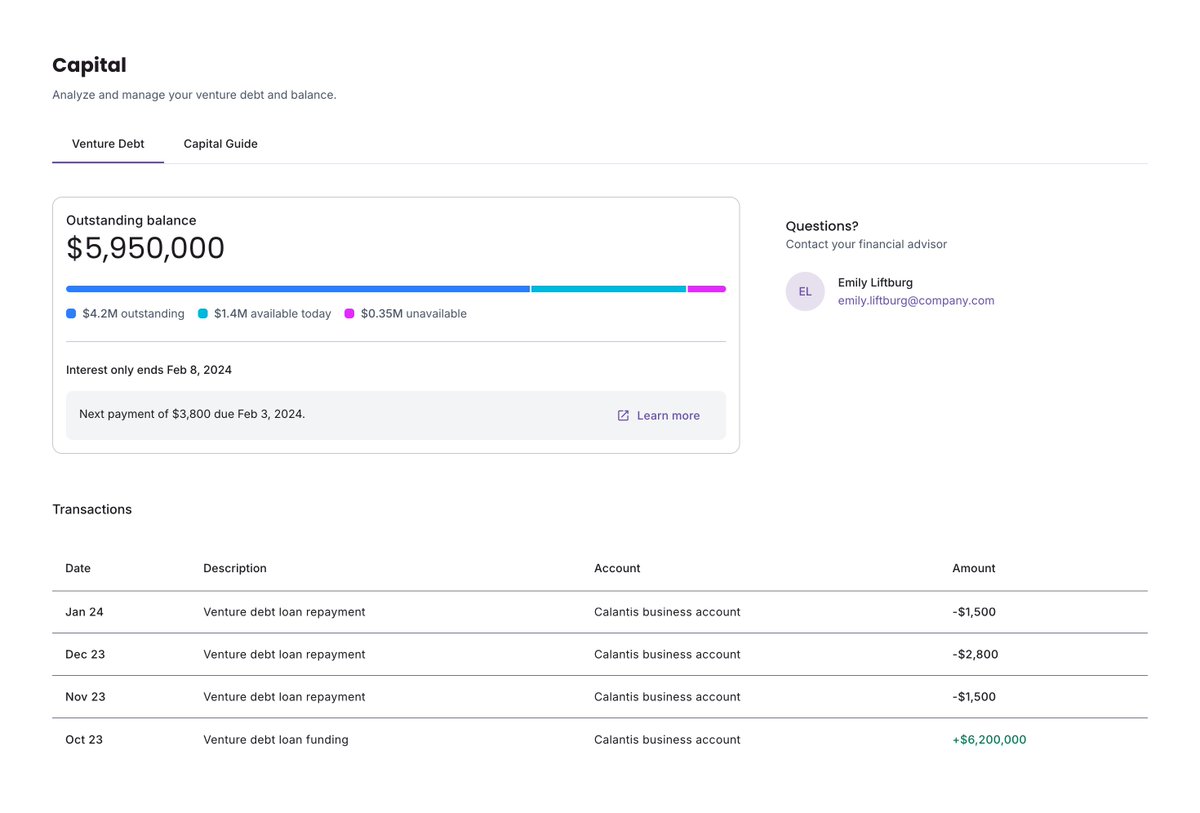
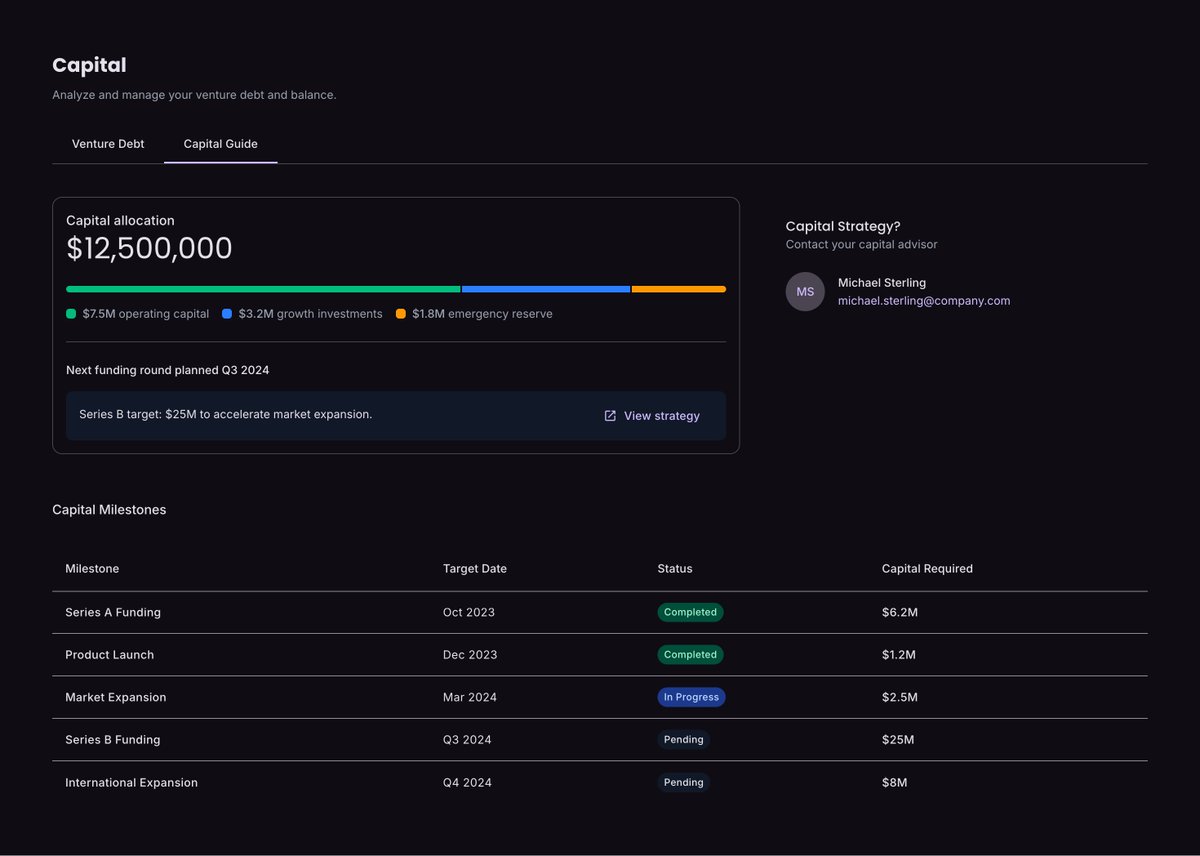
Visualize your company's financial health. ✨
Our "Capital Management" composition features tabbed views for Venture Debt and a Capital Guide, combining progress bars with detailed transaction and milestone tables.
Find it in our Chart Compositions! #AngularMaterial #UIUX
13 Oct 2025
Hey Founders & Startups! 👋
Today's Featured Block is this "Capital Management" dashboard. Track your venture debt, funding milestones, and capital allocation in one clean, organized view.
Perfect for managing your runway.
#Angular #FinTech #Startups
ui.angular-material.dev/bloc…
1
2
120
7 Oct 2025
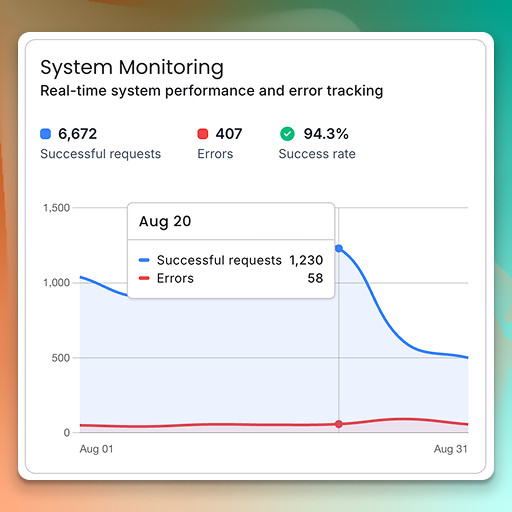
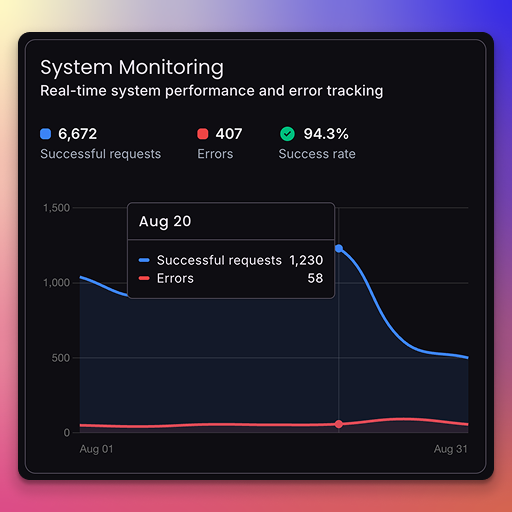
Visualize your system's health in real-time. ✨
Our "System Monitoring" block combines essential KPIs (success rate, errors) with a time-series area chart to track performance and spot trends instantly.
ui.angular-material.dev/bloc…
#AngularMaterial #SRE #UIUX

7 Oct 2025
For all the DevOps and SREs out there! 👋
Today's featured block is this "System Monitoring" chart. Get a real-time overview of successful requests, errors, and success rate, all in one clean component
Perfect for monitoring dashboard.
ui.angular-material.dev/bloc…
#Angular #DevOps

1
2
157
7 Oct 2025
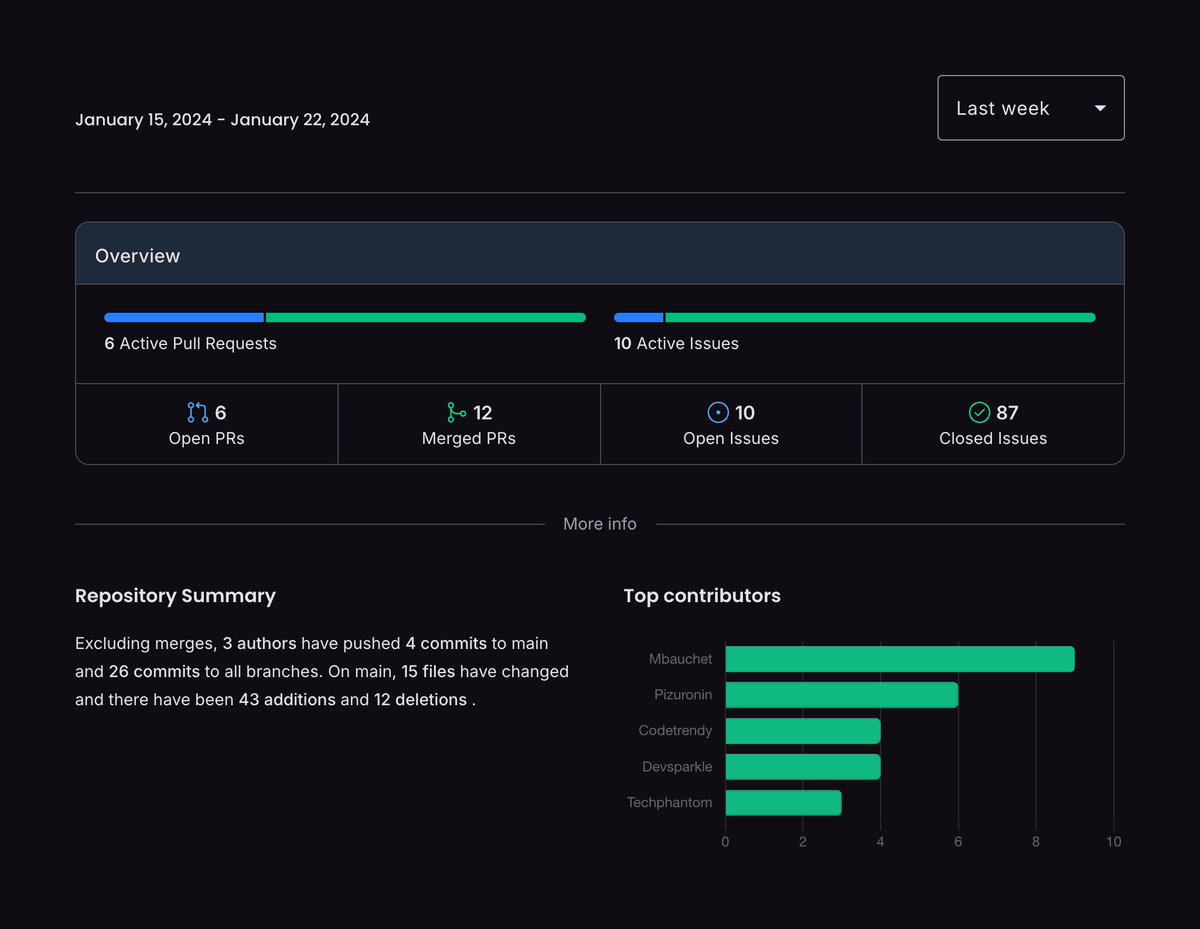
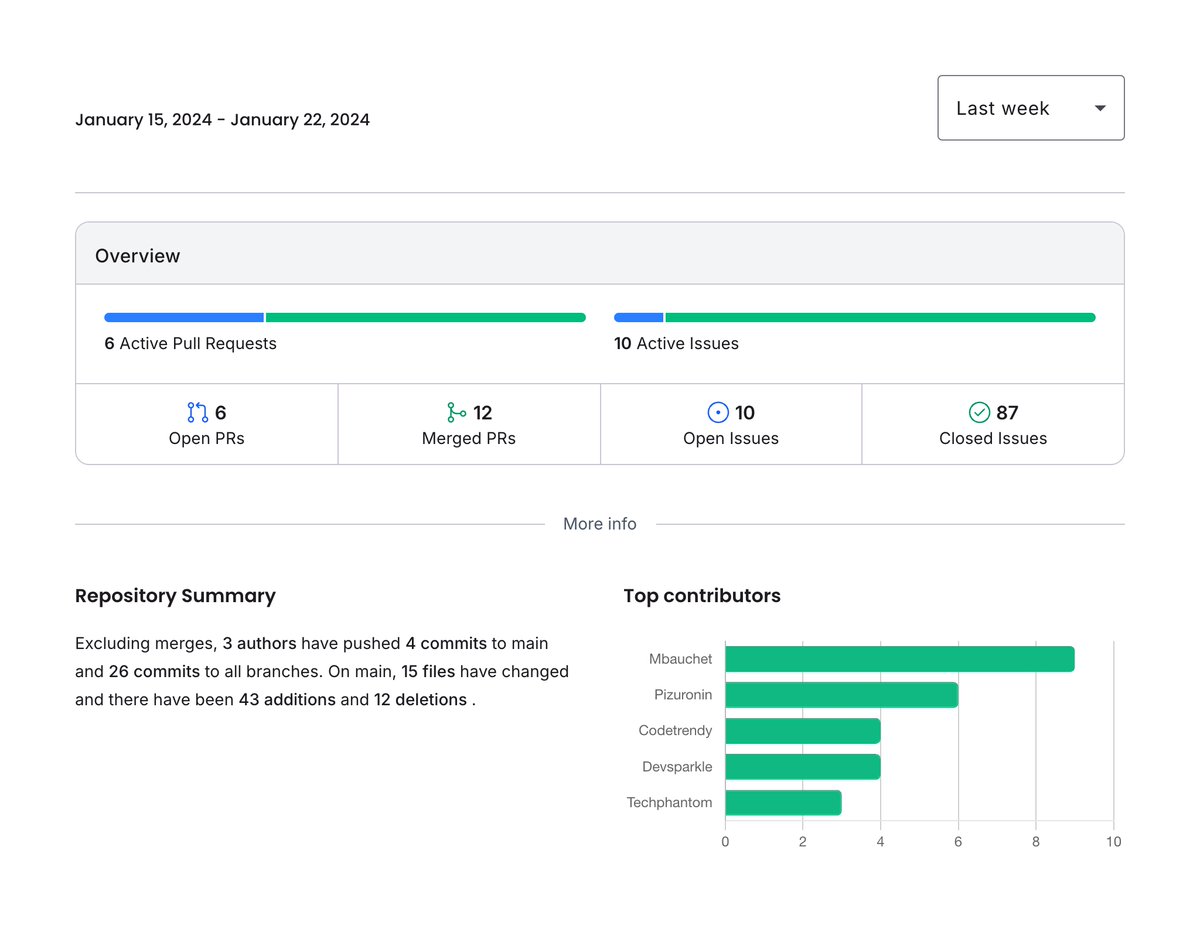
Visualize your repo's health at a glance. ✨
Our "Repository Statistics" composition combines KPI cards, progress bars, and a "Top Contributors" chart into the ultimate developer dashboard.
ui.angular-material.dev/bloc…
#AngularMaterial #UIUX
7 Oct 2025
Hey Engineering Managers & Team Leads! 👋
Todays Featured Block is "Repository Statistics" dashboard. A complete overview of PRs, issues, commits, and top contributors in one clean view.
Perfect weekly summary for your team.
ui.angular-material.dev/bloc…
#Angular #DevOps #Dashboard

1
2
120
6 Oct 2025
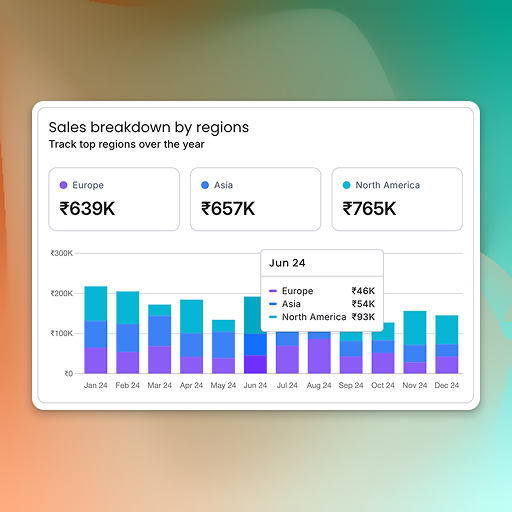
Looking for sales dashboard inspiration? Check out our "Sales Breakdown by Region" block.
It features: ✅ Summary stat cards per region ✅ A stacked bar chart for monthly trends ✅ Interactive tooltips
ui.angular-material.dev/bloc…
#AngularMaterial #UIUX
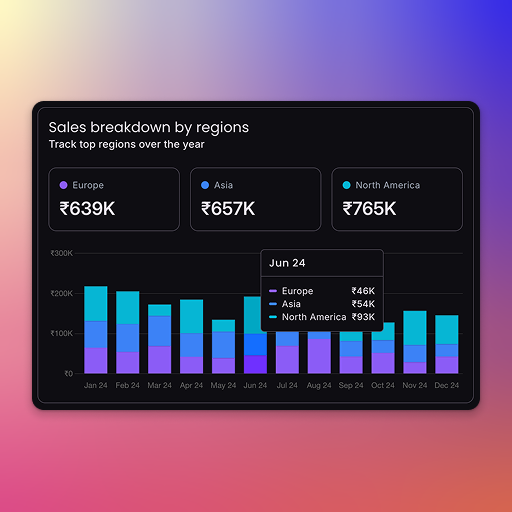

6 Oct 2025
Today's Feature Block: A perfect "Sales Breakdown" chart. ✨
We love this design because it combines high-level KPI cards with a detailed stacked bar chart. It gives you the big picture and the deep dive, all in one view.
ui.angular-material.dev/bloc…
#Angular #DataViz #Dashboard

2
3
247
5 Oct 2025
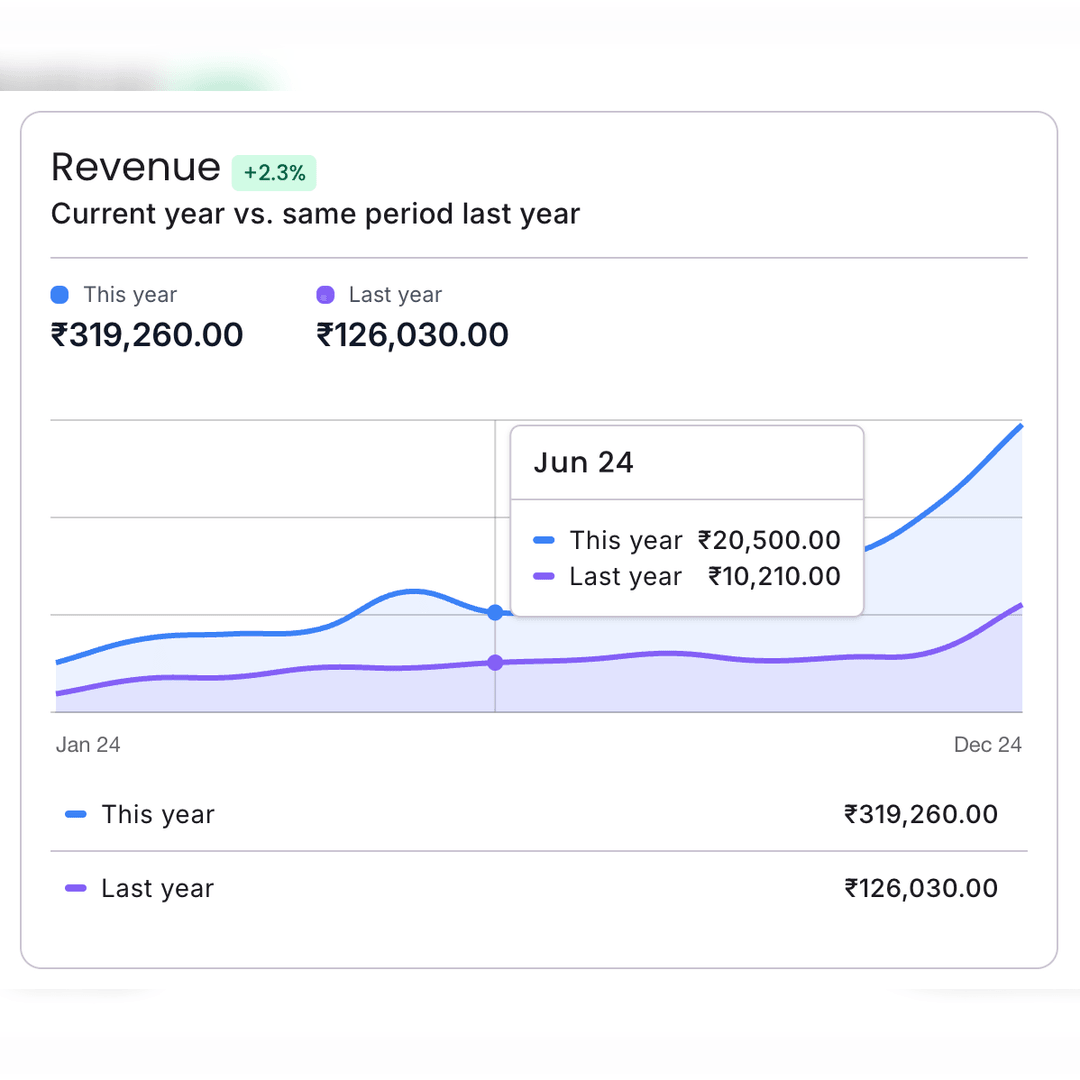
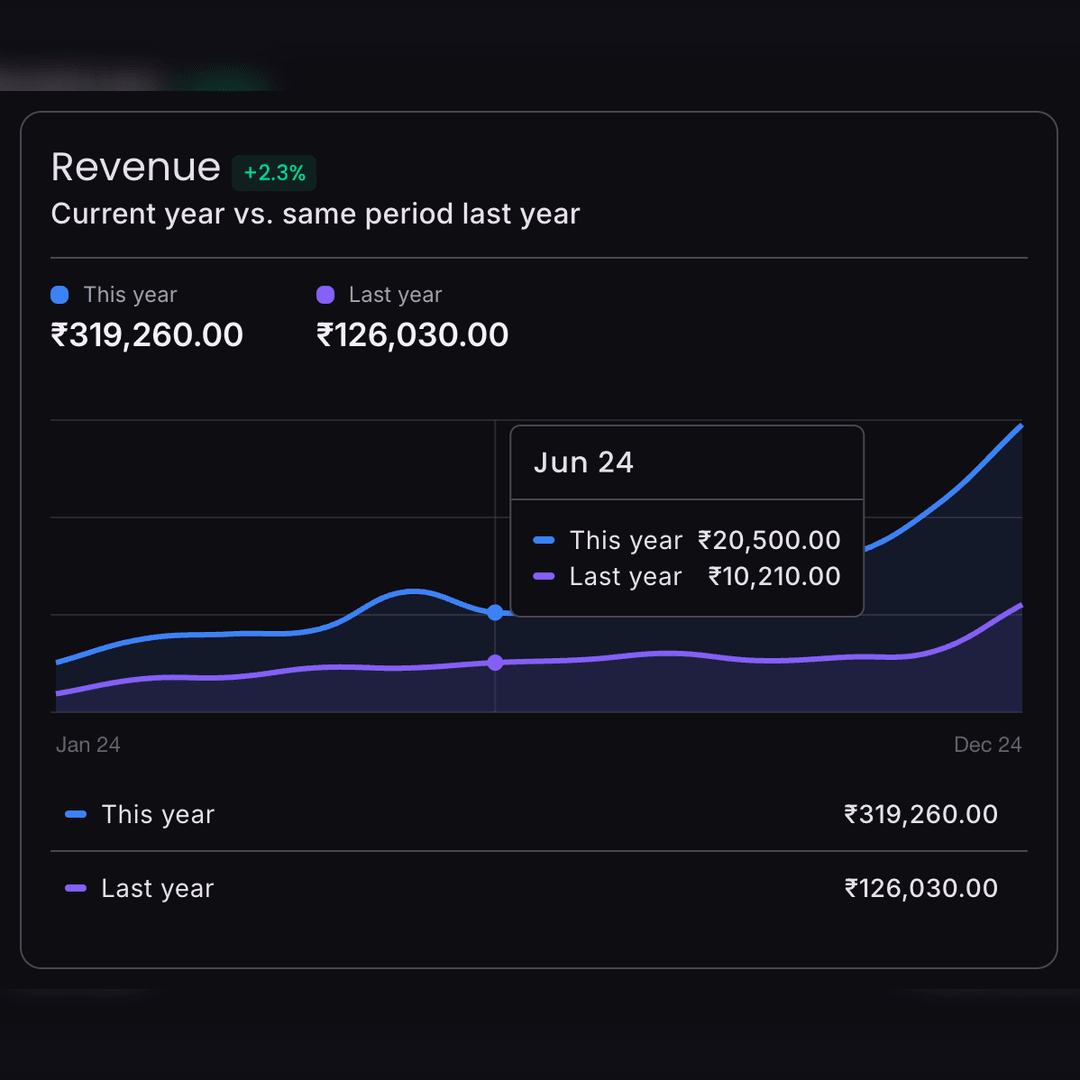
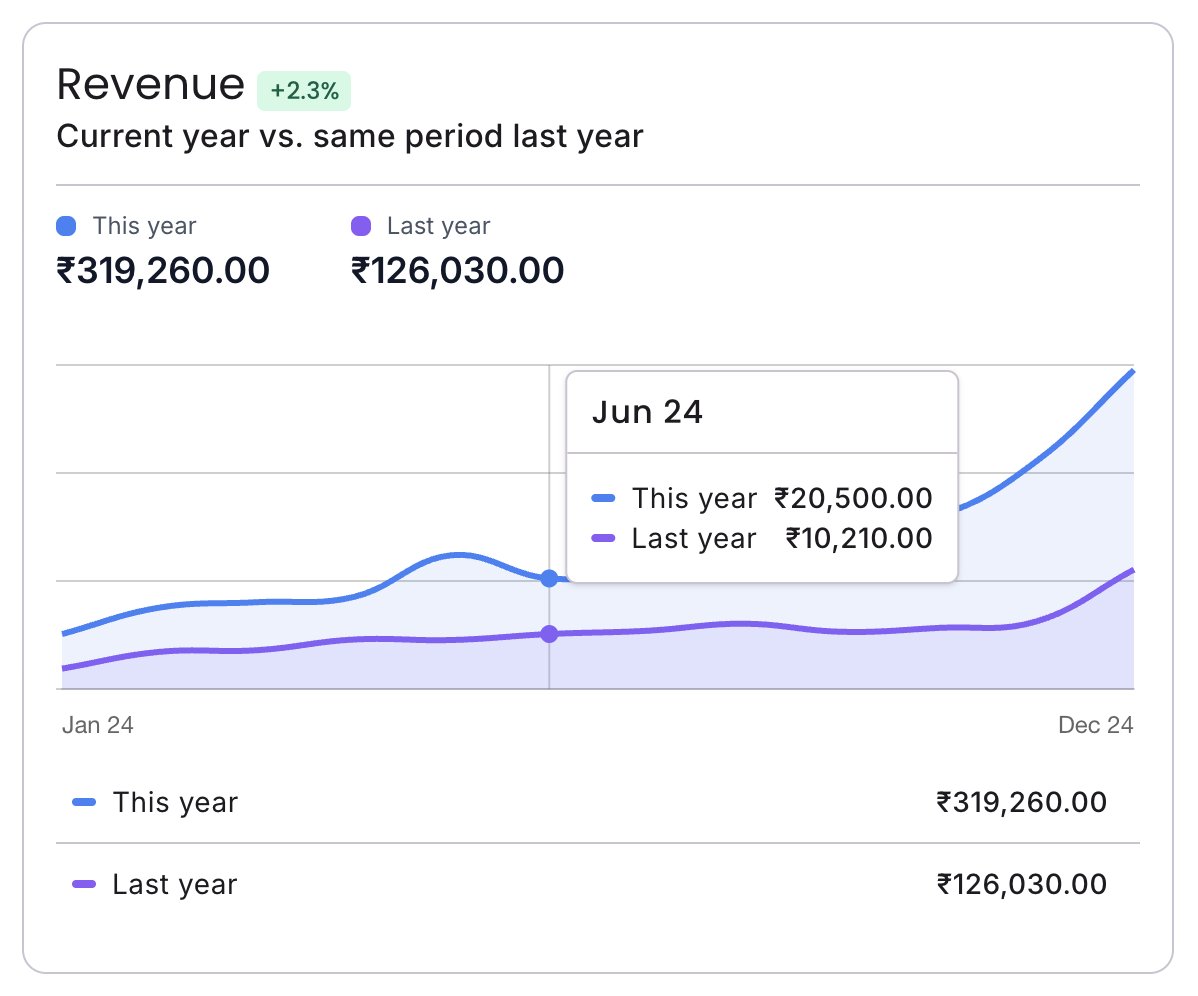
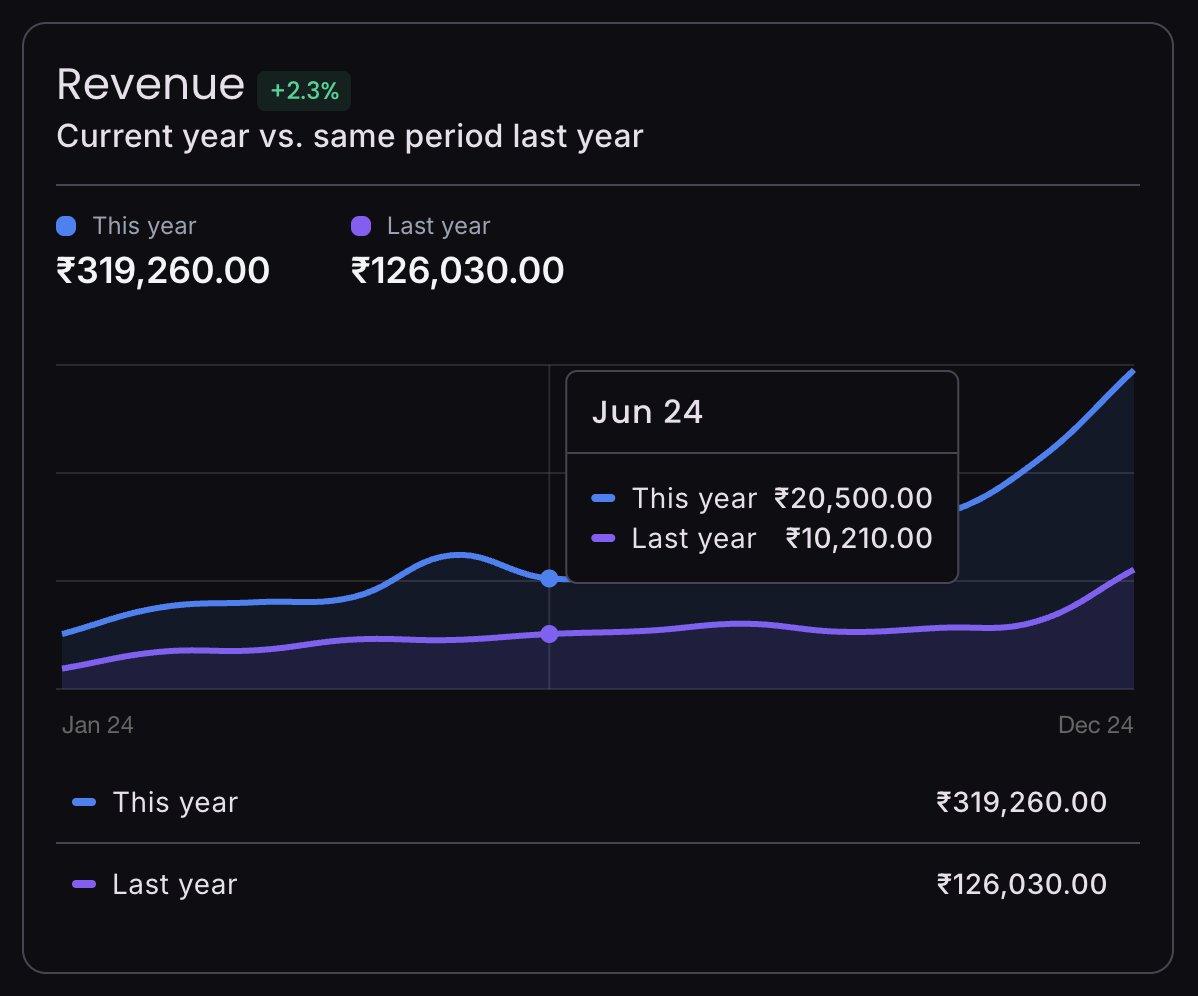
Small interactions that make a chart great.
Our Block of the Day is this Revenue Comparison Chart, featuring a smooth hover line and a custom tooltip that gives users the exact data they need, right when they need it.
👉 ui.angular-material.dev/bloc…
#AngularMaterial #Dashboard
5 Oct 2025
✨ Block of the Day: The Revenue Comparison Chart!
Perfect for showing year-over-year performance. We love the details in this:
✅ Clean light-dark themes
✅ Vertical hover line for easy tracking
✅ Custom tooltip
See it live: ui.angular-material.dev/bloc…
#Angular #DataViz #UIUX
2
2
184
4 Oct 2025
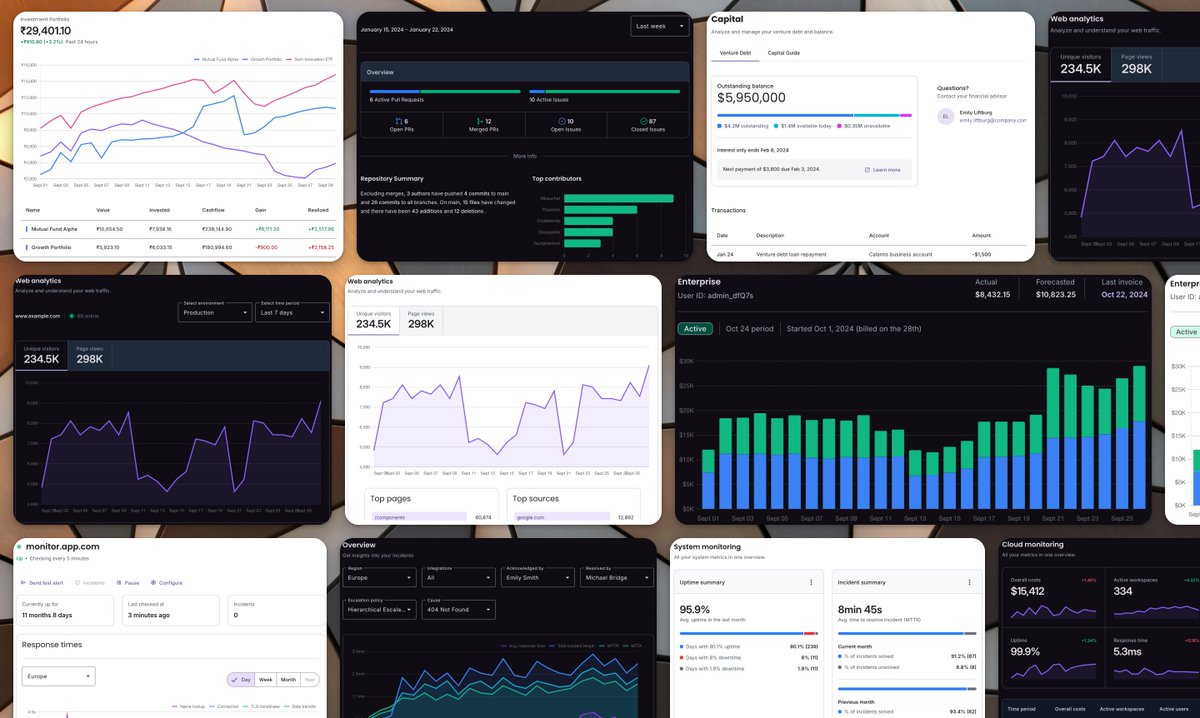
Don't just build charts. Build full dashboards 🚀
Our new Chart Composition blocks are live! These are complete, real-world layouts for analytics, monitoring, and financial UIs
The fastest way to feature-rich dashboard: ui.angular-material.dev/bloc…
#AngularMaterial #UIUX #Dashboard
4 Oct 2025
The final piece of the puzzle is here. We saved the best for last. ✨
Introducing Chart Compositions: complete, dashboard-ready layouts that bring all our chart blocks together with stats, tables, and filters.
ui.angular-material.dev/bloc…
#Angular #DataViz

2
4
166
1 Oct 2025
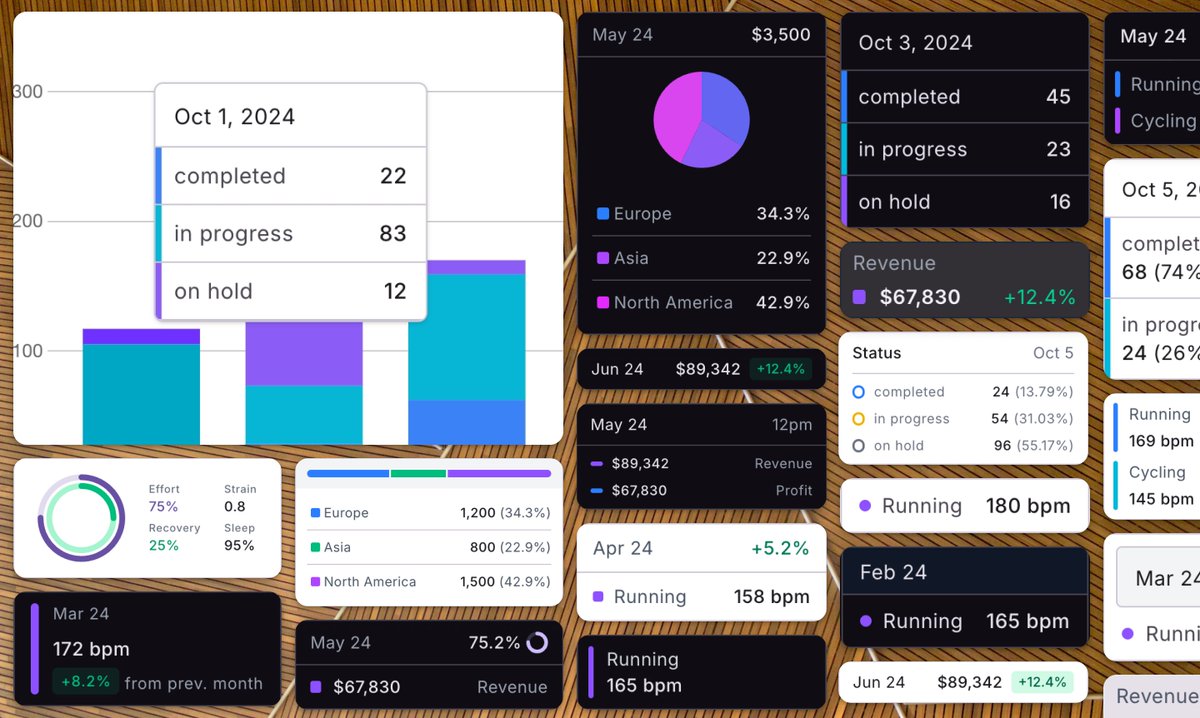
New Blocks Alert! 🚀 A beautiful collection of Chart Tooltips is now live.
From simple labels to detailed data breakdowns, we've got a tooltip style for every chart you build.
See all the examples: ui.angular-material.dev/bloc…
#AngularMaterial #WebDev #Charts
1 Oct 2025
It's all in the details. ✨
We've just launched a new collection of Chart Tooltip blocks! A huge variety of designs to make your charts more interactive and informative.
The perfect finishing touch for your dashboards: ui.angular-material.dev/bloc…
#Angular #UIUX #DataViz

2
2
133
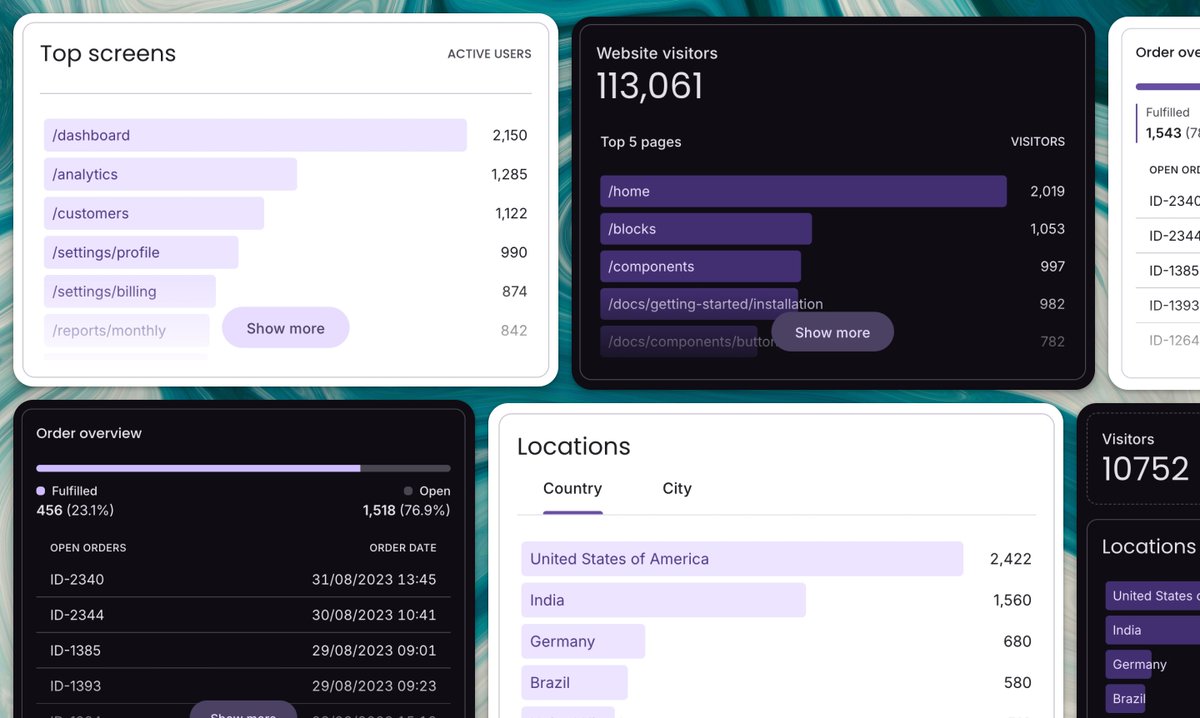
1 Oct 2025
Sometimes, the simplest chart is the most effective.
Our new Bar List blocks are now live, making it incredibly easy to visualize your top-performing items at a glance. Perfect for any dashboard.
See the demos: ui.angular-material.dev/bloc…
#AngularMaterial #UIUX #Dashboard

30 Sep 2025
Rank your data beautifully. ✨
Introducing our new collection of Bar List blocks! The perfect way to show ranked data like top screens, locations, or order statuses in a clean, visual format.
Explore them all: ui.angular-material.dev/bloc…
#Angular #DataViz #UI
2
4
222
30 Sep 2025
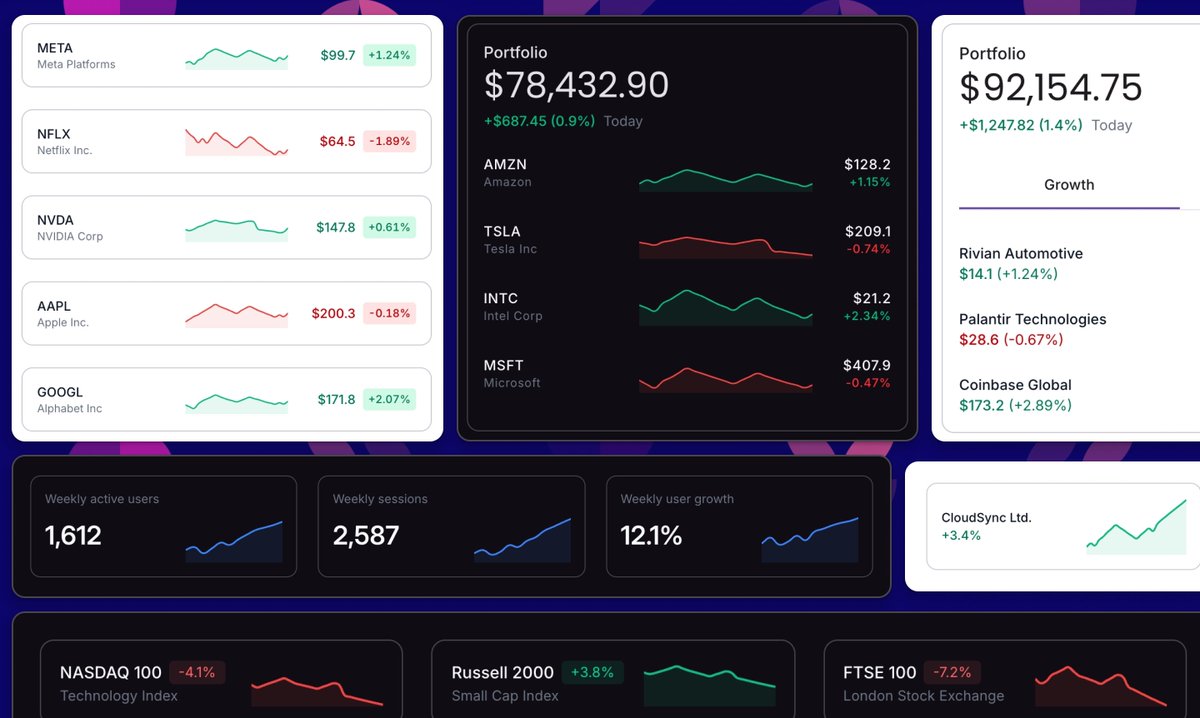
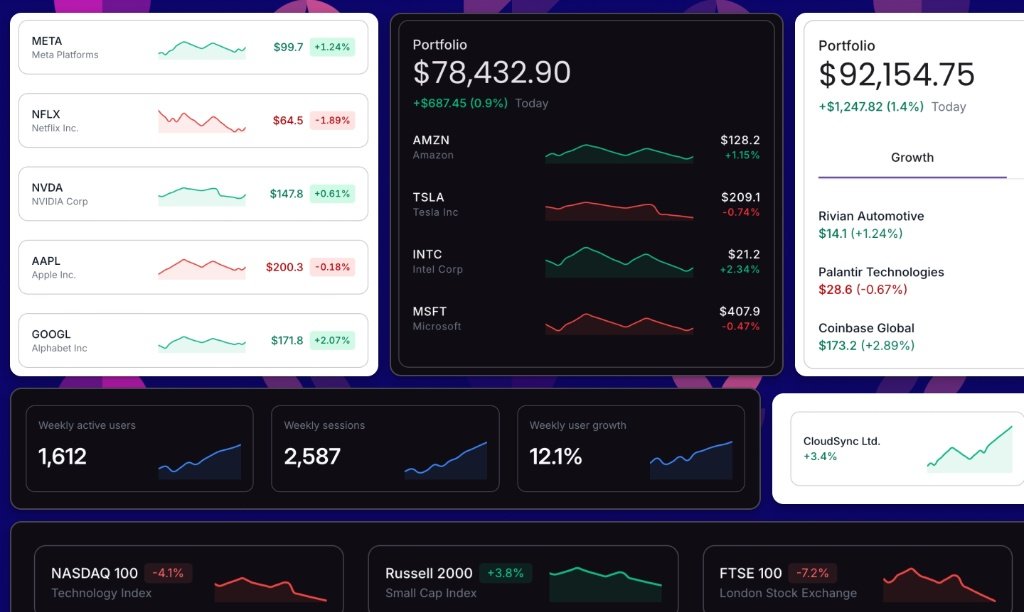
New Blocks Alert! 🚀 A beautiful collection of Spark Area Charts is now available.
These compact, minimalist charts are perfect for adding trendlines to your data without taking up too much space.
See all the examples: ui.angular-material.dev/bloc…
#AngularMaterial #WebDev #Charts
29 Sep 2025
Build denser, more powerful dashboards. ✨
Our new Spark Area Chart blocks are now live! Perfect for showing at-a-glance trends in stock lists, portfolios, and KPI summaries.
Upgrade your dashboards: ui.angular-material.dev/bloc…
#Angular #DataViz #UIUX
2
2
102
26 Sep 2025
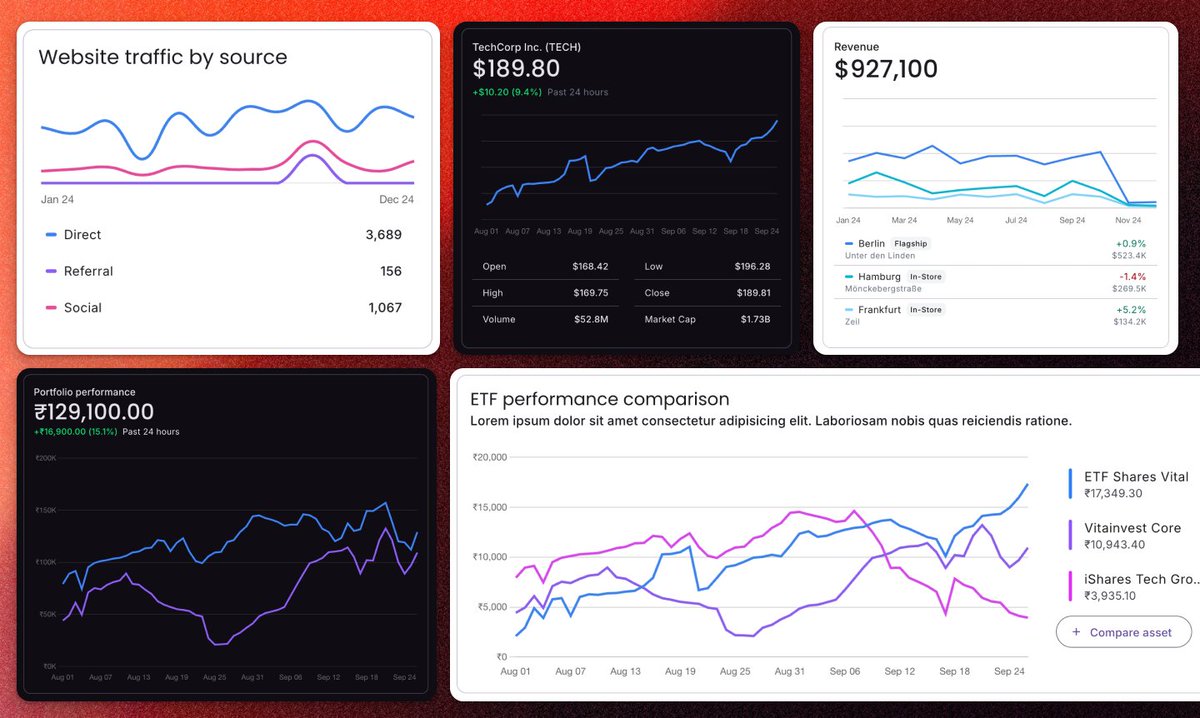
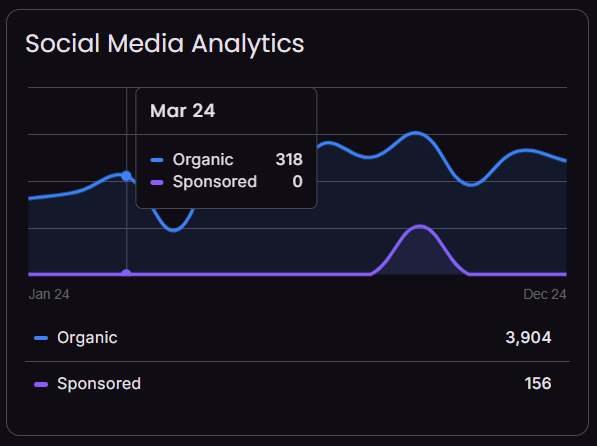
Track your trends in style. ✨
Our new Line Chart blocks are now live! A versatile collection to build beautiful dashboards for financial, marketing, or performance analytics.
See the full collection: ui.angular-material.dev/bloc…
#AngularMaterial #UIUX #Charts

26 Sep 2025
Ending the week on a high note! 📈
We just launched a new collection of Line Chart blocks. Perfect for tracking website traffic, portfolio performance, revenue, and more.
Your weekend project just got an upgrade!
Explore them all: ui.angular-material.dev/bloc…
#Angular #DataViz
2
3
158
25 Sep 2025
Turn your data into insights. ✨
Our new Area Chart blocks make it easy to add stunning, interactive data visualizations to your dashboards. Powered by ng2-charts and available in light & dark modes.
ui.angular-material.dev/bloc…
#AngularMaterial #UIUX #DataVisualization
22 Sep 2025
It’s live! 🚀 Our new collection of Area Chart blocks is here.
Visualize your data with a huge variety of styles for analytics, monitoring, financial dashboards, and more. Interactive, beautiful, and ready for your Angular app.
ui.angular-material.dev/bloc…
#Angular #DataViz #Charts

2
5
278
24 Sep 2025
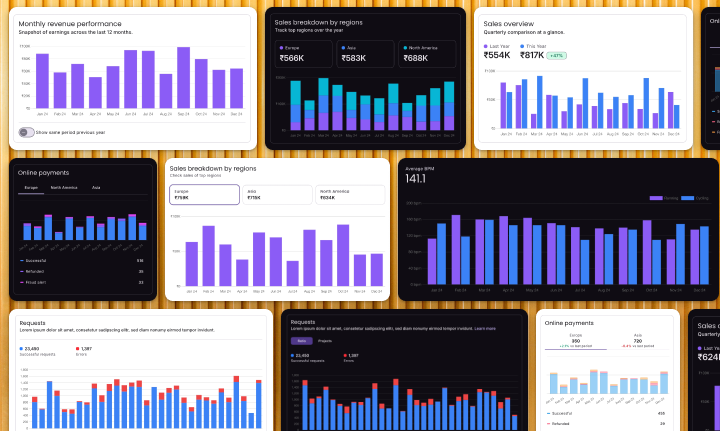
From monthly revenue to sales by region, bar charts tell a powerful story.
Our new collection of Bar Chart blocks for Angular makes it easy to tell that story beautifully. Available in a variety of styles and themes.
👉 ui.angular-material.dev/bloc…
#AngularMaterial #UIUX #Dashboard

24 Sep 2025
Data visualization just got another major upgrade! 📊
Introducing our new collection of Bar Chart blocks. Includes stacked, grouped, and standard bar charts perfect for any dashboard.
Explore all the new charts: ui.angular-material.dev/bloc…
#Angular #DataViz #Charts #UI
2
4
127
20 Sep 2025
✨ New blocks are coming to Angular Material Blocks → Area Charts powered by Chart.js ng2-charts.
✅ Light/Dark mode
✅ Vertical hover lines
✅ Custom tooltips
💯 Fully customizable
👉 ui.angular-material.dev
#Angular #AngularMaterial #Charts #Analytics #Dashboard
2
2
349