1

Jun 15
#Bitcoin #BTC #BTCUSD #BitcoinAnalysis #Crypto #TechnicalAnalysis #BTCChart #CryptoTrading #TradingView #BTCPrice
BTC bounced from my last tweet where I mentioned bottom.

17

Apr 28
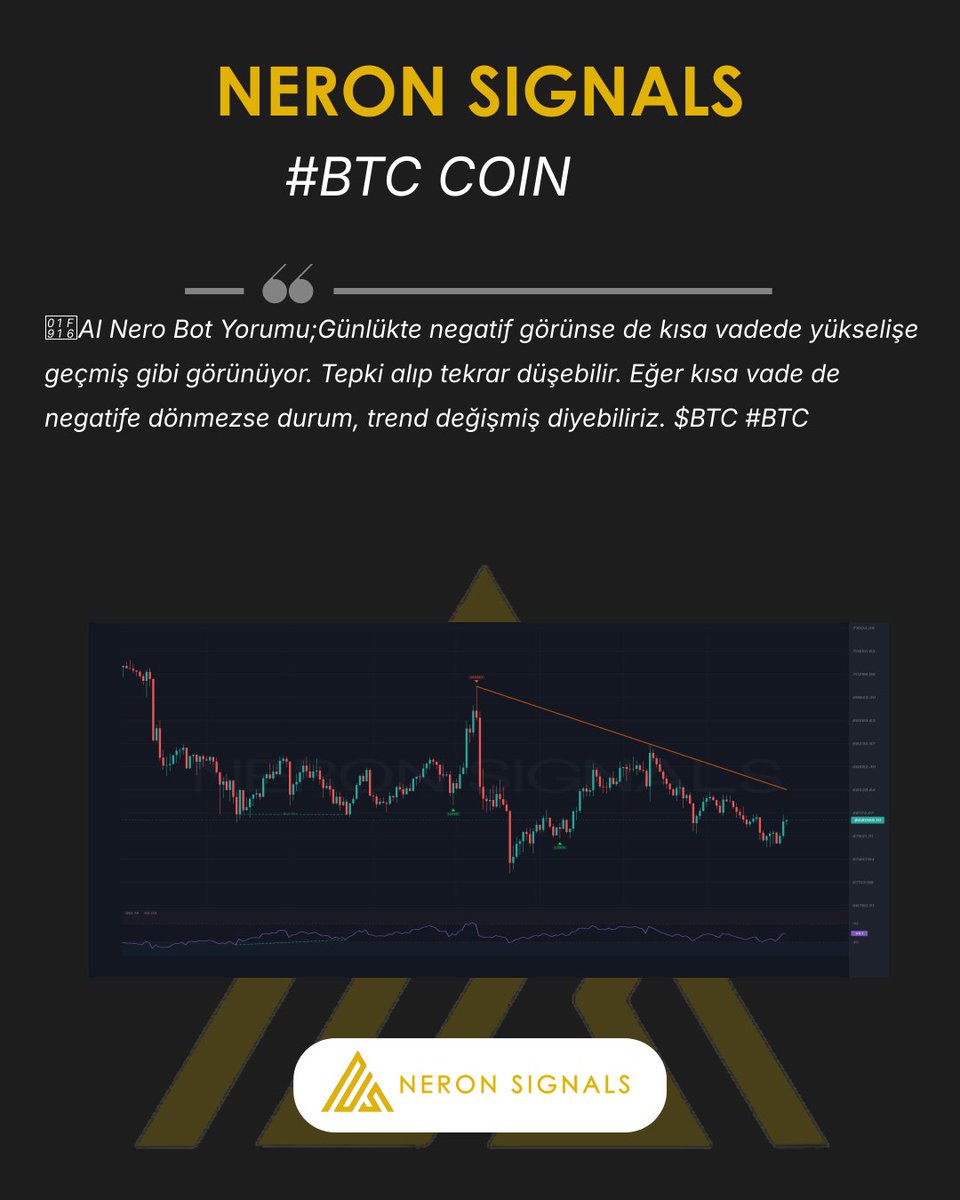
✅BTC Daily Chart Analysis 📷
The picture looks pretty clear right now:
• $80K = Major Zone holding strong
• $85K = Sitting right at the 200MA
• Decision window likely by End of May
• $97K = Must reclaim to flip the macro structure bullish
Bottom Line:
Long Term: Bullish ✅
Near Term: ~65% probability of another leg down toward $60K cycle bottom
Who else is watching this range closely? 👀
#Bitcoin #BTC #Crypto #BitcoinPrice #BTCChart #CryptoAnalysis #BullMarket
@trades2g curious your thoughts my friend since your the TA Guy?
3
13
671

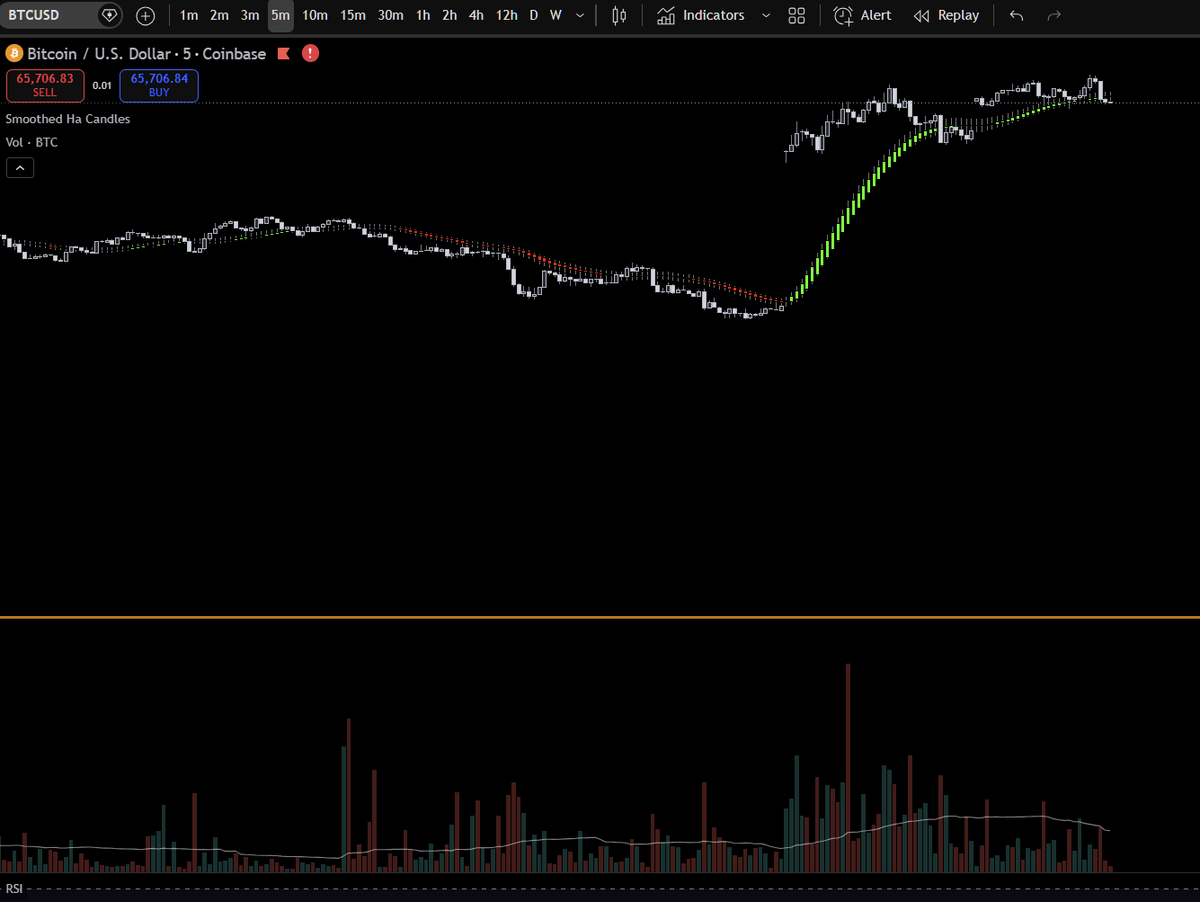
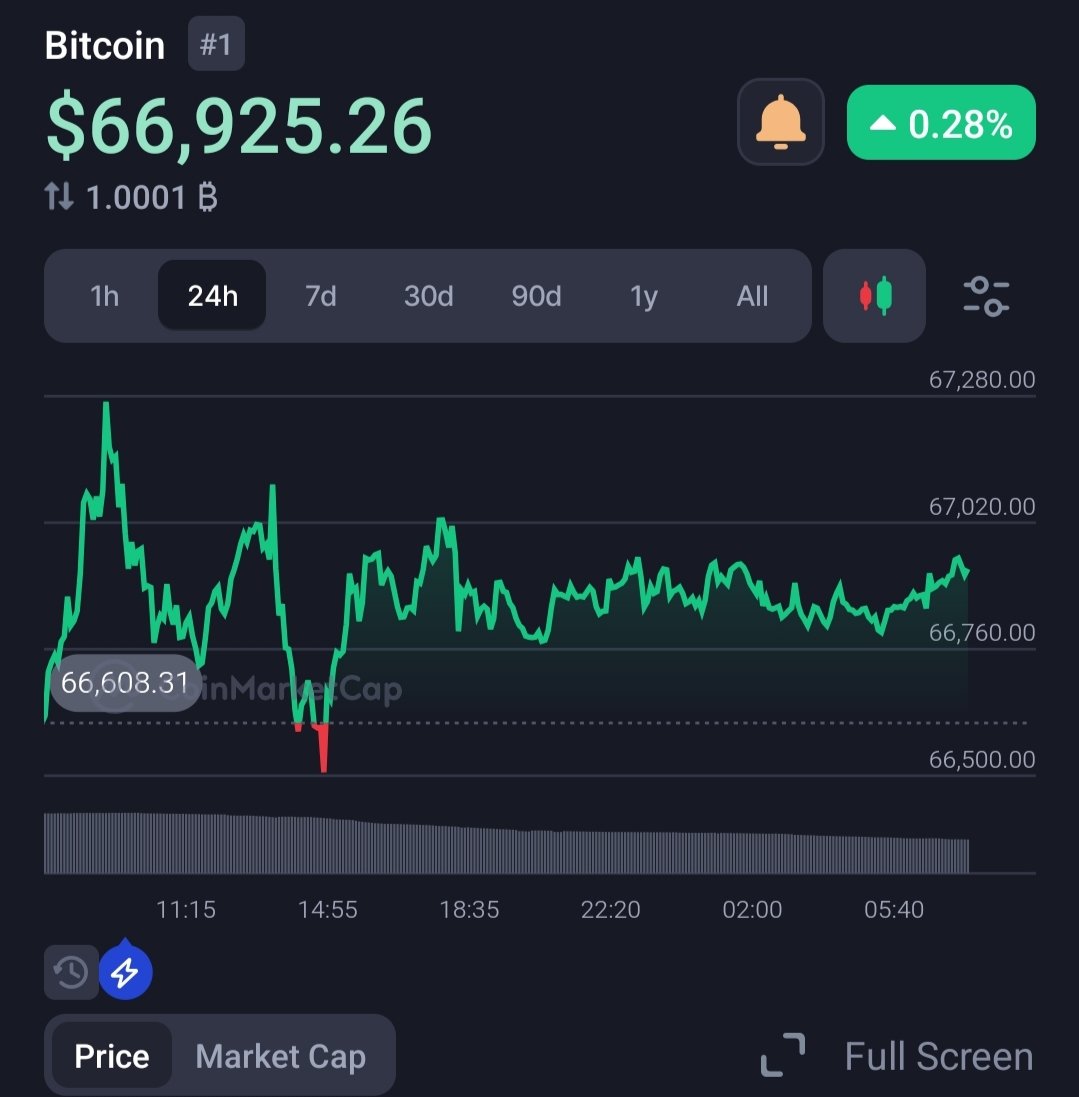
🚨 Bitcoin at $66,925 right now 🔥
After that sharp red candle dip this morning, BTC fought back hard and is stabilizing green at 0.28% on the 24h chart.
This is the kind of quiet strength that separates the real ones from the noise.
The king refuses to break.
Are you buying this dip or holding tight? Drop your move 👇
#Bitcoin #BTC #Crypto #BitcoinPrice #HODL #BTCChart #CryptoMarket #BitcoinNews
2
5
33

Mar 23
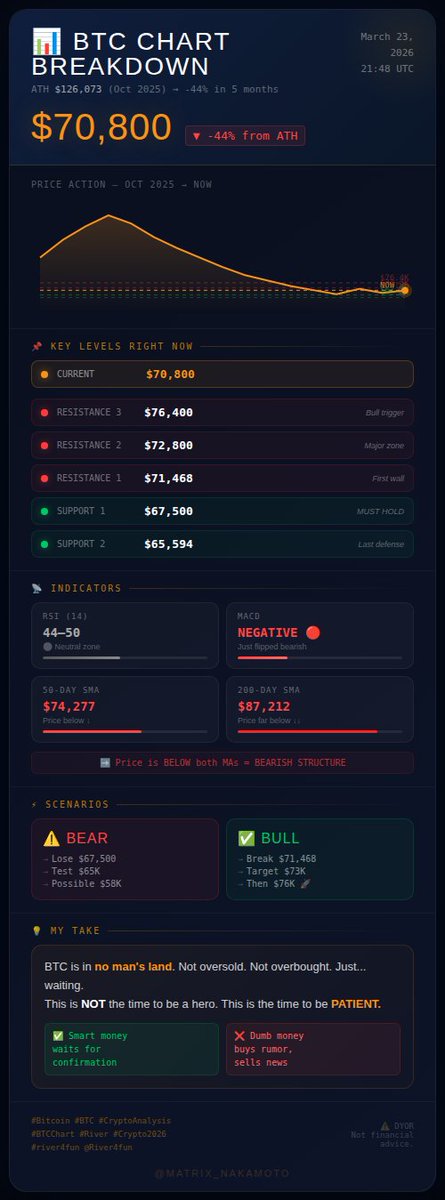
📊 BTC CHART BREAKDOWN — March 23, 2026
🔴 Current Price: ~$70,800
📉 ATH was $126,073 (Oct 2025)
That's a -44% DROP in 5 months.
━━━━━━━━━━━━━━━━
📌 KEY LEVELS RIGHT NOW:
━━━━━━━━━━━━━━━━
🟢 Support 1: $67,500 ← MUST HOLD
🟢 Support 2: $65,594 ← Last defense
🔴 Resistance 1: $71,468 ← First wall
🔴 Resistance 2: $72,800 ← Major zone
🔴 Resistance 3: $76,400 ← Bull trigger
━━━━━━━━━━━━━━━━
📡 WHAT THE INDICATORS SAY:
━━━━━━━━━━━━━━━━
• RSI: 44–50 → Neutral zone ⚪
• MACD: Just turned NEGATIVE 🔴
• 50-day SMA: $74,277
• 200-day SMA: $87,212
➡️ Price is BELOW both MAs = bearish structure
━━━━━━━━━━━━━━━━
🧠 WHAT THIS MEANS:
━━━━━━━━━━━━━━━━
BTC is in no man's land.
Not oversold. Not overbought.
Just... waiting.
The MACD flipping red is the dangerous signal.
Every time it did this since October 2025?
Price dumped hard after.
⚠️ Scenario 1 — BEAR:
Lose $67,500 → test $65K → possible $58K
✅ Scenario 2 — BULL:
Break $71,468 → $73K → $76K → game on
━━━━━━━━━━━━━━━━
💡 MY TAKE:
━━━━━━━━━━━━━━━━
This is NOT the time to be a hero.
This is the time to be PATIENT.
Smart money waits for confirmation.
Dumb money buys the rumor, sells the news.
Which one are you? 👇
#Bitcoin #BTC #CryptoAnalysis #BTCChart #River #Crypto2026
#river4fun @River4fun
⚠️ DYOR — Not financial advice.
1
1
3
1,426

Mar 20
COVID Crash. LUNA. FTX. ETF Zulassung. Was kommt als nächstes?
Der Bitcoin Chart zeigt die Ereignisse. Die eigentliche Frage ist, wie man auf solche Ereignisse reagiert und ob ein Portfolio auch auf kommende Marktphasen vorbereitet ist.
COVID Crash.
LUNA Kollaps.
FTX Zusammenbruch.
ETF Zulassung.
Halving.
US Wahl.
Die letzten Jahre haben gezeigt, wie schnell sich Marktphasen drehen können. Euphorie und Panik liegen oft nur wenige Wochen auseinander. Genau dort trennt sich reines Investieren von strukturiertem Risikomanagement.
Bei Tradoo bauen wir keinen weiteren Hype Case. Wir bauen einen Risk und Strategy Layer, der Portfolios in unterschiedlichen Marktphasen strukturiert steuern soll. Nicht auf Basis von Bauchgefühl, sondern mit klaren Regeln, Risikologik und dezentraler Nutzerhoheit.
Unser Anspruch ist klar.
Investorengelder nicht nur auf Wachstum auszurichten, sondern sie in Stressphasen besser zu schützen und gleichzeitig die Kontrolle beim Nutzer zu belassen.
In unserem Investor Roundtable zeigen wir live, wie unsere Engine auf historische Marktereignisse reagiert hätte und weshalb dezentrale Infrastruktur, klare Risikorahmen und systematische Entscheidungen in diesem Markt immer wichtiger werden.
Wer verstehen will, wie modernes digitales Asset Management künftig aussehen kann, ist herzlich eingeladen.
Jetzt zum Investor Roundtable anmelden: investors.tradoo.finance/
#BTCChart #Luna #FTX #USA #trump #tradoo

2
4
130


Mar 9
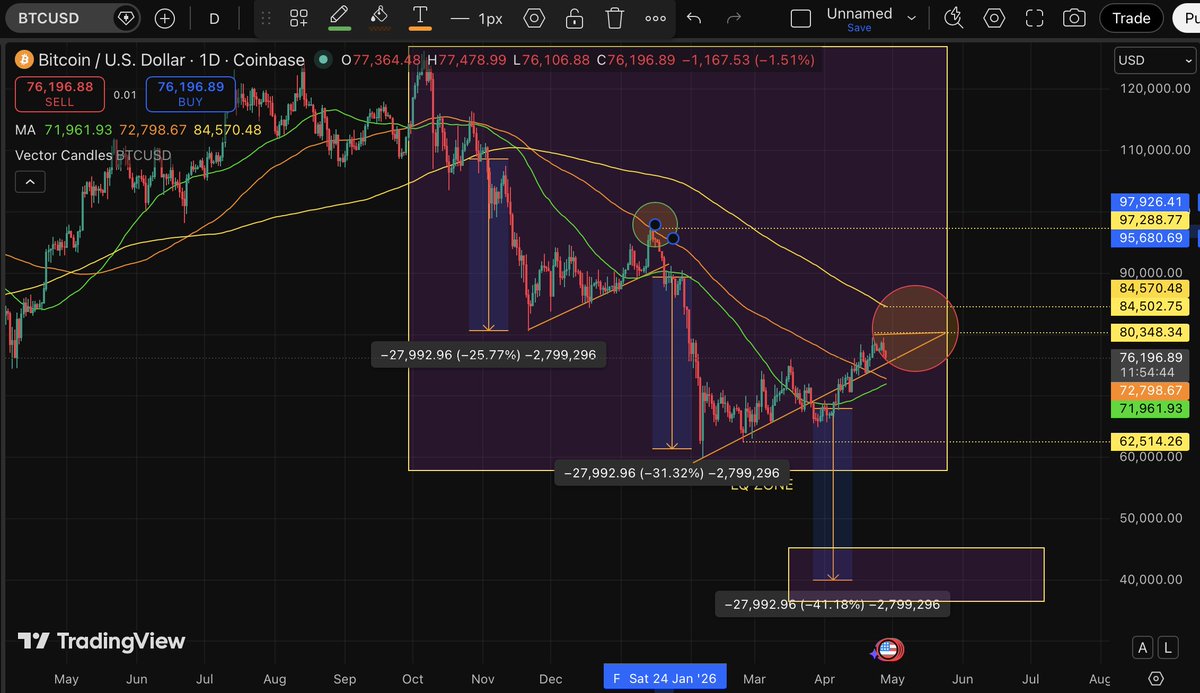
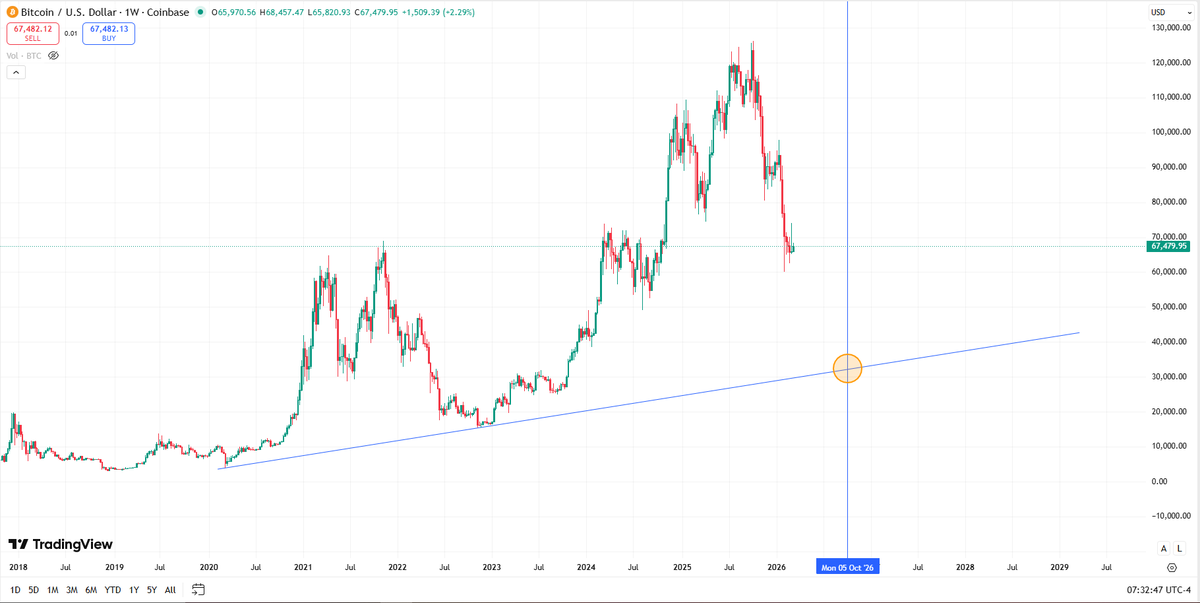
Oct 5, 2026 — 3:00 AM
Bitcoin potentially touching the macro trendline…
and I’ll probably be asleep instead of buying.
The circle marks where the next real test could happen if the cycle keeps repeating.
#Bitcoin #BTC #Crypto #BitcoinCycle #BTCChart #CryptoAnalysis #TradingView
6
6
156

Mar 7
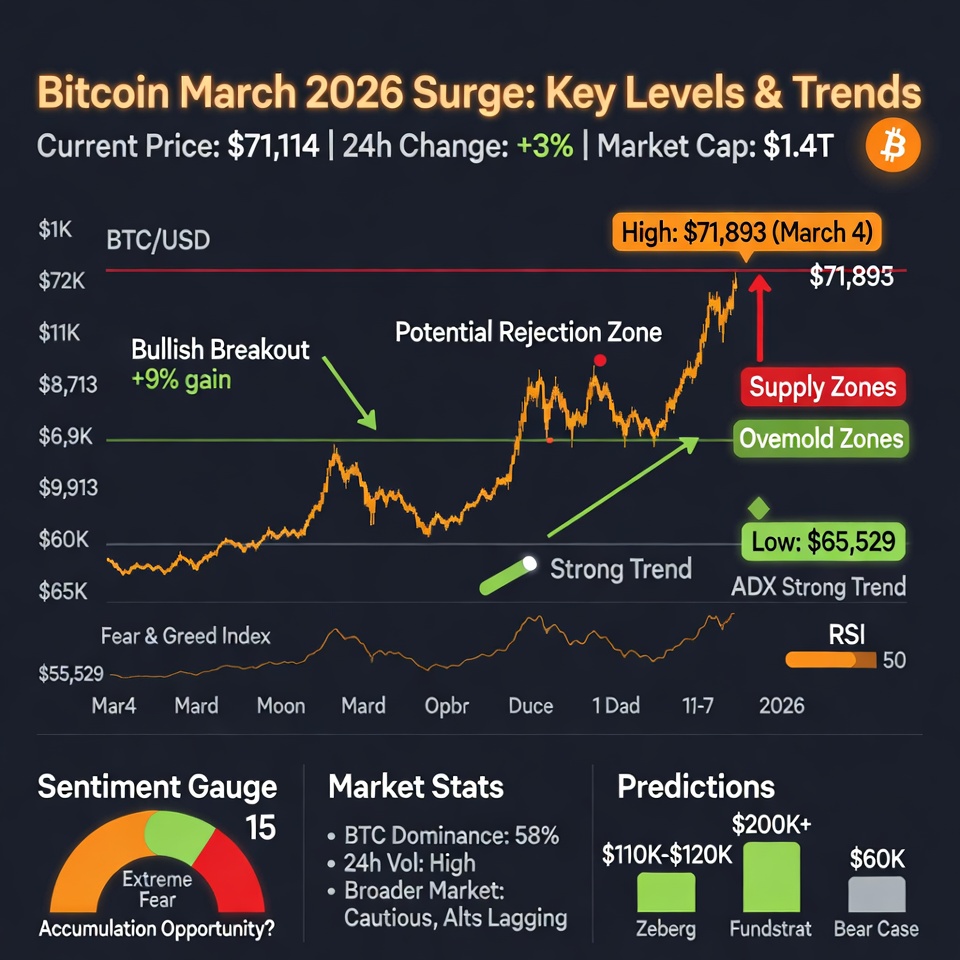
1/8 BITCOIN BREAKOUT ALERT: BTC just blasted past $70K, but the bulls are pausing for breath. Is this the start of a mega rally or a fakeout? Dive into the latest market chaos in this thread. #Bitcoin #Crypto
2/8 What happened? Bitcoin surged 4% mid-week, hitting $71,890 on March 4, fueled by fresh ETF inflows and risk-on fever. Now consolidating around $71,000. Broader crypto? Altcoins lag, total market cap at $2.34T – up but cautious.
3/8 Why it matters: This breakout flips the script from February's grind. Institutional money (think Fundstrat's $200K calls) signals BTC dominance at 58% could spark alt season. But extreme fear (Greed Index 15) means volatility ahead.
4/8 Market impact: BTC up 3% in 24h, holding above key $70K support. Dominance high – alts like ETH/XRP flat or dipping. Liquidations hit $80M shorts, but OI down 25% shows de-leveraging. Overall, market stabilizing post-rally.
5/8 Trader sentiment: Bulls excited by oversold bounces and strong pivots at $68,750. Bears warn of rejection at $72K resistance. Mixed signals – MACD bearish, RSI bullish. Extreme fear screams accumulation zone for hodlers.
6/8 Punchy levels to watch: Support $68K-$69K. Resistance $72K-$74K. Break up? $80K in sight. Dip below? Retest $65K lows. Stay sharp – volatility ATR at 386 means fast moves.
7/8 Visuals needed? Check this HD infographic dropping BTC's price action, glowing uptrend arrows, support/resistance zones, and sentiment gauge. Clear crypto vibes for quick scans. (Attach infographic here) #BTCChart
8/8 Final take: BTC's holding strong, but the market's on edge. Will we smash to $80K this March or crash back to $60K accumulation? Drop your predictions below – let's debate! #CryptoTrading
3
3
12
299


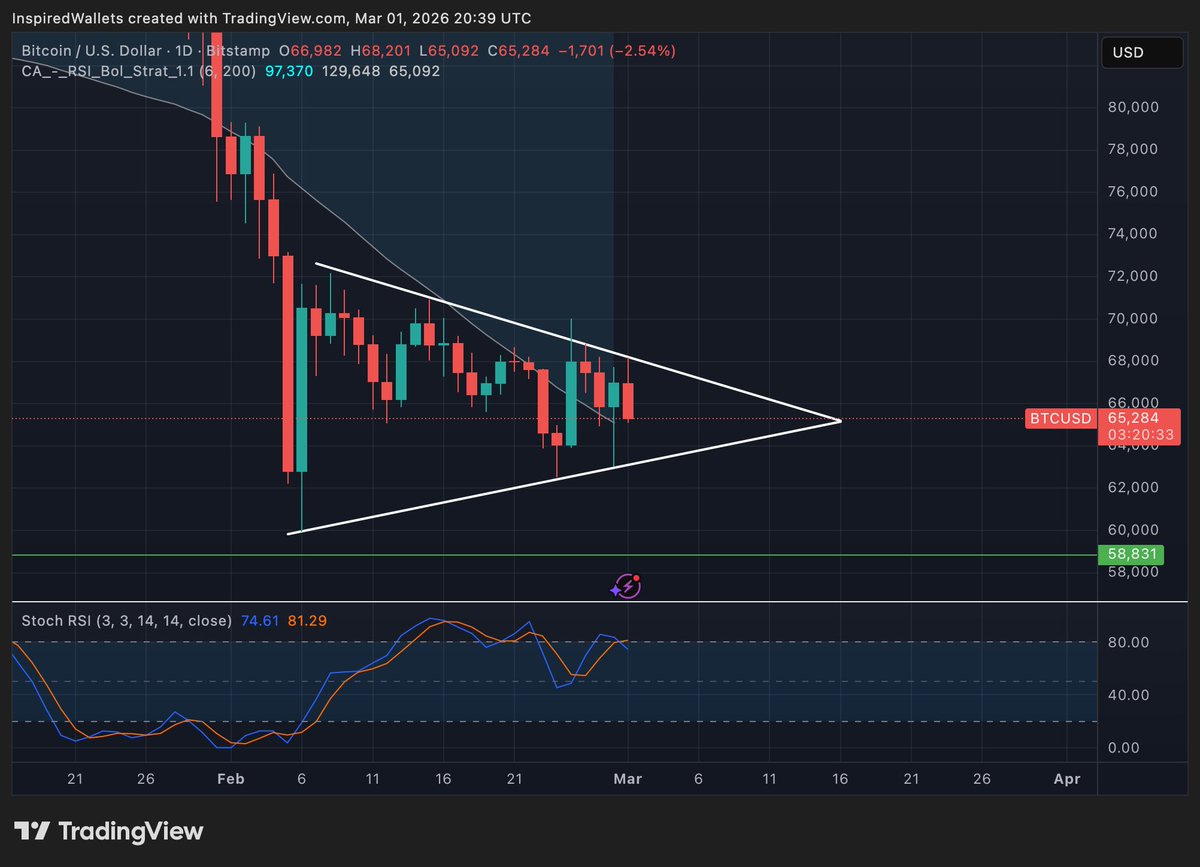
⚔️Good Morning Knights!!!
Got the $BTC weekly chart check in for you.
Been a crazy busy week but not really for bitcoin. It has just been bouncing around this wedge for weeks now. Basically since Feb 5th.
Once it breaks out it could be a clear signal as to which direction we are going in-most likely to the down side-but no one really knows.
The Daily RSI is still over bought like last week but is showing signs of it creating lower highs.
It is bullish that with the war going on #BTC hasn't had any major crashes.. as a matter of fact it went up.
Have a great day Knights.
⚔️🛡️
#bitcoin #btcchart #BitcoinKnight
ALT @TheBTCKnight
7
14
224