3 Jul 2024
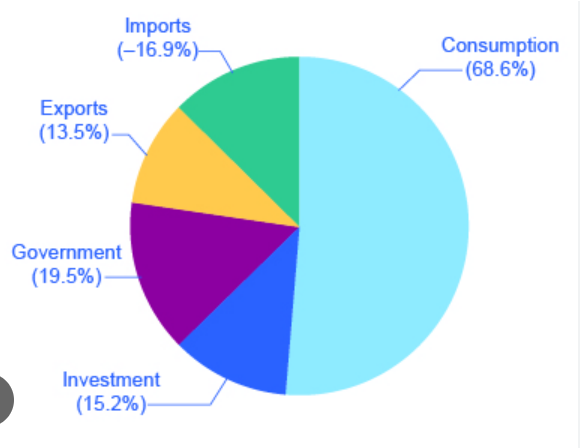
Here is a good example of #BadGraphs, regarding criminality rates in the European Union.
1
2
6
1,173


6 Jun 2024
Why would you connect points on your graph like that? How is the Chinese investment connected to the US and why would they be made into a graph of this type? #badgraphs
1
5
141

23 Feb 2024
Please Im begging you, that is not the point of the conversation.
The graph itself is fine, it does not deserve to be posted by "badgraphs" account. A 5-15% zoom would have been probably better.
You can argue that the data shown here isn't significant or whatever. (1/2)
2
1
40


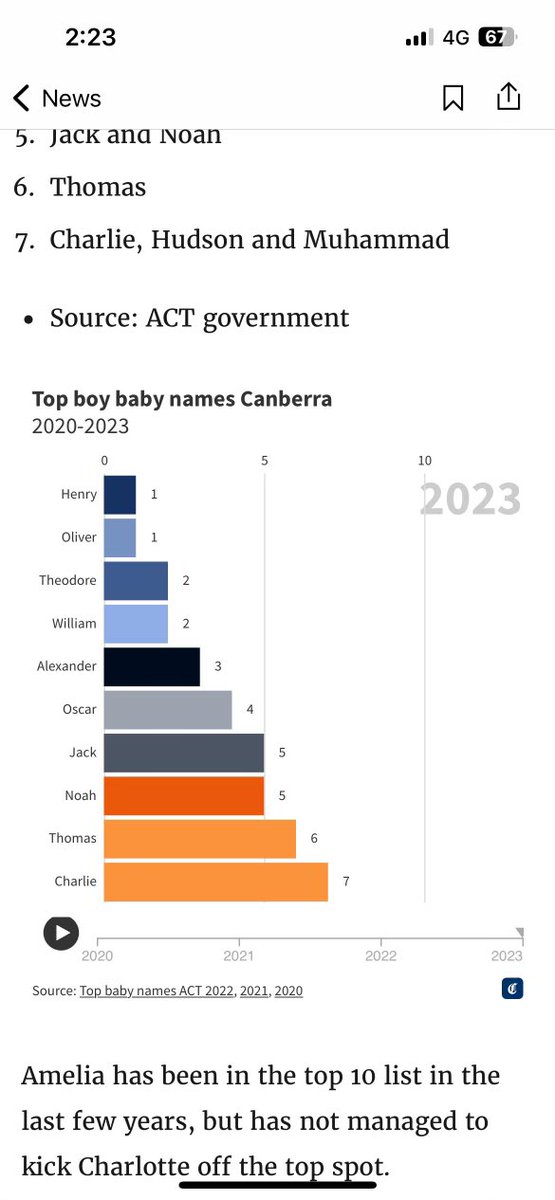
28 Dec 2023
Yes, but the real story is the disaster of a graph in The Canberra Times!
@BadGraph #badgraphs
1
2
181

23 Aug 2023
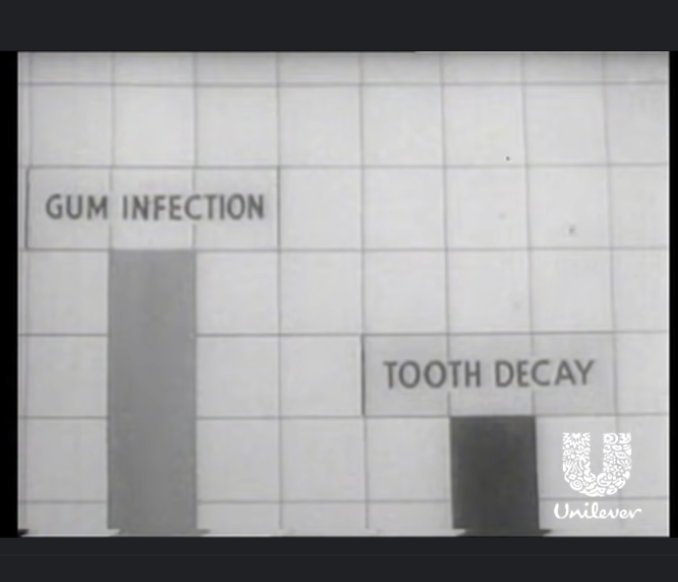
Very pleased to see that the UKs very first TV advert in 1955 (for Gibbs SR toothpaste), had dodgy graphs with this barchart with no labelled axes. Would love to say we learnt something in 70 years but no... #badgraphs youtu.be/Eeu3U0nqcpE
5
192

Love this. There’s a glancing reference to data quality in my #BadGraphs talk but not enough time to go into detail — this perfectly illustrates why it’s important!
20 Aug 2023

Chihuahua syndrome: messy data from variations in spelling or input.
The name The chihuahua syndrome is from @EdwardTufte in his new book Seeing with Fresh Eyes, based on an anecdote from Chris Groskopf @onxyfish
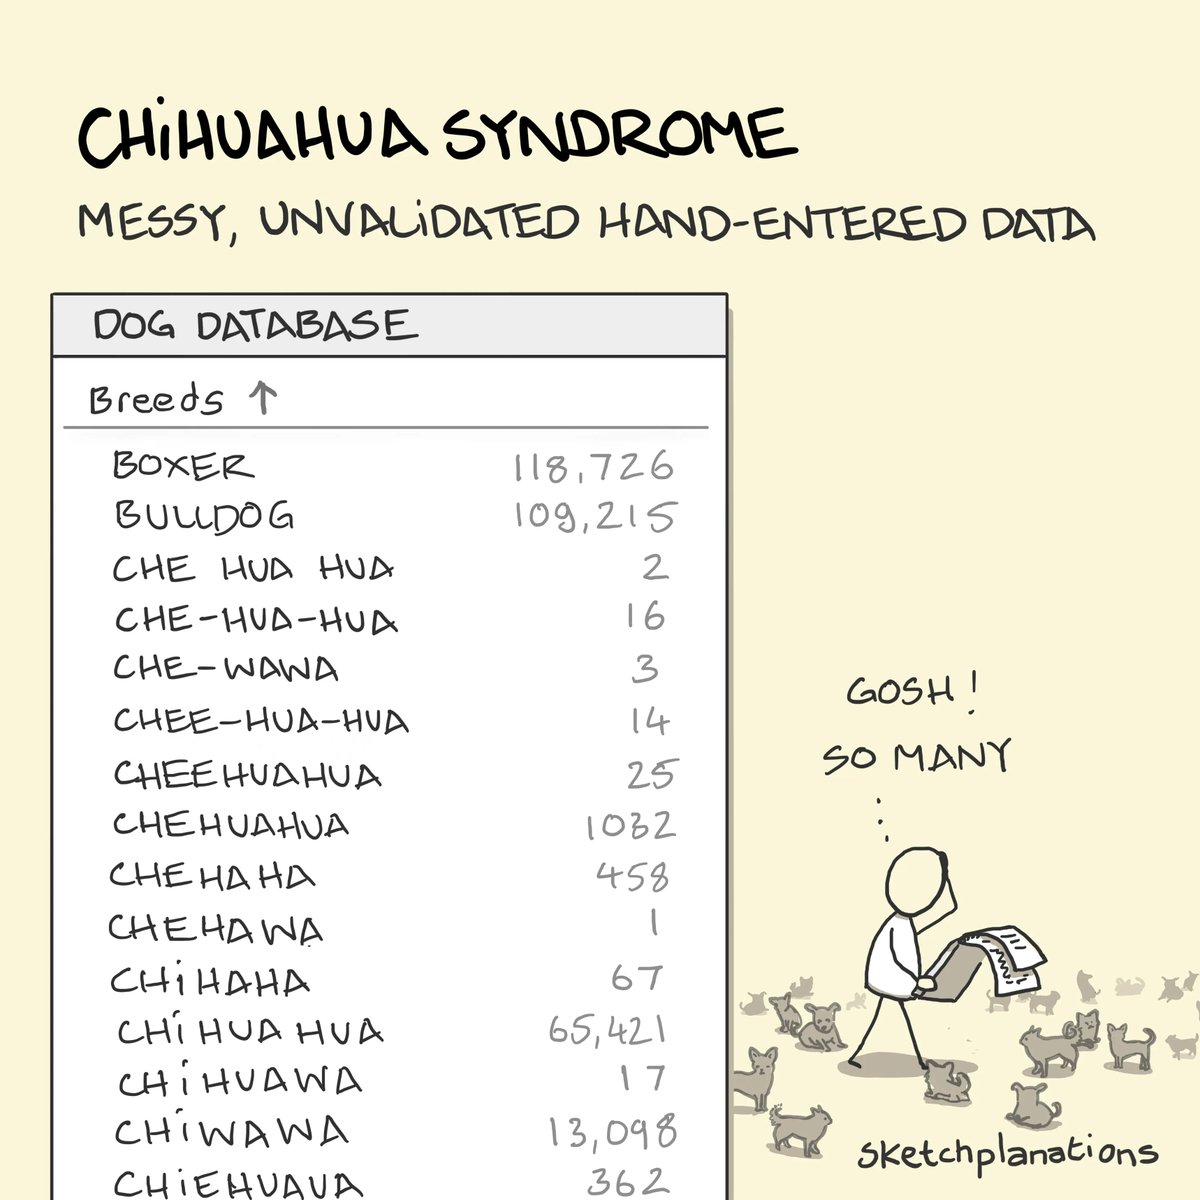
ALT Chihuahua syndrome illustration: an analyst wonders at the number of dog breeds when most of them are misspellings of chihuahua
2
208

#badgraphs made by _ _ _ _ _ _🤦

1
1
189
And thank you to everyone who came to my #BadGraphs session, participated, and laughed at my jokes. I hope it was helpful! The handout is linked from the session page on the #Editors23 website; I’m also happy to send you a copy.
3
5
384


12 May 2023
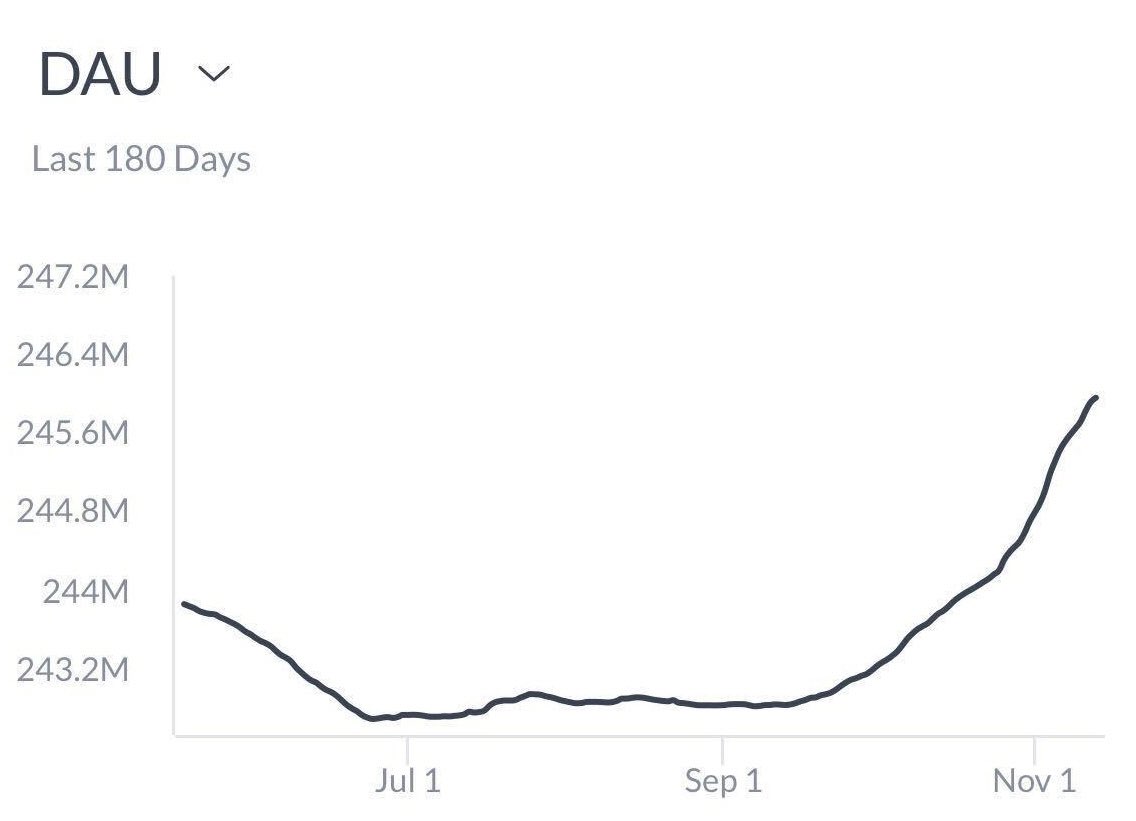
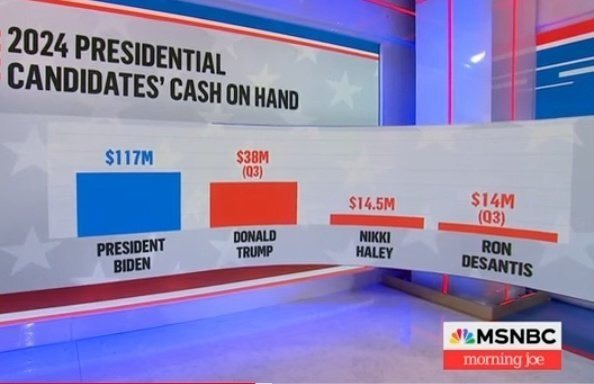
#badgraphs should be plotted from 0,0 instead of only the upper right quadrant..
2
2
1,753


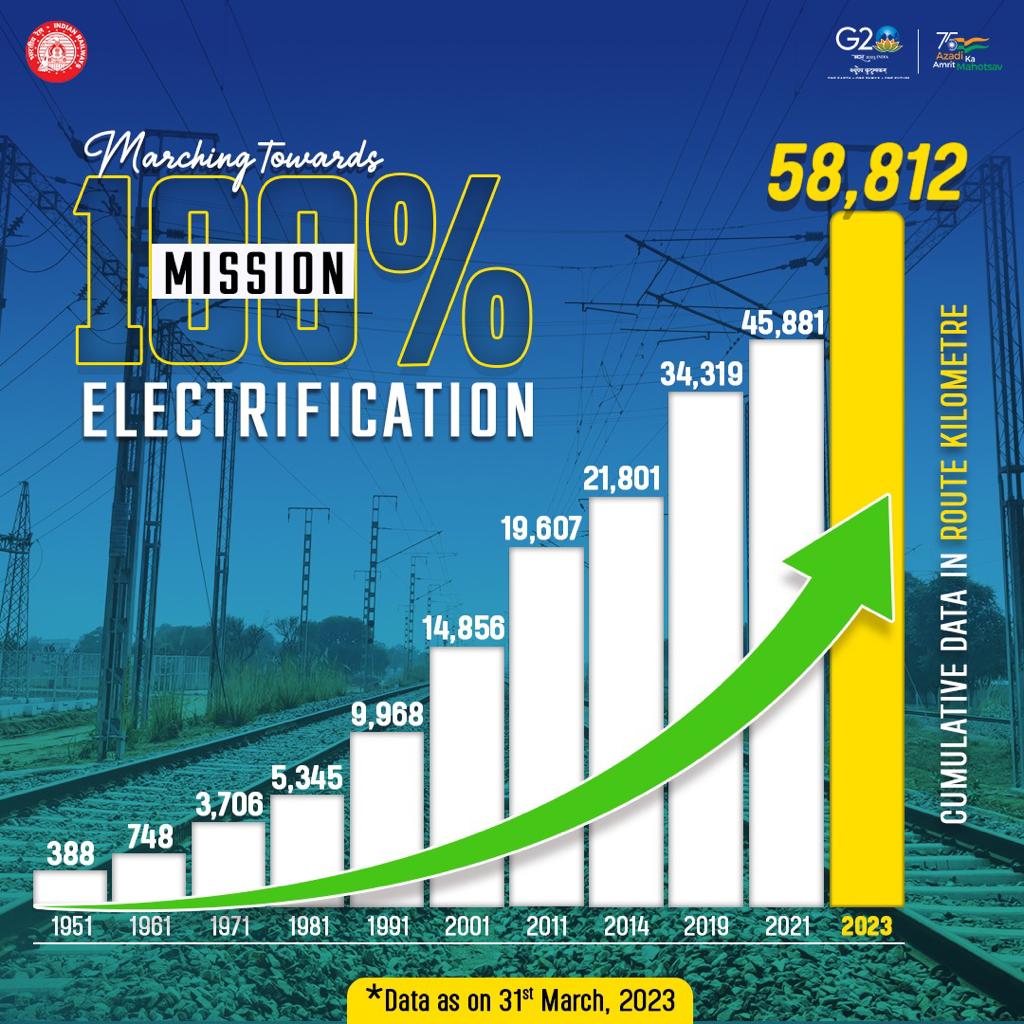
5 Apr 2023
"Sir should we keep the gap between the bars as 2, 5 or 10 years?"
"Yes"
#BadGraphs

1
5
443

Was looking for class material for international finance and came across this. Would be fun to teach a class on #badgraphs seekingalpha.com/article/429…
1
10
1,560

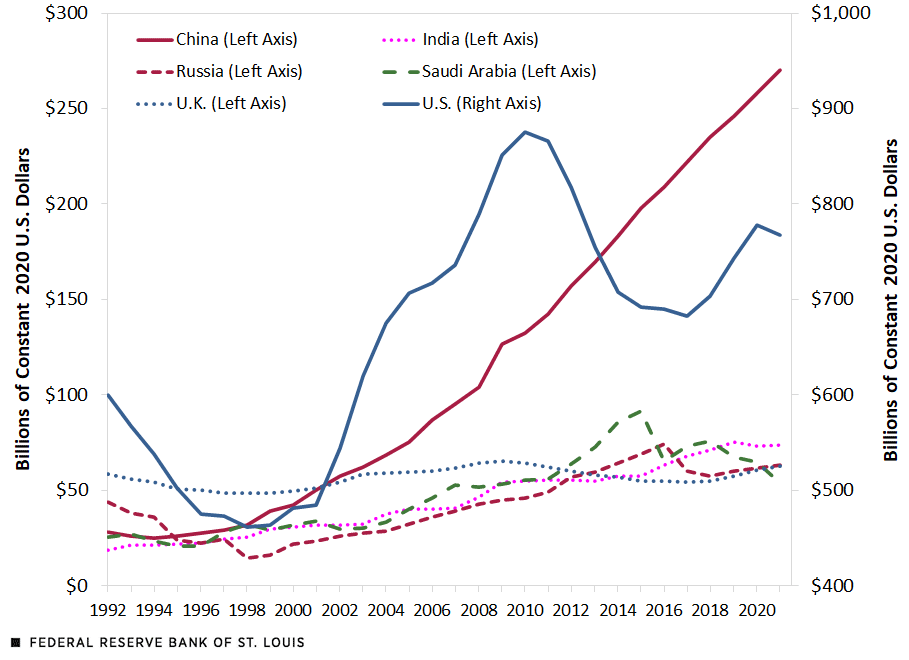
26 Jan 2023
In the category of Worst Graph of the Year...
What do you notice? What do you wonder?
@stlouisfed - please take this down. RT if you agree.
stlouisfed.org/on-the-econom…
#BadGraphs #HowToLieWithStatistics #ITeachMath #MathForSocialJustice
2
6
844

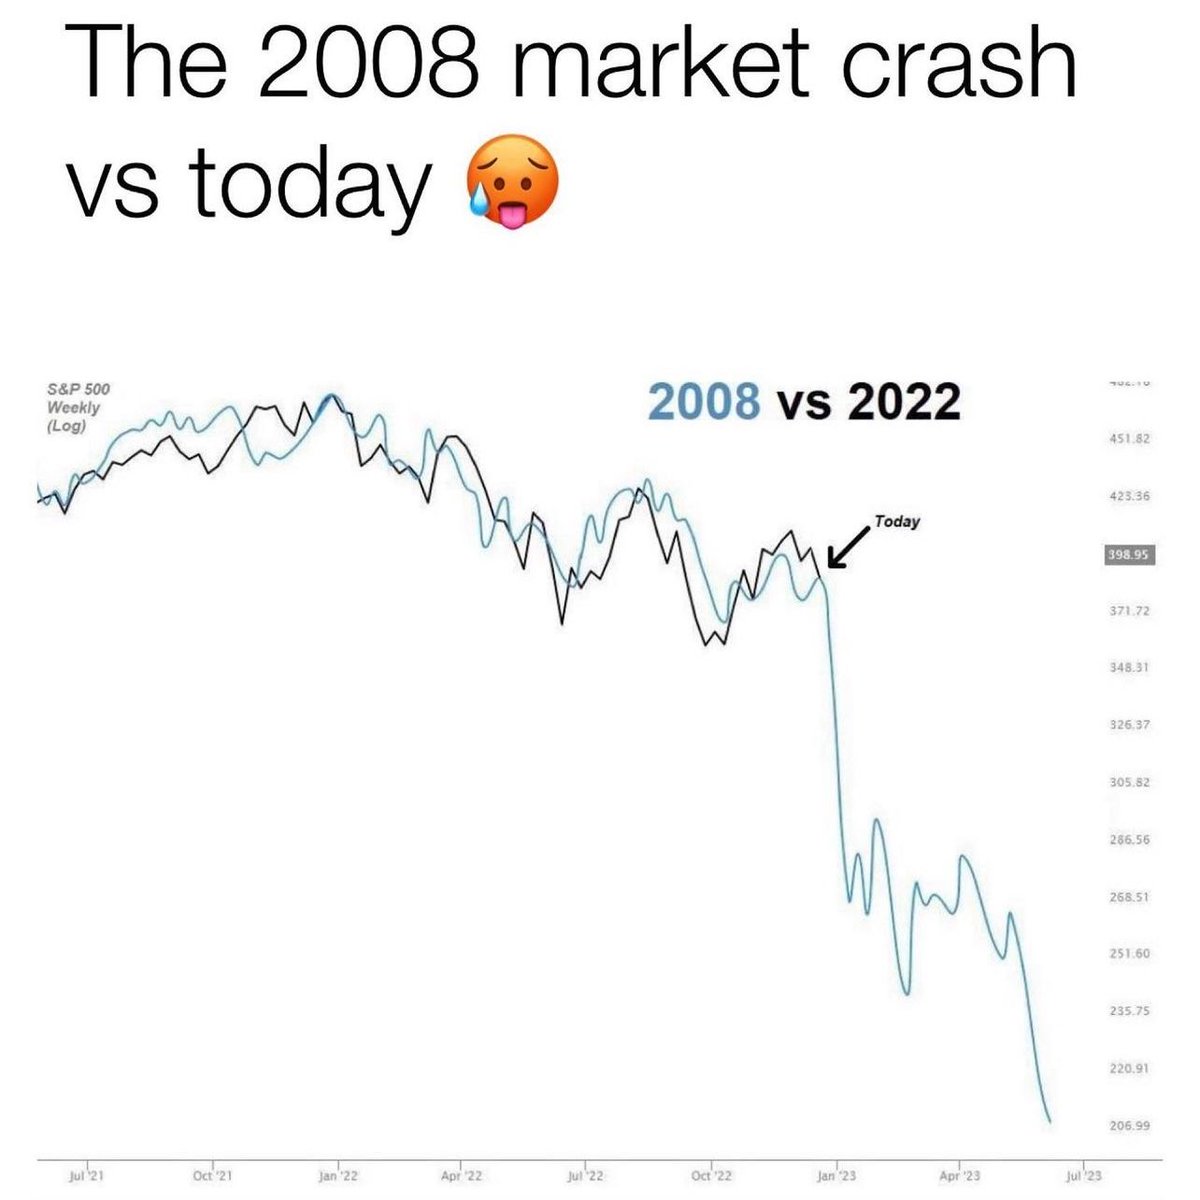
25 Dec 2022
Here's another for the #BadGraphs collection. The values on the axes are too small to read, and they need to make it abundantly clear that they're plotting 'log' values (rather than actual values or percent change).
3
348
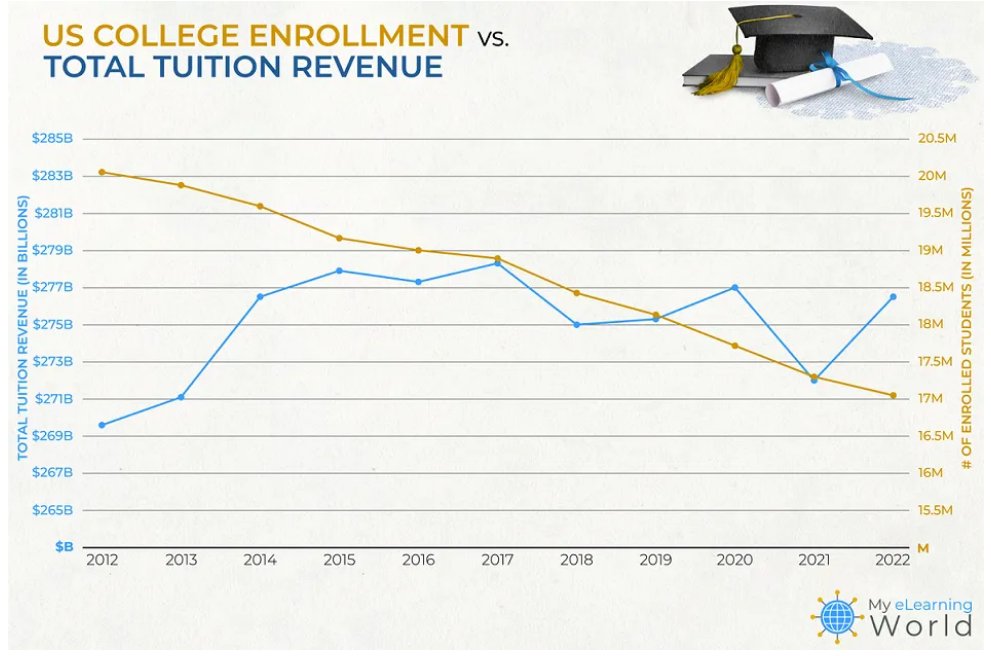
6 Dec 2022
Here's one for the #badgraphs collection. (Can my savvy followers point out the problems? They're a bit subtle at first glance, which makes the graph misleading.)...
2
1
2