
💙 LOVE DATA WEEK 2026 💙
„Where’s the Data?”🧐Dane badawcze mają swój cykl życia:💘pozyskanie →📦przetwarzanie →🔐bezpieczne, odpowiedzialne udostępnianie.
Spójrzmy na dane z miłością - od zauroczenia do dojrzałej relacji opartej na zaufaniu💙
#LoveData26 #DataLifecycle #PK

ALT Zdjęcie przedstawia "Cykl życia danych badawczych. Historia miłości". To etapy: planowanie, gromadzenie, analiza, archiwizacja, udostępnianie, ponowne wykorzystanie. Na zdjęciu znajdują się logotypy: Love Data Week, RODBUK, Biblioteka PK, informacja o licencji CC BY NC oraz informacja: "Oprac. Zespół ds. ON BPK"
3
45

𝗚𝗼𝗼𝗱 𝗺𝗼𝗿𝗻𝗶𝗻𝗴 𝗴𝘂𝘆𝘀.
If you’re starting out as a data analyst, before you hop on any tools, you need to understand the data analysis lifecycle.
This is the framework every analyst uses, whether they realize it or not.
Let me break it down. 🧵
𝟭. 𝗨𝗻𝗱𝗲𝗿𝘀𝘁𝗮𝗻𝗱𝗶𝗻𝗴 𝘁𝗵𝗲 𝗕𝘂𝘀𝗶𝗻𝗲𝘀𝘀 𝗣𝗿𝗼𝗯𝗹𝗲𝗺 (𝗔𝘀𝗸)
This is where most beginners mess up.
They jump straight into tools without understanding what problem they’re solving.
Ask:
→ What question are we trying to answer?
→ Who needs this information?
→ What decision will this analysis drive?
If you don’t understand the problem, your analysis is useless.
𝟮. 𝗗𝗮𝘁𝗮 𝗖𝗼𝗹𝗹𝗲𝗰𝘁𝗶𝗼𝗻
Now you know what you need. Go get it.
Where is the data?
→ Database? Export it.
→ Excel file? Import it.
→ API? Pull it.
→ Manual entry? Document it.
You can’t analyze what you don’t have. Collect the right data from the right sources.
𝟯. 𝗗𝗮𝘁𝗮 𝗖𝗹𝗲𝗮𝗻𝗶𝗻𝗴 & 𝗧𝗿𝗮𝗻𝘀𝗳𝗼𝗿𝗺𝗮𝘁𝗶𝗼𝗻
Real data is messy. Always.
Missing values. Duplicates. Wrong formats. Inconsistent entries.
Clean it:
→ Handle nulls
→ Remove duplicates
→ Fix data types
→ Standardize formats
This step takes 80% of your time. Accept it.
𝟰. 𝗗𝗮𝘁𝗮 𝗘𝘅𝗽𝗹𝗼𝗿𝗮𝘁𝗶𝗼𝗻
Now you start asking questions.
What patterns do you see?
→ Trends over time?
→ Outliers?
→ Correlations?
→ Unexpected values?
This is where curiosity matters more than technical skills.
Explore. Dig. Ask “why?”
𝟱. 𝗗𝗮𝘁𝗮 𝗔𝗻𝗮𝗹𝘆𝘀𝗶𝘀 / 𝗠𝗼𝗱𝗲𝗹𝗶𝗻𝗴
Apply your methods.
Descriptive analysis - what happened?
Diagnostic analysis - why did it happen?
Predictive analysis - what will happen?
Prescriptive analysis - what should we do?
Use the right technique for the question you’re answering.
𝟲. 𝗜𝗻𝘁𝗲𝗿𝗽𝗿𝗲𝘁𝗮𝘁𝗶𝗼𝗻 & 𝗣𝗿𝗲𝘀𝗲𝗻𝘁𝗮𝘁𝗶𝗼𝗻
You found insights. Now make them understandable.
Nobody cares about your SQL query or your pivot table.
They care about:
→ What does this mean for the business?
→ What should we do about it?
→ What’s the impact?
Visualize it. Tell a story. Make it actionable.
𝟳. 𝗜𝗺𝗽𝗹𝗲𝗺𝗲𝗻𝘁𝗮𝘁𝗶𝗼𝗻
Your analysis drives a decision. The decision leads to action.
Did it work?
→ Monitor the results
→ Track the metrics
→ Measure the impact
If it didn’t work, cycle back. Refine. Try again.
𝗛𝗲𝗿𝗲’𝘀 𝘁𝗵𝗲 𝗽𝗮𝗿𝘁 𝗻𝗼𝗯𝗼𝗱𝘆 𝘁𝗲𝗹𝗹𝘀 𝘆𝗼𝘂:
This isn’t a straight line.
You don’t go 1 → 2 → 3 → 4 → 5 → 6 → 7 and you’re done.
You cycle back and forth.
During exploration, you find data issues → back to cleaning.
During analysis, you realize you need more data → back to collection.
During presentation, stakeholders ask new questions → back to analysis.
That’s normal. That’s how it works.
𝗪𝗵𝘆 𝘁𝗵𝗶𝘀 𝗺𝗮𝘁𝘁𝗲𝗿𝘀:
Beginners think data analysis is about tools.
“Should I learn Excel or Python first?”
“Which BI tool is best?”
Wrong question.
The lifecycle is the same whether you use Excel, Python, Power BI, or Tableau.
Master the process first. Tools are just ways to execute it.
Understand the lifecycle. Follow the process. Get results.
That’s data analysis.
#DataAnalysis #DataEngineering #DataLifecycle #BuildingInPublic #Datafam

38
100
396
18,190

17 Oct 2025
"기록을 넘어, 생애를 설계하다 — IRYS!" 🧵
우리는 데이터를 “저장한다”고 말합니다.
하지만 사실, 데이터는
태어나고, 자라고, 상호작용하다가 사라지는 과정을 갖고 있어요.
이건 마치 하나의 생명 주기를 가진 존재라고 볼 수 있죠.
@irys_xyz #DataLifecycle #GovernedData

2
2
20

22 Jul 2025
“El ciclo de vida del dato debe controlarse desde su recolección hasta su eliminación.”
— @NIST Privacy Framework
La privacidad no termina al entregar el aviso.
Empieza cuando se documenta todo el ciclo
#DavaraQuote #ProtecciónDeDatos #DataLifecycle #NIST #GobernanzaDeDatos
1
9
311

17 Mar 2025
Data drives success — manage it right with these 6 key stages: 👇 From secure collection to responsible disposal, every step ensures value and compliance.
How does your team handle the data lifecycle? Share below.
#DataManagement #DataLifecycle #data #Tech

4
40

11 Feb 2025
Unlock the secrets to safeguarding your data throughout its entire lifecycle. From creation to disposal, understanding and securing every phase is critical for maintaining confidentiality, integrity, and availability.
Download Now → bit.ly/4b11Iul
#DataLifecycle

1
204

11 Dec 2024
In this third and final conversation with Michelle Dennedy, Chief Data Strategy Officer at Abaxx Technologies, on 𝘛𝘩𝘦 𝘋𝘪𝘨𝘪𝘵𝘢𝘭 𝘛𝘳𝘶𝘴𝘵 𝘗𝘰𝘥𝘤𝘢𝘴𝘵, Michelle dives into the complexities of managing data as both an asset and a liability. She focuses on the risks of data hoarding and how to manage the data lifecycle effectively. Michelle also discusses how AI is reshaping privacy and how companies, large and small, can adapt. Whether you’re looking to turn data into an asset or navigate the evolving role of AI, this episode provides practical strategies for businesses of all sizes.
#DataLifecycle #AIandPrivacy #DigitalTrust #DataGovernance #MichelleDennedy #PrivacyInnovation
----------------------------------------------------------------------------
Sign up to receive the Digital Trust Podcast Newsletter straight to your inbox: digitaltrustpodcast.com/news…
----------------------------------------------------------------------------
You can tune in and find us in other platforms as well:
Acast - shows.acast.com/digitaltrust…
Linkedin - linkedin.com/company/1036801…
Spotify - open.spotify.com/show/3QfO0f…
Deezer - deezer.com/show/1001139161
Amazon Music - music.amazon.com/podcasts/a5…
Youtube Podcast - music.youtube.com/playlist?l…
1
3
72

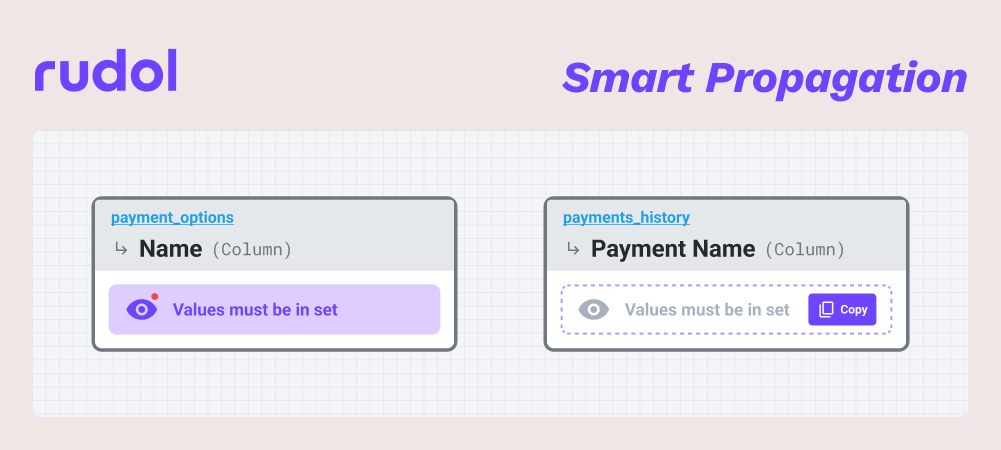
Rudol analyses your Asset’s lineage, and suggests to replicate Validations downstream, to ensure consistency on the entire #dataLifecycle
Want to apply massive Quality for your stack? Try with us! at rudol.ai

1
4
30

Databases need more than just a strong start—they need a full lifecycle strategy!
Learn key tips for development, deployment, & scaling your database for lasting performance.
#Database #Tech #DataLifecycle #8Seneca #development
8seneca.com/blog/lifecycle-o…
1
1
3
16

11 Sep 2024
Ready to optimize your data lifecycle management for enhanced efficiency and security? Contact us today to explore tailored solutions!
#DataLifecycle #datamanagement #datasecurity
2
21
Rudol analyses your Asset’s lineage, and suggests to replicate Validations downstream, to ensure consistency on the entire #dataLifecycle.
Want to apply massive Quality for your stack? Try with us! at rudol.ai

4
11
Rudol analyses your Asset’s lineage, and suggests to replicate Validations downstream, to ensure consistency on the entire #dataLifecycle.
Want to apply massive Quality for your stack? Try with us! at rudol.ai
1
4
21

12 Jun 2024
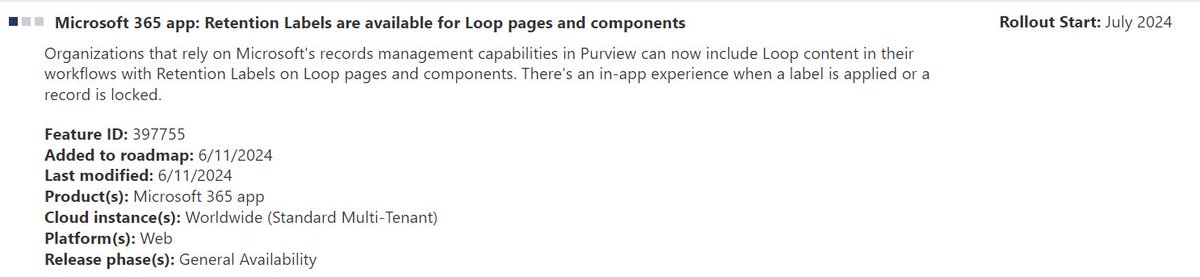
A welcome addition in Microsoft Purview for Loop - Coming in July Retention lables for Loop pages & components. buff.ly/4b1Rpo6 #MicrosoftPurview #Retention #DataLifecycle #MicrosoftLoop
3
5
385
23 May 2024
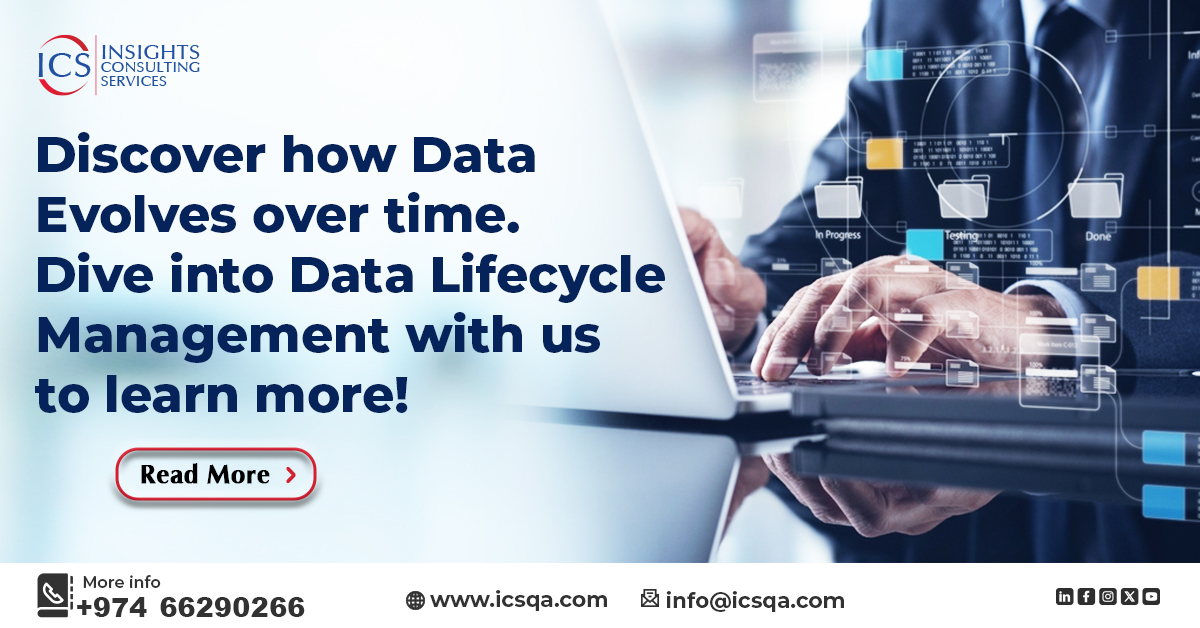
Discover the journey of data evolution. Delve into the intricacies of Data Lifecycle Management with us to gain deeper insights!
To Read More: icsqa.com/products/data-life…
#DataEvolution #DataManagement #DataLifecycle #DataAnalytics #BigData #DataStorage #DataSecurity #DataGovernance
6
60

22 May 2024
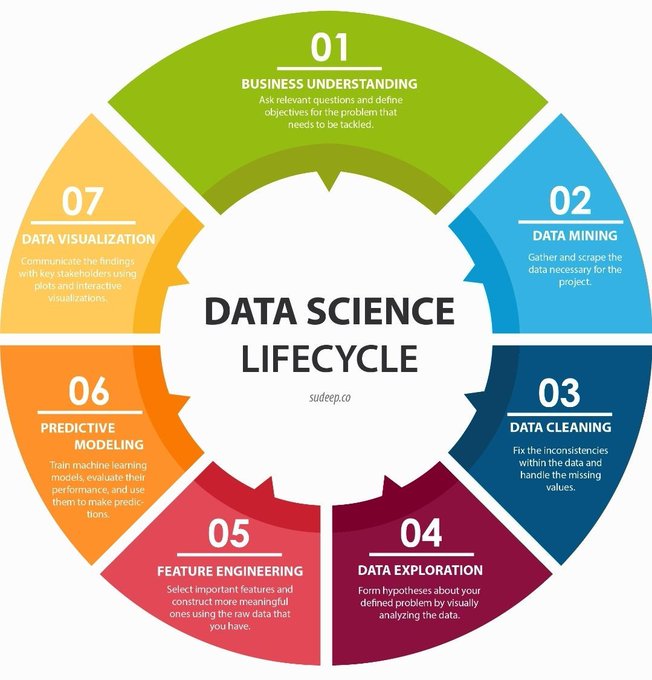
This Infographic guides you through the Lifecycle of Data Science
RT @ingliguori
#DataScience #DataLifecycle #DataAnalysis #DataVisualization #DataMining #MachineLearning #DataAnalytics #DataInsights
cc: @CyrilCoste @sarahookr @junjudapi @nikhilk
1
1
3
69
20 May 2024
Embark on the journey of data with our Data Lifecycle Management expertise! Let's navigate the data lifecycle together!
To Read More: icsqa.com/products/data-life…
#DataLifecycle #DataManagement #DataSecurity #DataValue #DataProtection
7
49

6 May 2024
Are you confused about the roles of a #DataAnalyst, #DataScientist, and #DataEngineer?
This #infographic breaks down their key differences in skills, responsibilities, and tools used.
#bigdata #machinelearning #datavisualization #datawrangling #datalifecycle #careerpath

2
167
Rudol analyses your Asset’s lineage, and suggests to replicate Validations downstream, to ensure consistency on the entire #dataLifecycle.
Want to apply massive Quality for your stack? Try with us! at rudol.ai

2
4
31

12 Mar 2024
📣𝙄𝙣𝙩𝙧𝙤𝙙𝙪𝙘𝙞𝙣𝙜 𝘾𝙮𝙘𝙡𝙊𝙥𝙨 𝙘𝙤𝙣𝙨𝙤𝙧𝙩𝙞𝙪𝙢
🌐Meet our partner Suite5 Data Intelligence Solutions
👉Learn more about: suite5.eu/
#datalifecycle #dataspaces #datasovergnity
@suite5eu @NTTDATA
2
53

27 Jan 2024
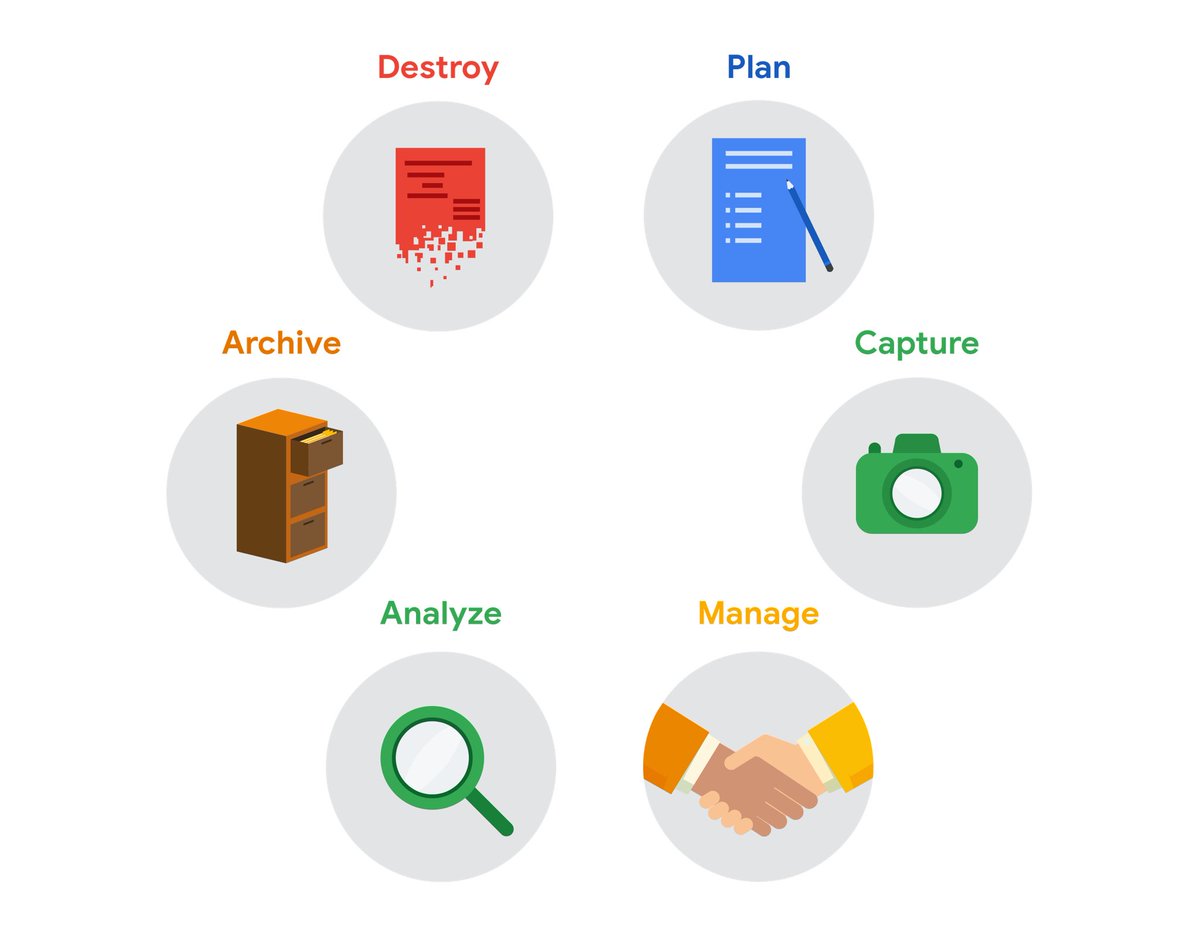
Whisking through the Data Life Cycle: Planning the mix, capturing the essence, managing the blend, analyzing the flavors, archiving memories, and bidding a sweet farewell. A recipe for data success! 🍬🔄 #DataLifecycle #SweetDataJourney
4
58