
Jun 12
AI
"Er zijn geen realtime politieke datatools of officiële publicaties die de exacte motieteller specifiek vanaf 23 februari 2026 per partij bijhouden. Wel is bekend dat de oppositiefractie GL-PvdA (PRO) structureel veruit de meeste moties indient in de Tweede Kamer... "
1
1
13

Jun 9
Stop paying for expensive lead tools.
google-maps-scraper gives you unlimited Google Maps data extraction — local, private, and free.
Perfect for agencies, sales teams & researchers.
Repo: github.com/gosom/google-maps…
Tag a friend who needs leads 👇
#DataTools #Entrepreneur #Automation
1
2
21

🚨 Tomorrow! Don't miss "SQL Server with Access: Using Microsoft Access with AI – Part 3"
🔗 Register now before it's too late → eventbrite.com/e/sql-server-… // accessusergroups.org/calenda…
#MicrosoftAccess #SQLServer #AI #AccessUserGroups #DataTools

1
5

¿Quieres tiempo para ver el #Mundial2026 ⚽ o tomarte un café ☕?
Recupera las horas que pierdes cada semana en #Excel.
✔ Cruza, limpia tablas, separa y envía tus datos en minutos.
Tu empresa ya tiene Excel y Outlook. Solo falta Optipe.
👉 optipe.com #DataTools
2
2
72

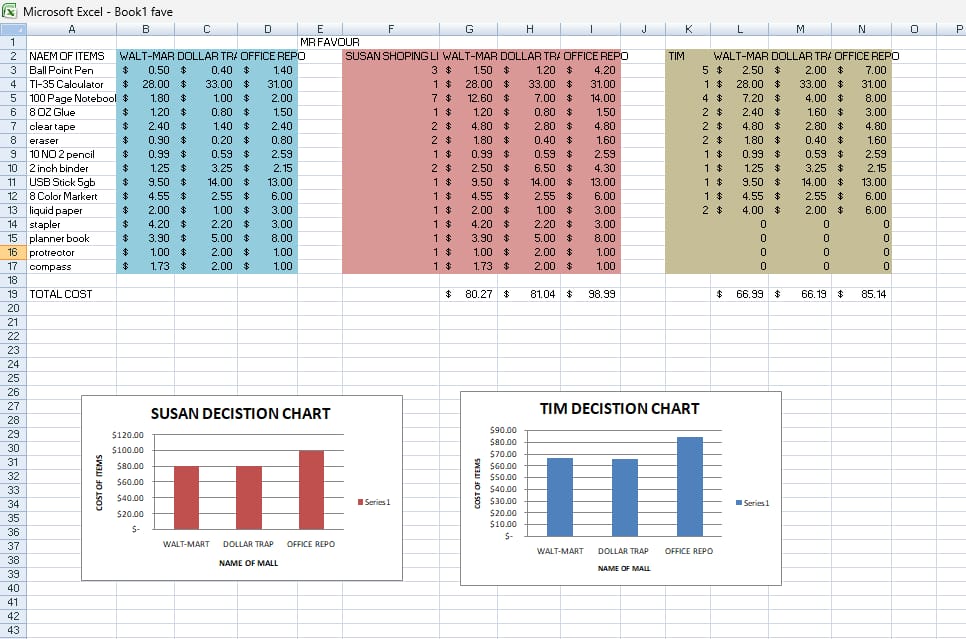
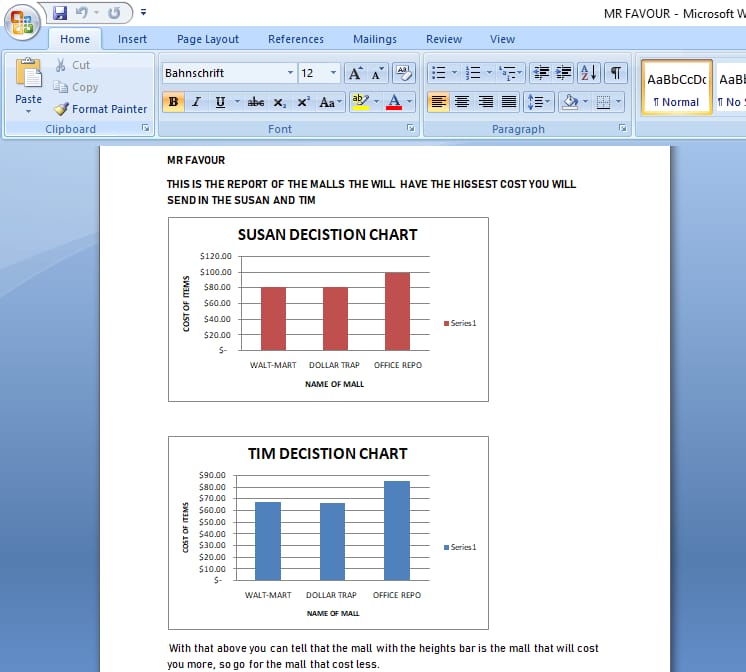
Dear Data Analysts📈, I am excited to share one of my dashboards I created on my own using a personal decision dataset🤗🤗.
Please engage and what do you think🥹🙏🏾
#dataanalysts #excel #DataTools #learing #dataset
2
4
39

The right sequence for analytics in the age of AI:
- Reliable data
- Consistent models
- Semantic layer
- Useful analytics
- AI as an accelerator
Not the other way around.
Full article: biuwer.com/en/blog/ai-first-… #AI #DataAnalytics #BI #DataTools
2
4
63

Apr 30
Today I got this feedback from someone working on their master’s thesis:
"I found your tool while searching for an easy way to generate graphs… but it doesn't support Turkish characters like Ş, Ğ, Ç… shame I won’t be able to use it."
That’s all it took.
Today, that problem is solved.
Plotiq.app now supports multilingual characters across CSV graphs:
• Turkish - Ş Ğ Ç İ ı Ö Ü
• German - ä ö ü ß Ä Ö Ü
• French - é è ê ë à â ç ô î ï ù û œ
• Spanish - ñ á é í ó ú ü ¿ ¡
• Italian - à è é ì ò ù
• Portuguese - ã õ ç á à é í ó ú
• Dutch / Catalan - ë ï ç
• Nordic - æ ø å Æ Ø Å
• Finnish - ä ö
If you're doing research, analysis, or working with global datasets - your data should just work.
#buildinpublic #research #indiedev #datatools #csv

3
44

Monitoring thousands of obligors manually? That’s a risk.
MuniGUARD Monitor automates event detection, filing alerts, and compliance tracking. All tailored to your holdings.
LEARN MORE: dpcdata.com/products/munigua…
#fixedincome #regulatorycompliance #datatools #MuniGUARDMonitor

2
23

Apr 21
🦞 OpenClaw x XCrawl: Your AI-Powered Web Scraping Sidekick 🚀
✅ Claw-precise for every use case
✅ AI-ready data in seconds, no messy cleanup
✅ 100% free to start scraping
Ditch broken scrapers & grab data fast → xcrawl.com
#WebScraping #AIAutomation #DataTools
1
1
114

Apr 10
If you could only use ONE for the rest of your career, which are you picking?
Tell us why in the comments—we’re settling this today!
#Inlytics #DataTools #PythonVsSQL #TechCommunity #DataSchool


11
18
144

Vandaag starten we een nieuwe fase van DLT met de lancering van ons eigen dashboard. 🚀
We delen al jarenlang onze kennis. Via artikelen, de podcast en de community. Maar je moet er wel de tijd voor hebben om alles te volgen.
Dat lossen we vandaag op.
Honderden datapunten uit professionele datatools en inzichten uit de artikelen die wij wekelijks schrijven, in één overzicht.
Zo weet jij binnen een minuut waar de kansen liggen, wat er speelt en wat belangrijk is om te weten als belegger.
▹ Overzicht: dagelijks de belangrijkste signalen en verschuivingen in de markt
▹ Aandelen: alle deepdives en grootste kansen in de megatrends, met wekelijkse datagedreven updates op fundamentals en momentum
▹ ETF’s: de beste ETF’s, toplijsten met momentum en thema-prestaties in één overzicht
▹ Crypto: waar we zitten in de cyclus, signalen vanuit BTC/ETH en onze eigen altseason barometer
▹ Macro: fase van de wereldeconomie, liquiditeit en welke assets het goed doen in dit klimaat
▹ Sentiment: Fear & Greed-indices en of extreme sentimenten historisch kansen bieden
▹ Rotaties: verschuivingen tussen risk-on en risk-off, EM vs DM, Bitcoin vs goud
▹ Kalender: alle belangrijke macrodata, earnings en IPO’s in één overzicht
Onze PLUS-leden hebben per direct toegang tot de beta versie, die de komende maanden verder uitgebouwd gaat worden.
2
8
1,016

Vandaag starten we een nieuwe fase van DLT met de lancering van ons eigen dashboard. 🚀
We delen al jarenlang onze kennis. Via artikelen, de podcast en de community. Maar je moet er wel de tijd voor hebben om alles te volgen.
Dat lossen we vandaag op.
Honderden datapunten uit professionele datatools en inzichten uit de artikelen die wij wekelijks schrijven, in één overzicht.
Zo weet jij binnen een minuut waar de kansen liggen, wat er speelt en wat belangrijk is om te weten als belegger.
▹ Overzicht: dagelijks de belangrijkste signalen en verschuivingen in de markt
▹ Aandelen: alle deepdives en grootste kansen in de megatrends, met wekelijkse datagedreven updates op fundamentals en momentum
▹ ETF’s: de beste ETF’s, toplijsten met momentum en thema-prestaties in één overzicht
▹ Crypto: waar we zitten in de cyclus, signalen vanuit BTC/ETH en onze eigen altseason barometer
▹ Macro: fase van de wereldeconomie, liquiditeit en welke assets het goed doen in dit klimaat
▹ Sentiment: Fear & Greed-indices en of extreme sentimenten historisch kansen bieden
▹ Rotaties: verschuivingen tussen risk-on en risk-off, EM vs DM, Bitcoin vs goud
▹ Kalender: alle belangrijke macrodata, earnings en IPO’s in één overzicht
We lanceren vandaag in de beta (0.6) en zullen vele uren blijven investeren om de inzichten nóg beter te krijgen.
3
2
17
6,268

Mar 31
🎨🚀Trending Open-Source Github Projects : Project AIRI, OpenViking, AgentScope, Superset & Nova
"This video covers the top trending open-source GitHub projects released by developers this week. The focus is on developer productivity, AI agent workflows, automation, and data systems. Projects like Project AIRI help build interactive AI assistants & more! ' 💻✨ 🔥
#opensource #githubprojects #developer #programming #aiprojects #aiagents #automation #datatools #analytics
3
1
140

Mar 22
Client reporting made simple 📊
ZapDigits helps agencies build white-label dashboards, manage unlimited clients, and connect 30 data sources in one place.
👉 Try ZapDigits: saaspirate.com/go/zapdigits
#MarketingAgencies #DataTools #SaaS #SaaSPirate

1
1
66

Which one is easier to work with in Power BI; adding a new column in Power Query Editor or adding one in the table view? #PowerBI #DataAnalytics #DataVisualization #PowerQuery #TechTips #DataTools
1
2
36

Mar 13
4️⃣ Programming & Querying
Tools like SQL, Python, and R allow analysts to explore large datasets, automate workflows, and perform deeper analysis beyond spreadsheets.
#SQL #Python #DataTools #DataAnalytics
1
3
37

Mar 12
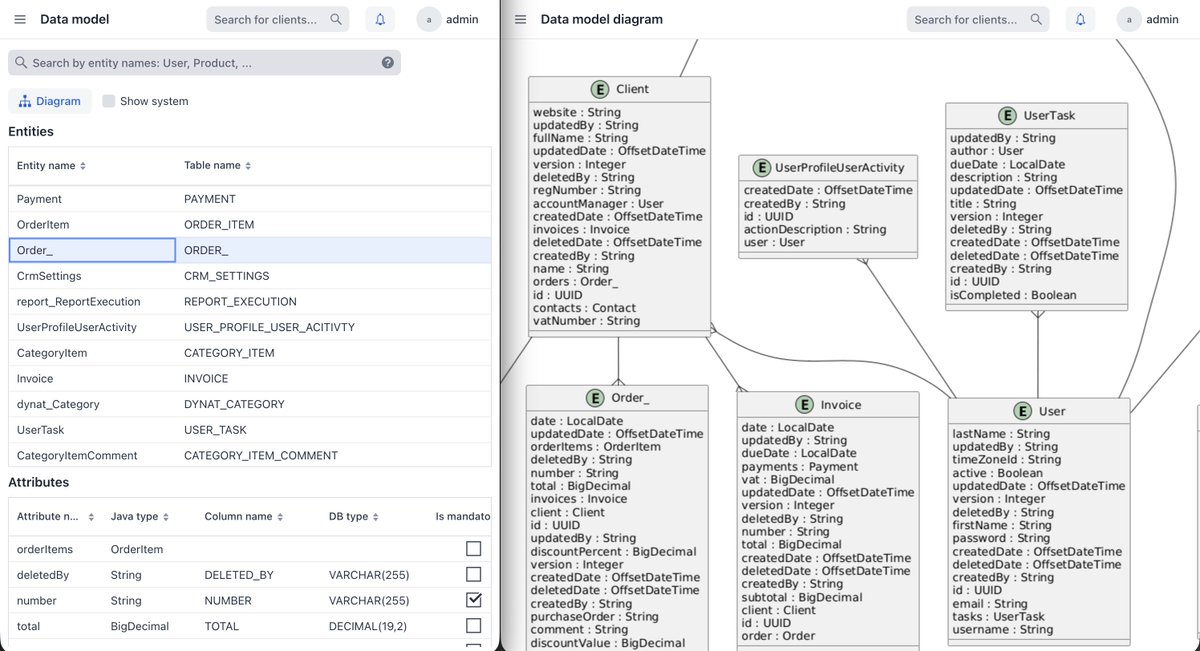
📍Inside Jmix 2.8.
Data Model Visualization
When you’re writing a report and thinking: “Okay… but how exactly are these entities related?”
When working with Reports, you often need to look at the ER model:
📍what relationships exist?
📍where it’s OneToMany?
📍where it suddenly turns out to be ManyToMany?
What do you usually have to do to see the necessary information about the data model?
1) Open pgAdmin or DBeaver (assuming they’re already installed).
2) Run the required queries or search for the information in the UI.
While looking at one thing, you forget about another: you switch back to the application or the code, lose focus, lose context…🔄
Starting with Jmix 2.8, there’s a more convenient way with the DataTools add-on.
Data Model Visualization ✨
The DataTools add-on now makes it possible to see all entities and their attributes on a single screen, as well as generate a detailed ER-diagram.
Just a couple of clicks — and all the information you need is right inside your application.
No unnecessary switching or extra tools 👌🏼
6
131

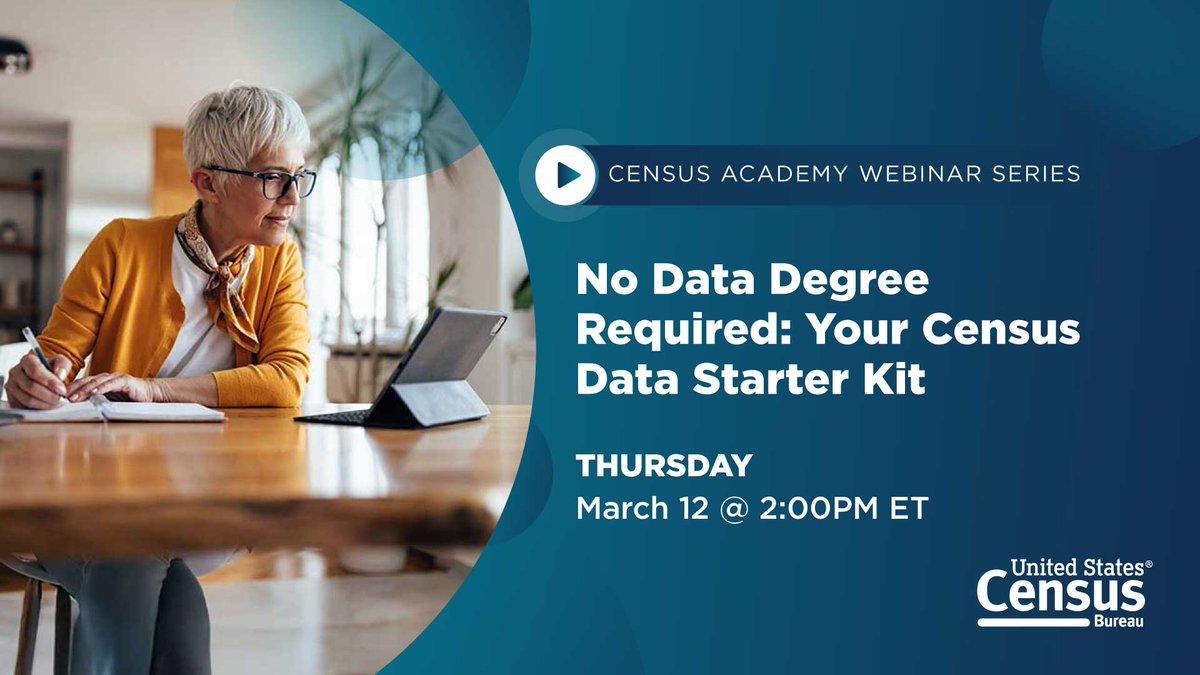
New to #CensusData?
This beginner-friendly webinar introduces four #DataTools that do the heavy lifting for you. We'll show you how to find trustworthy statistics and use them with confidence.
Block your calendar for Thursday.
census.gov/data/academy/webi…
1
3
6
624
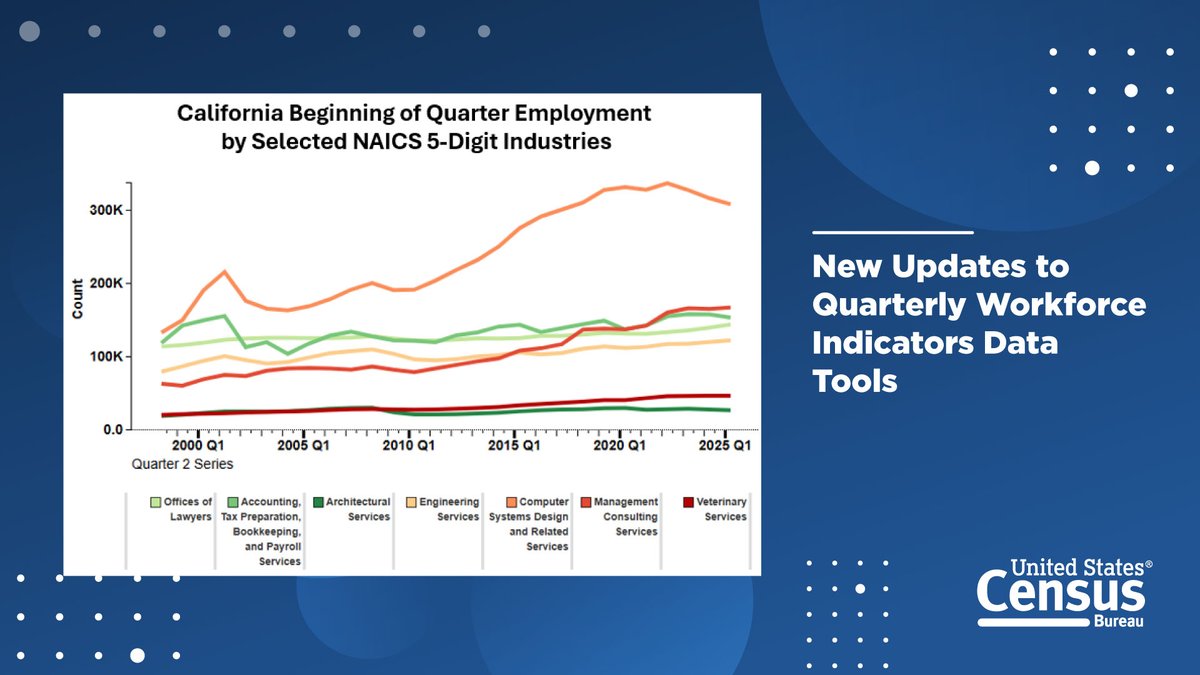
We've updated our Quarterly Workforce Indicators #DataTools with detailed industry data at the state level.
Explore NAICS 5-digit Industry and 6-digit National Industry tabulations with line charts, bar charts, and maps.
📊 qwiexplorer.ces.census.gov/
#QWI
1
1
4
629

Feb 16
Uy si,. Aparte de que los peajes (2) están a $16.100 (4 dólares -) no entiendo como diablos hay que pasar de 70 Km por hora a 30 en un tramo de pocas cuadras a veces.
Y el numero de camaras para multar a la gente es ridiculo.
He conducido Miami- New York con mi familia por la I-95 la cual atraviesa 15 Estados en aproximadamente 22 a 24 horas de viaje continuos. Y los limites de velocidad son hasta de 70 millas por hora (112 Kilometros por hora).
Y no hay PEAJES, ni uno solo. Y mucho pero mucho menos “camaras salvavidas”.
Vale aclarar que un peaje regular en una autopistas en 🇺🇸 esta entre $0,50 y 1 dolar.
Y obviamente es una autopista de lado a lado que se convierte hasta en 6 carriles en algunas ciudades y estados.
El negocio de las fotomultas en Colombia se esta saliendo de control.
¿Y para que queremos autopistas en el país si tenemos que andar como putas tortugas para que no nos claven una multa? Ahh si para que privados como Datatools se llenen los bolsillos.
@MinTransporteCo @InviasOficial @ansvcol @CamiloRomero @EsmeHernandezSi @petrogustavo @QuinteroCalle
Feb 16

Viajé Bogotá-El Peñón (c/marca) y la carretera super buena aunque cerrada con maletines algunos tramos sin nadie a la vista.
Lo INAUDITO y RIDICULO es q tremendas vías para q en MUCHAS PARTES se tenga q conducir a 30 KM/H. X el negocio de las cámaras. Es ridículo y peligroso.
9
43
108
4,156