Ade retweeted

Jun 10
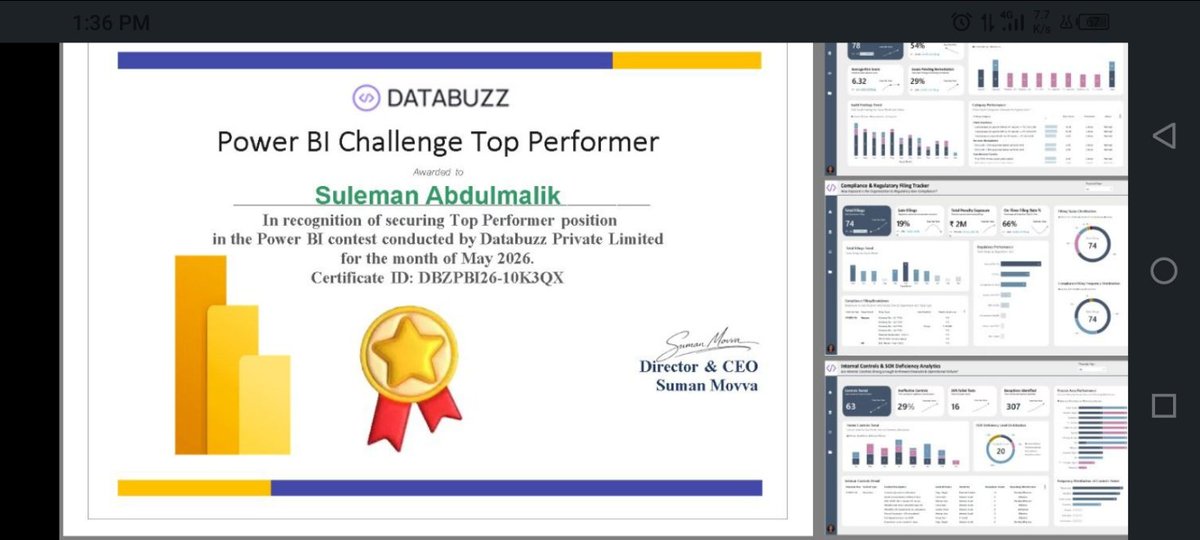
Glad I received the Top Performer award for my Databuzz Ltd report on Audit and Compliance Analytics. Thanks to the organizing team and Coparticipants.
linkedin.com/posts/chiranjee…
May 16

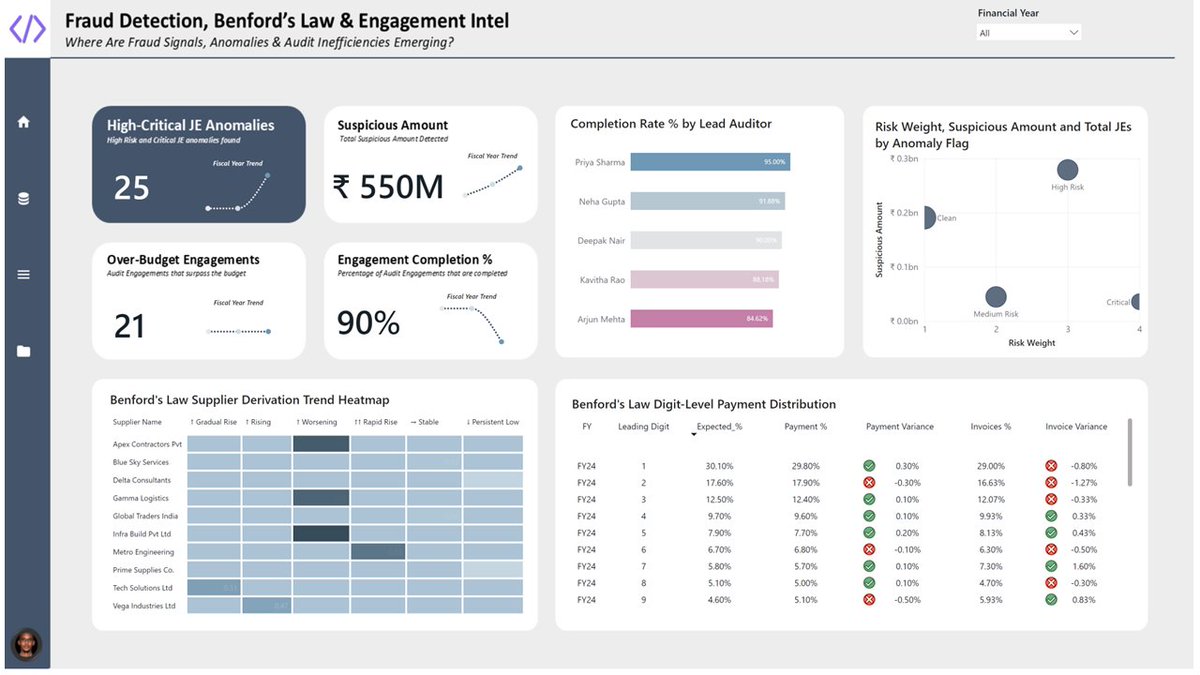
I built a 4-page Audit & Compliance report in Microsoft Power BI covering 3 financial years for an Indian firm answering :
🔍 Where is audit risk concentrated? 📑 How exposed are we to compliance penalties? 🛡️ Are internal controls effective? 🕵️ Where are fraud signals emerging?


6
2
12
177

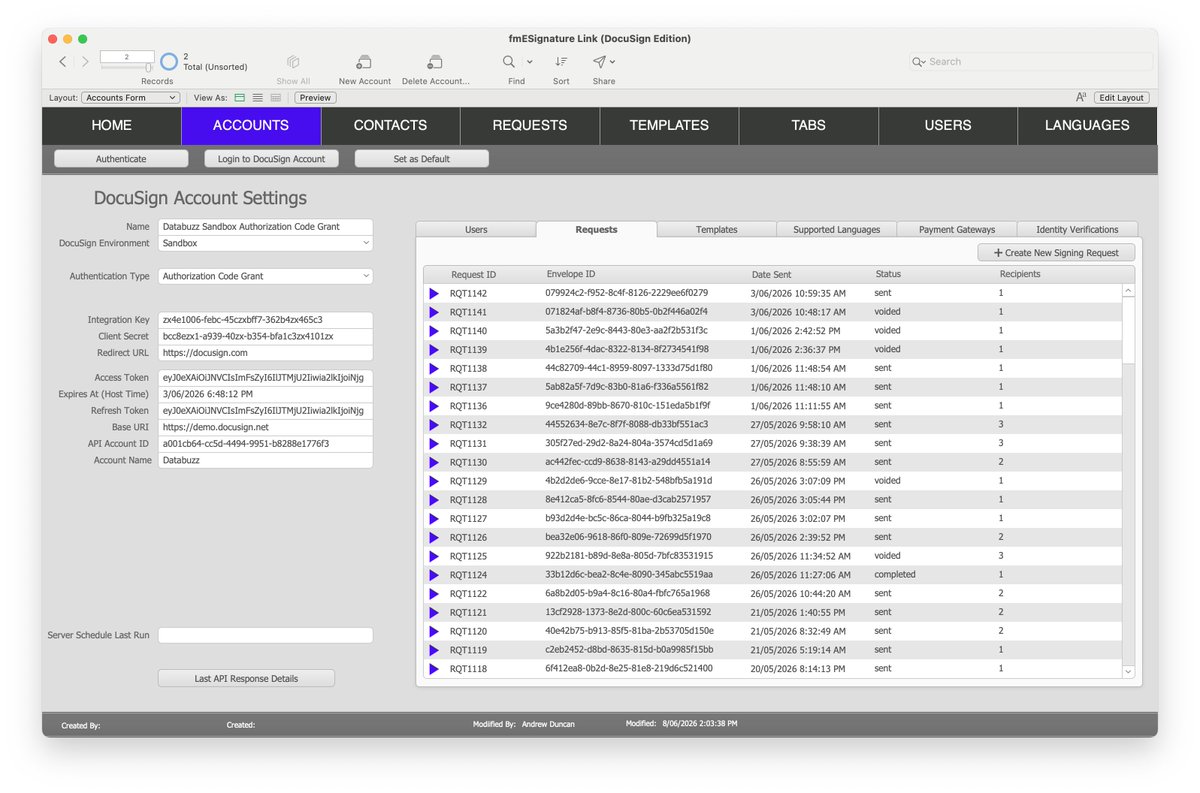
I'm pleased to announce the release of fmESignature Link (Docusign Edition) v2, our @ClarisOfficial FileMaker solution for the @Docusign platform. We've added support for multiple documents, multiple Docusign accounts and Send On Behalf Of and much more.


1
1
1
80

@onyx DNA, Easytech Academy, Databuzz. Check them on Linkedin. I might not get the correct tags here.
1
2
149

Hi #Datafam, I'm thrilled to share my submission for the
Databuzz Monthly Challenge, March edition.
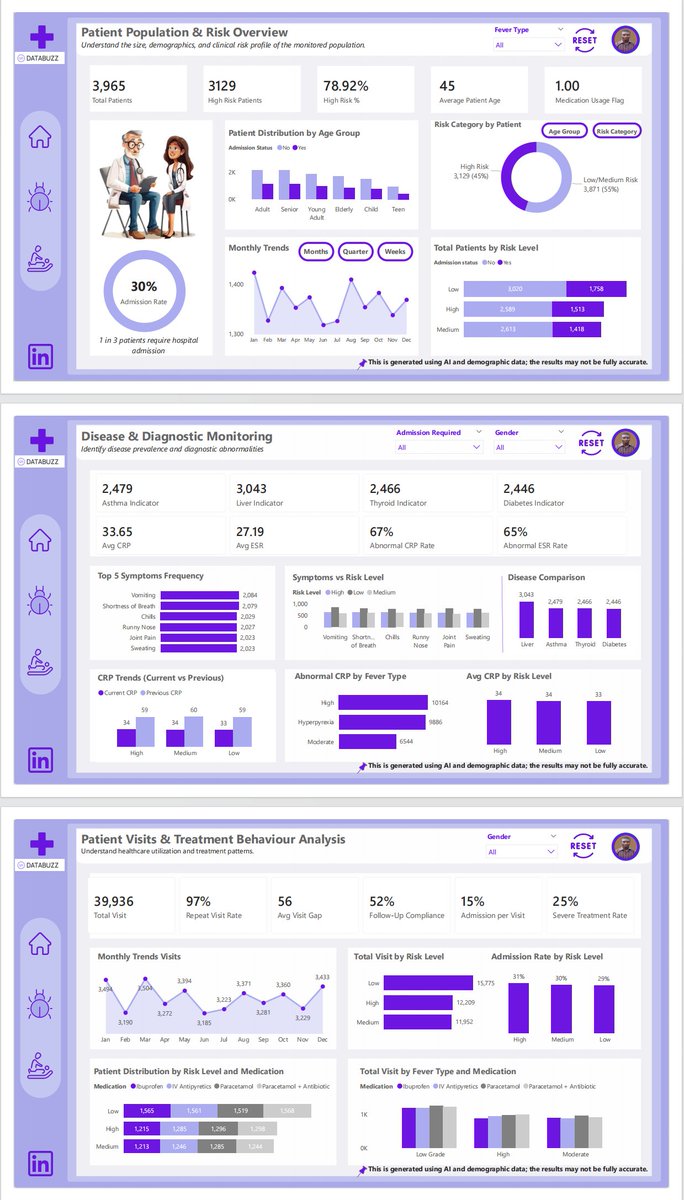
In this project, I built a 4-page Patient Health Monitoring Dashboard on Power BI using an AI-generated dataset of 20,000 patient visits. 🧵

ALT The Patient Risk Overview page answers the question - "Who is at risk?" by providing a view of patients' risk levels, fever patterns, and key health indicators across visits.
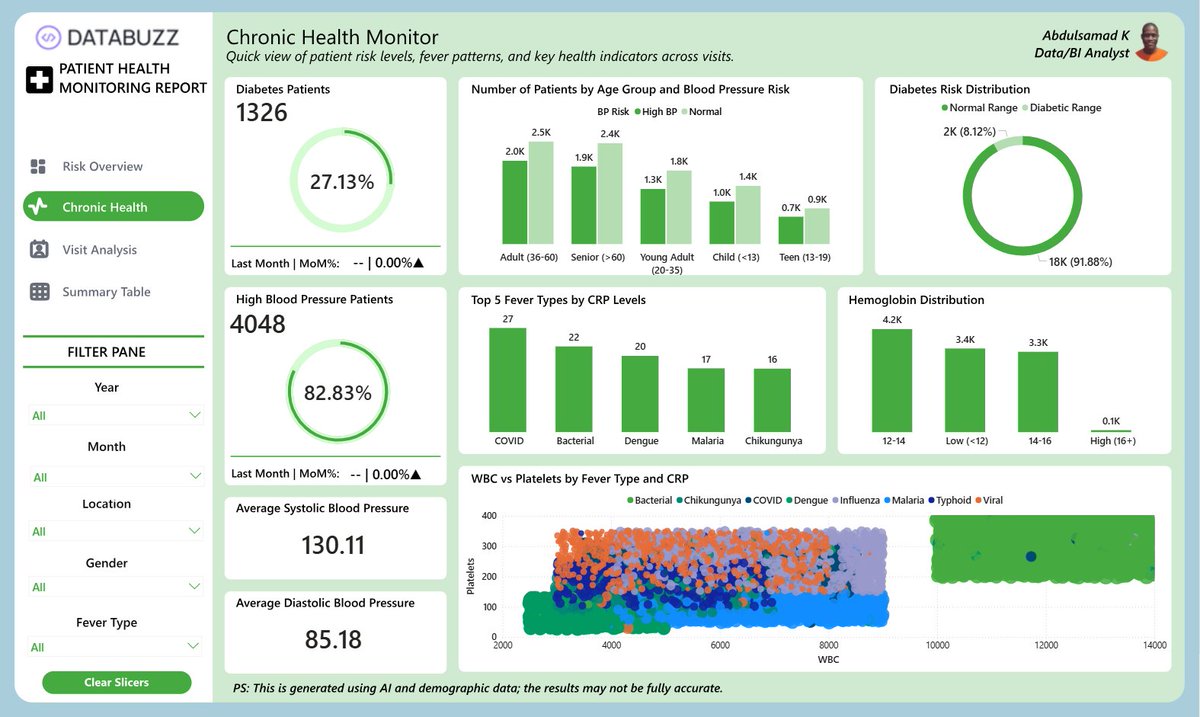
ALT This is the Chronic Health Monitor page, and it answers the question "What chronic conditions are present?" by tracking the burden of diabetes and high blood pressure risk across the patient population.
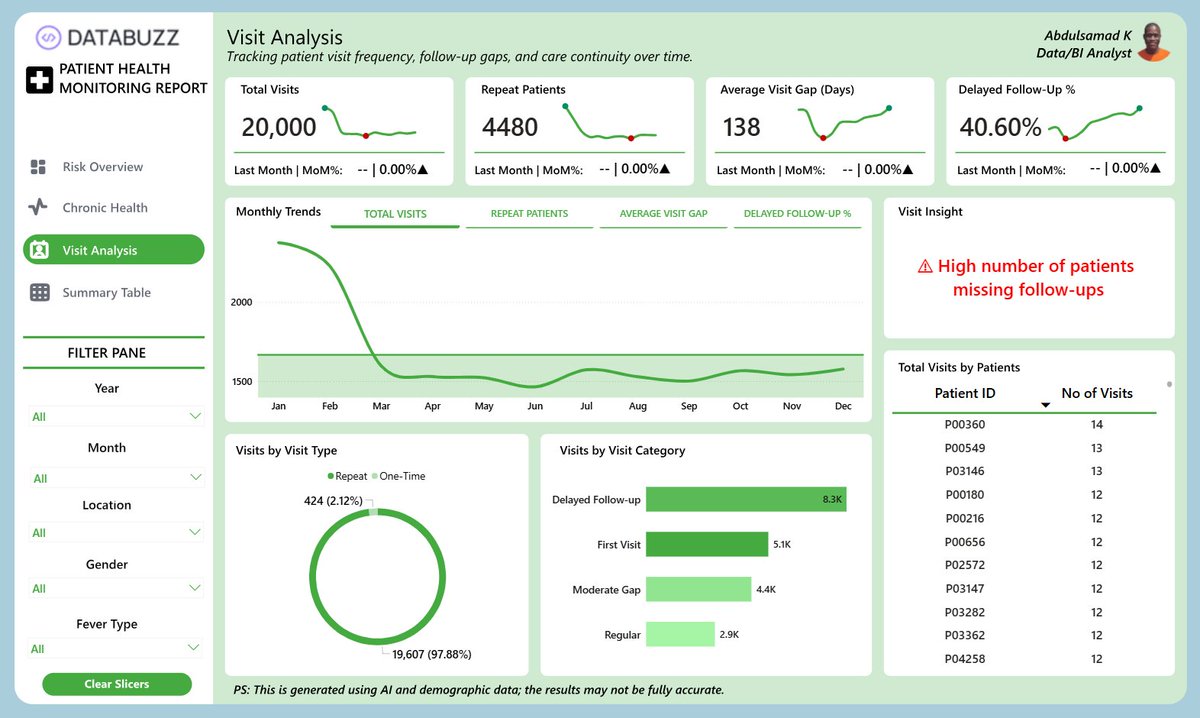
ALT This is the Visit Analysis page. It tracks patient visit frequency, follow-up gaps and care continuity of patients over time.
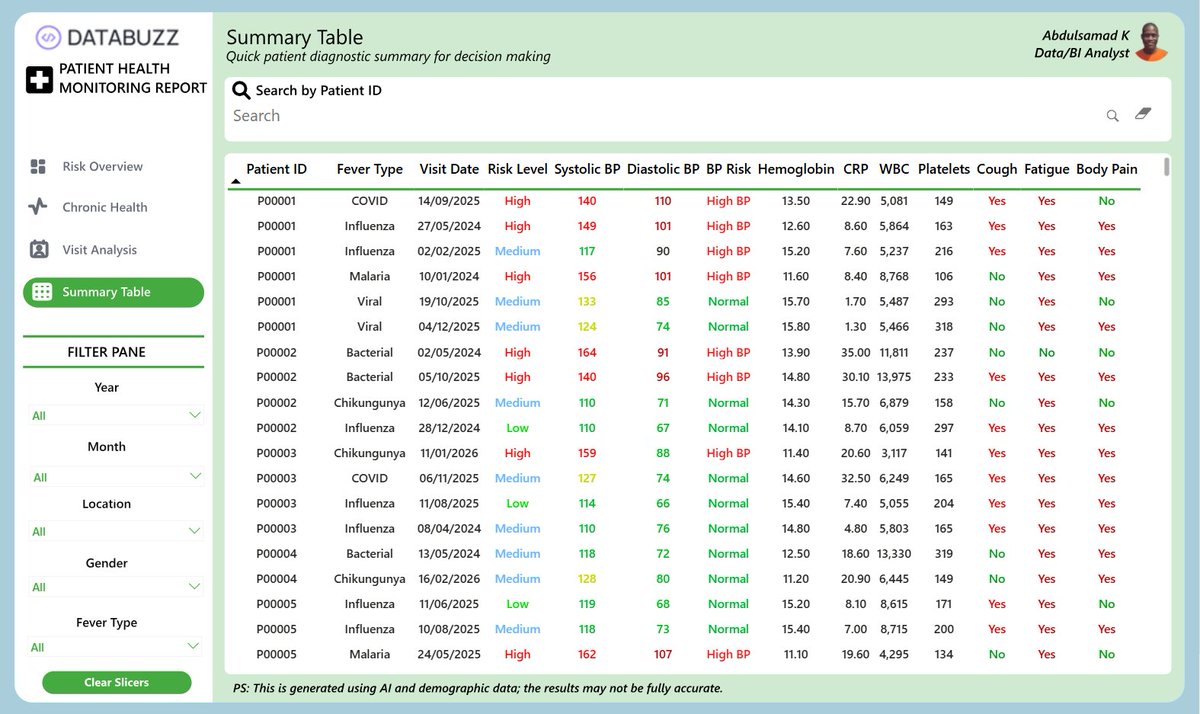
ALT This is the Summary Table. It provides a searchable table view of every patient for clinical reference and quick decision-making.
10
15
110
2,010

I finally took part in the #DataBuzz Challenge (March 2026)… and it was worth it.
Not because I built a dashboard,
but because I solved a real problem.
link: app.powerbi.com/view?r=eyJrI…
20
21
211
5,447

Na 7 jaar en 8.000 jongeren geeft DataBuzz het stokje door aan de leerkrachten.🚍
Vandaag experimenteerden zij met data en AI in de klas.💻
Kritisch denken tegen nepnieuws.
Samen voor een betere digitale toekomst.🌍
#vgc #OnderwijsinBrussel
Meer info👉prez.ly/ZFvd


3
371

19 Mar 2024
#DataBuzz from @LoknitiCSDS
New revelations show #DMK's #electoralbond haul at Rs 656.5 crore, with a significant chunk - Rs 509 crore - sourced from lottery mogul #SantiagoMartin's #FutureGaming.
@sanjaycsds
@PalshikarSuhas
@SandeepShastri2
@csdsdelhi
1
4
2,100
19 Mar 2024
#DataBuzz from @LoknitiCSDS
New data from #SBI reveals #BJP's hefty encashment of #ElectoralBonds, amounting to Rs 6,986.5 crore. In 2019-20 alone, they received Rs 2,555 crore, while #Congress redeemed Rs 1,334.35 crore in total.
1
1
4
2,124
18 Mar 2024
#DataBuzz from @LoknitiCSDS
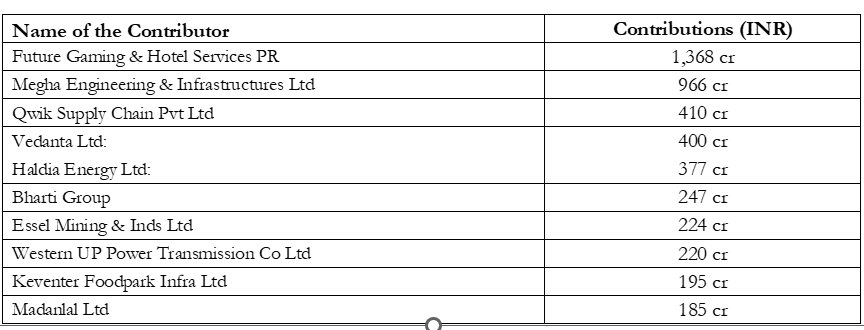
The data on #ElectoralBonds also indicates:
#JD(S) received Rs 89.75 crore, with a significant chunk from #MeghaEngineering. #DMK got Rs 509 crore from #FutureGaming, nearly 37% of the company's total donations.
1
4
1,906
18 Mar 2024
#DataBuzz from @LoknitiCSDS
The data on #electoralbonds also shows:
#Odisha's #BJD securing fourth spot with Rs 944.5 crore, trailed by #DMK at Rs 656.5 crore, and finally followed by #YSRCongress at nearly Rs 442.8 crore.
1
2
1,486
18 Mar 2024
#DataBuzz from @LoknitiCSDS
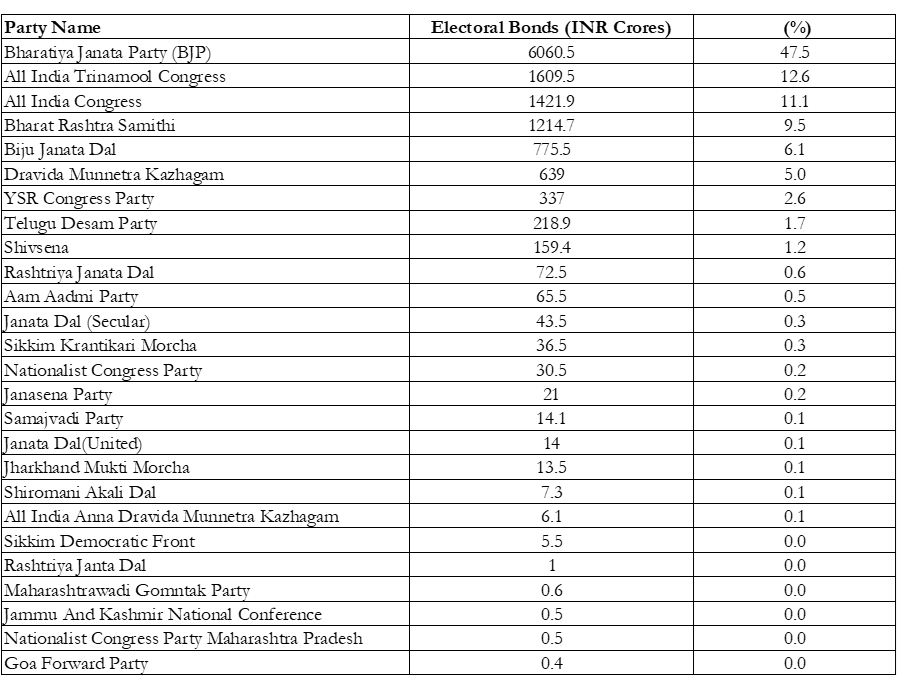
Fresh data on #electoralbonds released by the #ECI, reveals:
#BJP leads with Rs 6,986.5 crore, followed by #TrinamoolCongress (Rs 1,397 cr), #Congress (Rs 1,334 cr), and #BharatRashtraSamithi (Rs 1,322 cr) in electoral bond funds.
1
2
10
1,705
15 Mar 2024
#DataBuzz from @LoknitiCSDS
The #SBI data also shows that 22,030 out of 22,217 #electoralbonds redeemed; unclaimed bonds' proceeds go to #PMNRF. SBI's affidavit to SC shows un-encashed bonds transferred, highlighting redemption disparity pre & post April 11, 2019.
1
1
6
1,792
15 Mar 2024
#DataBuzz from @LoknitiCSDS
The data also shows multiple political parties benefiting from #ElectoralBonds.
@sanjaycsds
@PalshikarSuhas
@SandeepShastri2
@csdsdelhi
3
9
3,035
15 Mar 2024
#DataBuzz from @LoknitiCSDS
The data on #ElectoralBonds disclosed by the #SBI, reveals #topcontributors to political parties.
@sanjaycsds
@PalshikarSuhas
@SandeepShastri2
@csdsdelhi
5
18
2,960
4 Mar 2024
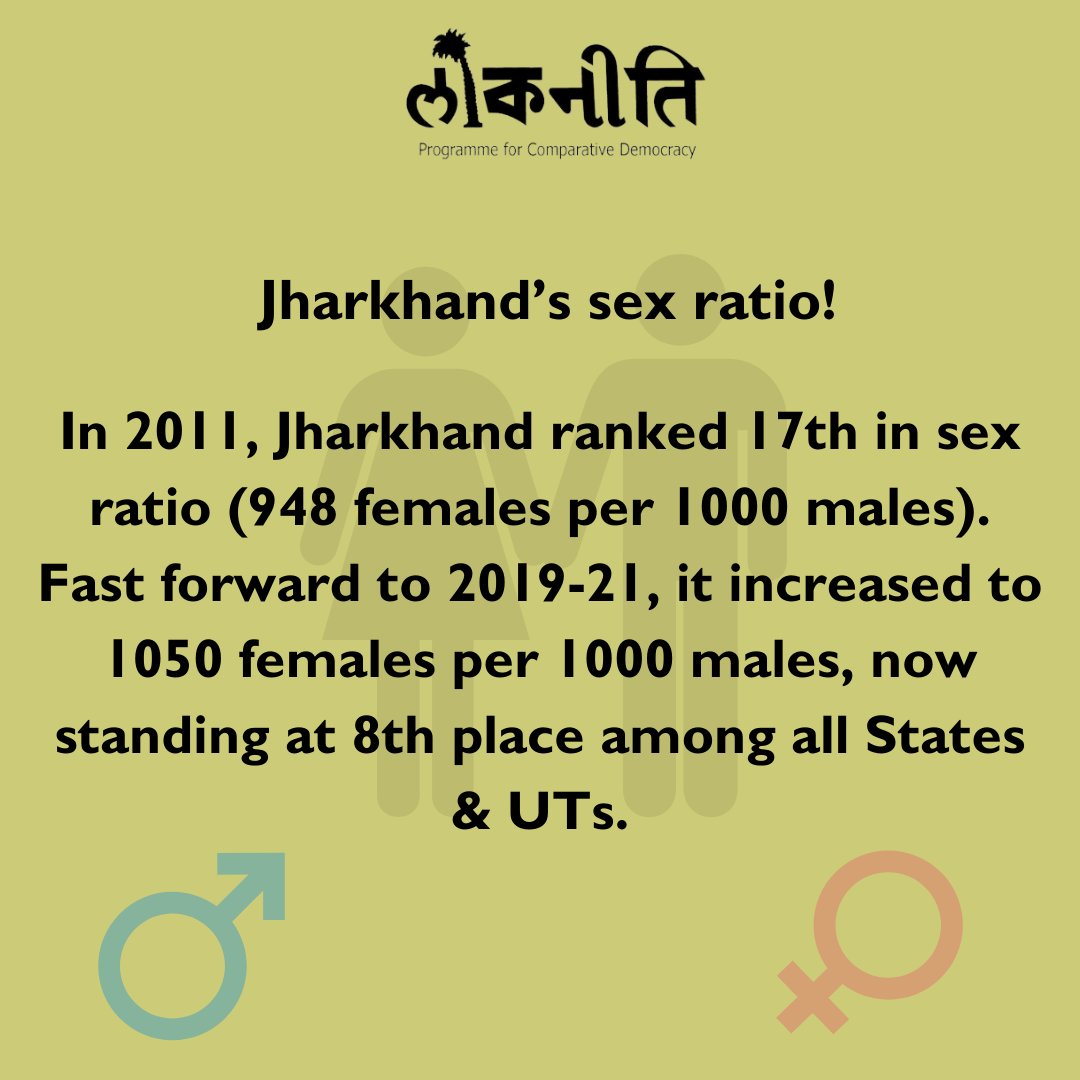
#DataBuzz from @LoknitiCSDS:
Amazing progress in Jharkhand's #sexratio -From 17th in 2011 to 8th in 2019-21, with 1050 females per 1000 males. A commendable stride towards gender equality
#Jharkhand #GenderEquality
@sanjaycsds
@PalshikarSuhas
@SandeepShastri2
@csdsdelhi
2
4
1,126
1 Mar 2024
#DataBuzz from @LoknitiCSDS: Haryana's gender equality sees a decline despite improvements post #BetiBachaoBetiPadhao Scheme.
#SexRatio #Lokniti #GenderEquality #Haryana
@sanjaycsds
@PalshikarSuhas
@SandeepShastri2
@csdsdelhi

3
871
1 Mar 2024
#DataBuzz from @LoknitiCSDS: #Lakshadweep celebrates a victory for #genderequality- From ranking 18th in 2011 to leading all States & UTs with 1187 females per 1000 males.
#Lakshadweep #GenderEquality #SexRatio
@sanjaycsds
@SandeepShastri2
@PalshikarSuhas
@csdsdelhi

3
6
994
29 Feb 2024
#DataBuzz from @LoknitiCSDS: UP's sex ratio soaring- From 912 females per 1000 males in 2011 to 1017 in 2019-21, now ranking 16th among all States and UTs.
#Progress #GenderEquality #lokniti #UP
@sanjaycsds
@PalshikarSuhas
@SandeepShastri2
@csdsdelhi

2
5
1,565