
Jun 8
🌌✨ ASTROMYSTIC AI Early Access Has Started! ✨🌌
📲 Free Early Access Join Link:
play.google.com/apps/testing…
Are you ready to discover the next-generation AI-powered astrology experience before everyone else?
We are looking for early access users to test our ASTROMYSTIC AI app! 🔮
🌍 With support for 40 different languages, users from all around the world can enjoy the experience in their own language.
✨ Personalized astrological destiny readings
🧠 AI-powered emotion analysis
🌙 Astrology & energy interpretations
💫 Premium and modern user experience
🎁 Special opportunity for early access users!
By simply tapping the Premium Membership screen inside the app, you can activate Premium completely free and:
✔ Access all premium features without limits
✔ Experience advanced AI analyses
✔ Enjoy an ad-free experience
✔ Get early access to upcoming features
✔ Test the app like a full premium version
Our goal is to improve the app together with user feedback.
By sharing your experience, you can become part of the future of ASTROMYSTIC AI. 🌌
✨ Discover what the stars are trying to tell you…
With ASTROMYSTIC AI, the universe is now in your pocket. 🔮🌙
#AstromysticAI #Astrology #ArtificialIntelligence #AI #Horoscope #Zodiac #EmotionAnalysis #Spirituality #PersonalGrowth #EarlyAccess #GooglePlay #FreePremium #MobileApp #AIApp #AstrologyApp #40Languages #AIPowered #Mystic #EnergyAnalysis #MadeInTurkey #BetaTesting

2
46

May 15
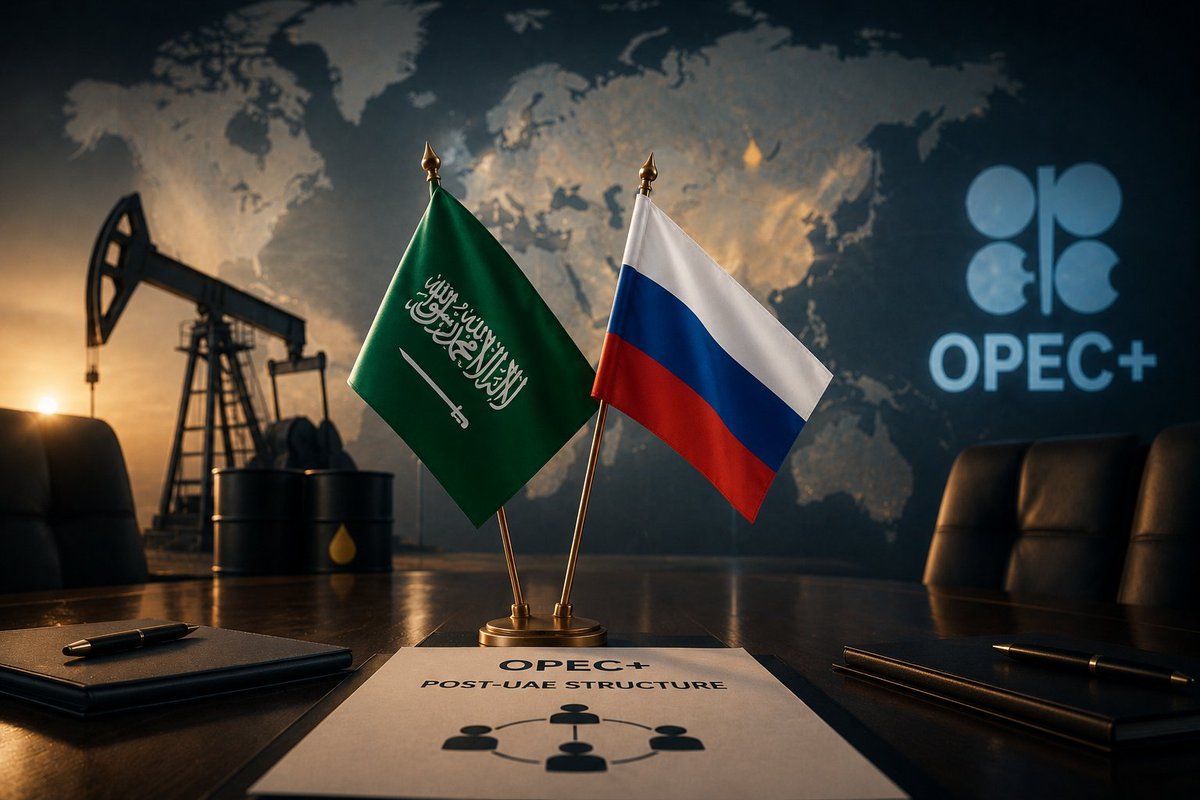
Are Saudi Arabia and Russia quietly building a new OPEC order?
That's one of the central questions in this week's Energy Weekly Intelligence report:
▪️ Saudi–Russian coordination after the UAE's OPEC exit: signal or structural shift?
▪️ Qatar's LNG strategy under prolonged Hormuz disruption
▪️ Egypt's expanding East Mediterranean role amid Gulf supply gaps
▪️ Escalating market-share competition and pricing response risks
Essential reading for anyone tracking energy markets, OPEC dynamics, and MENA supply flows.
📩 Full briefing: tacticalreport.com/weekly/64…
#EnergyAnalysis #OPEC #LNG #MENA #EnergyPolicy
1
2
428

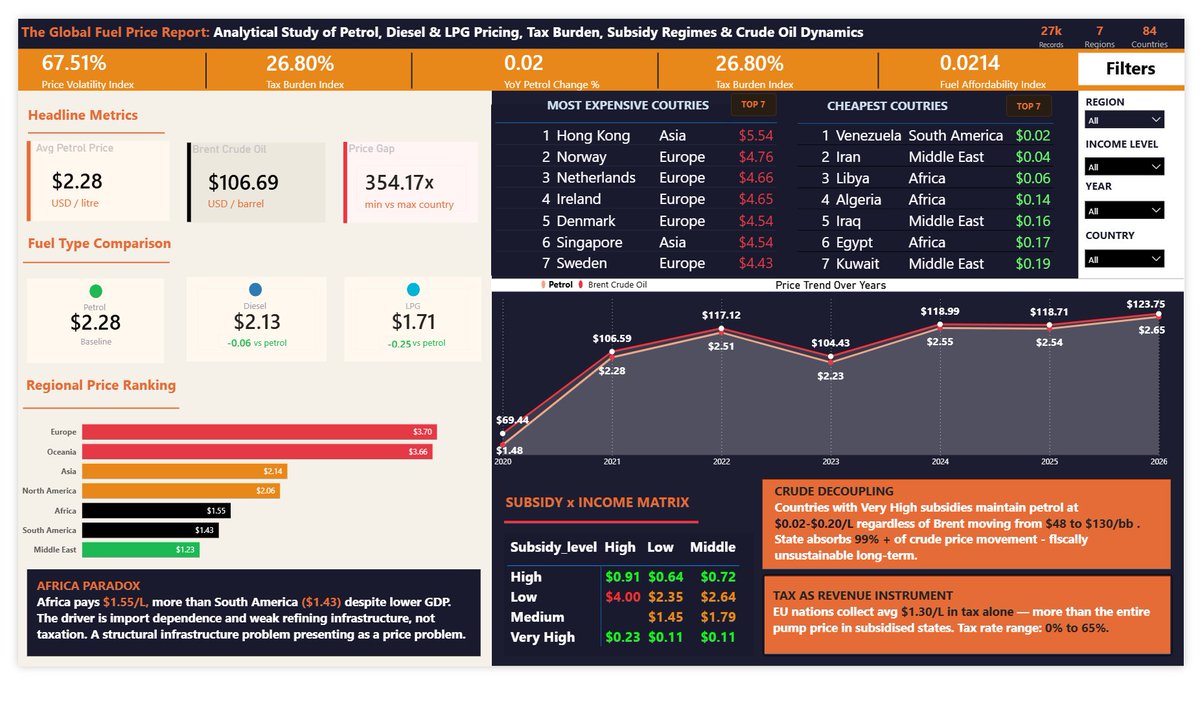
Just completed my April Challenge dashboard (even though past the deadline, but it's something I had to do, and I learned so much, the best project I have worked on so far)
The Global Fuel Price Report: Analytical Study of Petrol, Diesel & LPG Pricing, Tax Burden, Subsidy Regimes & Crude Oil Dynamics
DATA ENGINEERING: Built 14 new calculated columns in Power Query and DAX including price-to-crude ratios, tax amount in USD, price band classifications, subsidy gap index and more.
Key findings from 84 countries · 7 regions · 2020–2026 · 27,468 records:
→ Venezuela pays $0.02/L. Hong Kong pays $5.54/L That is a 354x price gap in the same world
→ Europe pays 3x more than the Middle East
Not because crude costs more, because governments tax more
→ 2020 COVID collapse dropped global avg to $1.48/L, 35% below the all-time average
→ Post-2022 prices remain 71% above 2020 despite crude stabilising, prices rise faster than they fall
→ Africa pays MORE than South America despite lower GDP, an infrastructure problem presenting as a price problem
Built entirely in Power BI from raw data to full dashboard, columns, DAX, measures, conditional formatting and all.
@ezekiel_aleke
#PowerBI #DataAnalytics #FuelPrices #April #DataChallenge #EnergyAnalysis #DAX #aprilchallengewithezekiel


1
10
279

Apr 13
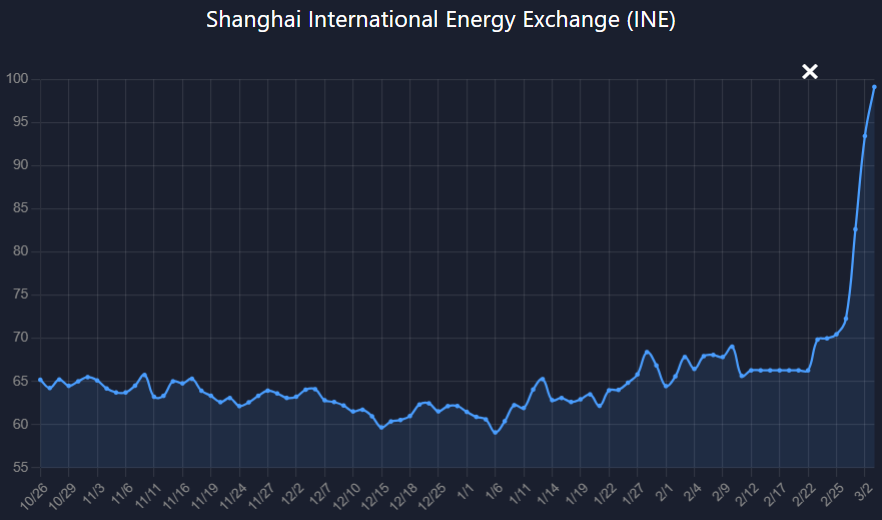
Oil Market Split: Spot Panic, Softer Futures and the Hormuz Risk Premium
It was a pleasure to join @scarletfu & @ptsweeney on @BloombergRadio this morning to chat about the latest on Iran & energy markets.
Oil prices jumped above $100 a barrel after the U.S. blockade of the Strait of Hormuz, but the market reaction remained more restrained than in past supply shocks. The key tension is whether the conflict fades through backchannel negotiations or extends long enough to keep a large geopolitical risk premium embedded in crude prices. Spot barrels are trading tighter than futures, signaling immediate physical stress even as longer-dated contracts imply some expectation of normalization.
#OilPrices #StraitOfHormuz #EnergyMarket #GlobalEconomy #BrentCrude #WTI #OilTrading #Geopolitics #USBlockade #MarketVolatility #Commodities #EnergyCrisis #OilFutures #SpotMarket #SupplyChain #MiddleEastConflict #RobBarnett #BloombergIntelligence #EconomyNews #CrudeOil #MarginCalls #TradingStrategy #EnergyAnalysis #FuelPrices #GlobalTrade
1
2
512

Mar 23
At Stratas Advisors, we empower organizations across the #energy and #transportation ecosystem to navigate uncertainty, seize opportunities, and achieve their strategic goals in a rapidly evolving landscape of markets, regulations, technology, and competition.
#energyanalysis
2
2
28

Why do we have gas, turbines, and money, yet still have no light? 🕯️. Most Nigerians think it’s just corruption but the reality is in the Fiscal side. If you want to understand why your estate is still on a generator, read this🧵 👇🏾 #PowerSector #EnergyAnalysis
#Nigeria2026
2
1
2
159

Mar 7
Kwadwo Nsafoa Poku, Energy Analyst and NPP member, warns that tensions in the Middle East, including a possible disruption of the Strait of Hormuz could push crude oil prices higher and limit refined fuel supply.
He says the situation could trigger rising fuel prices and increased economic pressure on Ghana.
Watch live here: youtube.com/live/KdNXn-dQN-c…
#TheBigIssue #FuelPrices #GhanaEconomy #EnergyAnalysis #MiddleEastTensions #ChannelOneTV #CitiFM
1
1
866

Mar 4
Your chart's isn't oil price at $100 @OilCfd
It's jet fuel crack spread.
You have ZERO CRED
#OilMarkets #JetFuel #RefiningMargins #EnergyMarkets #CrackSpreads #Commodities #OilTrading #EnergyAnalysis @seb_kennedy

2
22
4,544

Jan 15
How do you assess Asia’s demand growth outlook and its leading growth markets?
Click here to watch the full video soundbite: youtu.be/pFO2Ke2-q-A
#EnergyInsights #MarketOutlook #ThoughtLeadership #EnergyAnalysis #XAnalysts #GEOF2026 #EnergyOutlook #GlobalEnergyOutlookForum2026 #OilAndGas #EnergyMarkets #OilMarkets

5
98

Why Venezuela’s oil won’t return quickly: Amena Bakr, Head of Middle East Energy & Opec at Kpler explains why expectations around Venezuela’s #oil production need to remain grounded. Despite political headlines, rebuilding meaningful oil capacity takes years of sustained investment and stability — neither of which is in place today. From an OPEC perspective, there is no immediate supply surge on the horizon.
Stay ahead of the market with #Kpler Insight: okt.to/K7axs0
#Venezuela #OPEC #EnergyAnalysis
3
19
3,412
19 Nov 2025
Gain insight into the likely future evolution of the #energy demand and vehicle mix, including the roles of conventional and alternative fuels, changes in vehicle miles traveled, and more. #cleantech #energyconsulting #automotivefleets #energyanalysis
1
2
39
6 Nov 2025
Oil markets remain oversupplied into Q1 2026, with record “oil on water” volumes and sanctioned cargoes pressuring sentiment.
#OilMarkets #EnergyOutlook #CrudeOil #RefiningMargins #Geopolitics #OilSupply #EnergyAnalysis #Commodities

2
2
361
4 Nov 2025
Funny how folks with no oil patch experience are screaming “glut, @ZiadMDaoud
While those with skin in the game—Gunvor, Diamondback, OPEC—aren’t buying it.
Reductionists 0, Big Picture 10.
#OilMarkets #OPEC #EnergyAnalysis #Commodities
4 Nov 2025

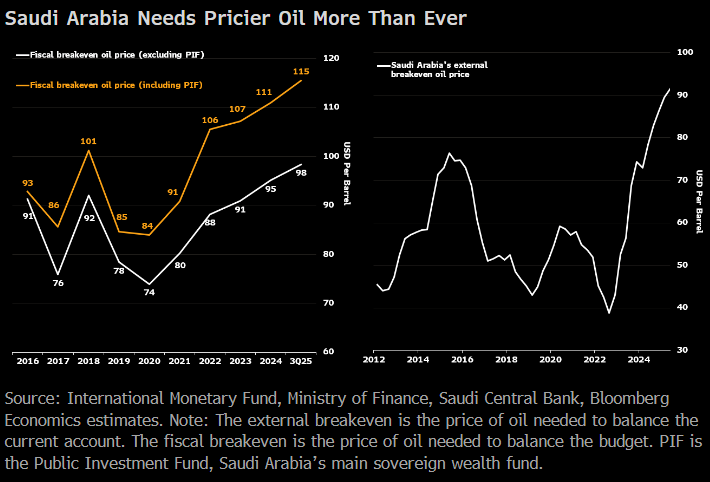
My latest: OPEC blinked — and Saudi data explain why
Why did OPEC decide to pause after months of flooding the market?
The reason isn’t just at sea, with a glut of oil piling up on tankers
It’s also in Riyadh’s books — Saudi has never been more dependent on oil
3
1,758

6 Oct 2025
The next oil shock might not come from politics — it could come from geology.
Here’s why declining wells could reshape the energy market:
👉 oilmarkets.substack.com/p/th…
Stay ahead with Oil Markets—real analysis:
oilmarkets.substack.com/
#OilNews #OilAndGas #EnergyAnalysis #OilMarkets
1
3
3
168
6 Oct 2025
Oil production is slowing.
Prices are rising.
Investors are asking: what’s next?
Find out in our latest analysis 👇
oilmarkets.substack.com/p/th…
Subscribe for more energy insights:
oilmarkets.substack.com/
#OilAndGas #CrudeOil #EnergyAnalysis #OilMarkets
2
2
211
6 Oct 2025
Global oil wells are depleting faster than expected.
What does this mean for prices, investors, and the future of energy supply?
Read the full breakdown
oilmarkets.substack.com/p/th…
subscribe here: oilmarkets.substack.com/
#Oil #OilMarkets #EnergyAnalysis #OilAndGas
2
3
97

26 Sep 2025
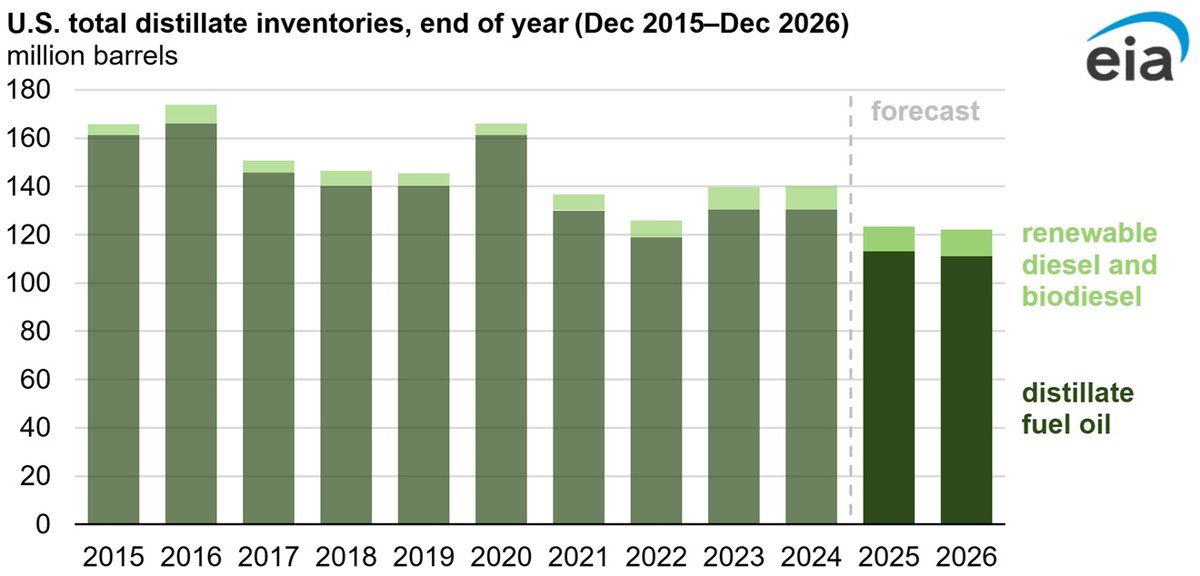
U.S. total #distillate inventories forecast to end 2025 and 2026 at multiyear lows
read the #analysis: ow.ly/SZTR50X1z83
#DistillateInventories #EnergyForecast #OilMarket #USEnergy #OilAndGas #EnergyAnalysis #EIAData
1
2
123
25 Sep 2025
U.S. total #distillate inventories forecast to end 2025 and 2026 at multiyear lows
read the #analysis: ow.ly/CyJ550X1z85
#DistillateInventories #EnergyForecast #OilMarket #USEnergy #OilAndGas #EnergyAnalysis #EIAData

2
64
24 Sep 2025
Receive in-depth analysis of the #supplychains and #investments supporting the expansion of #electricvehicles and other industries focused on reducing #GHG emissions with our Clean Tech and Battery Supply Chains service.
#energyconsultants #energyanalysis #energytransition
2
2
38

17 Sep 2025
📖🔗 Full analysis: Why "Drill Baby Drill" can't save us from the coming Energy Crisis ↓
markstein3.substack.com/p/th…
#SubstackRead #EnergyAnalysis #Investing
1
4
7
251