
Jun 10
energymap Os clientes da Temu no brazil economizam mais com código de desconto, cupom, código promocional, código promo, voucher e vale desconto 🌤👩🚒🤛

4

Apr 17
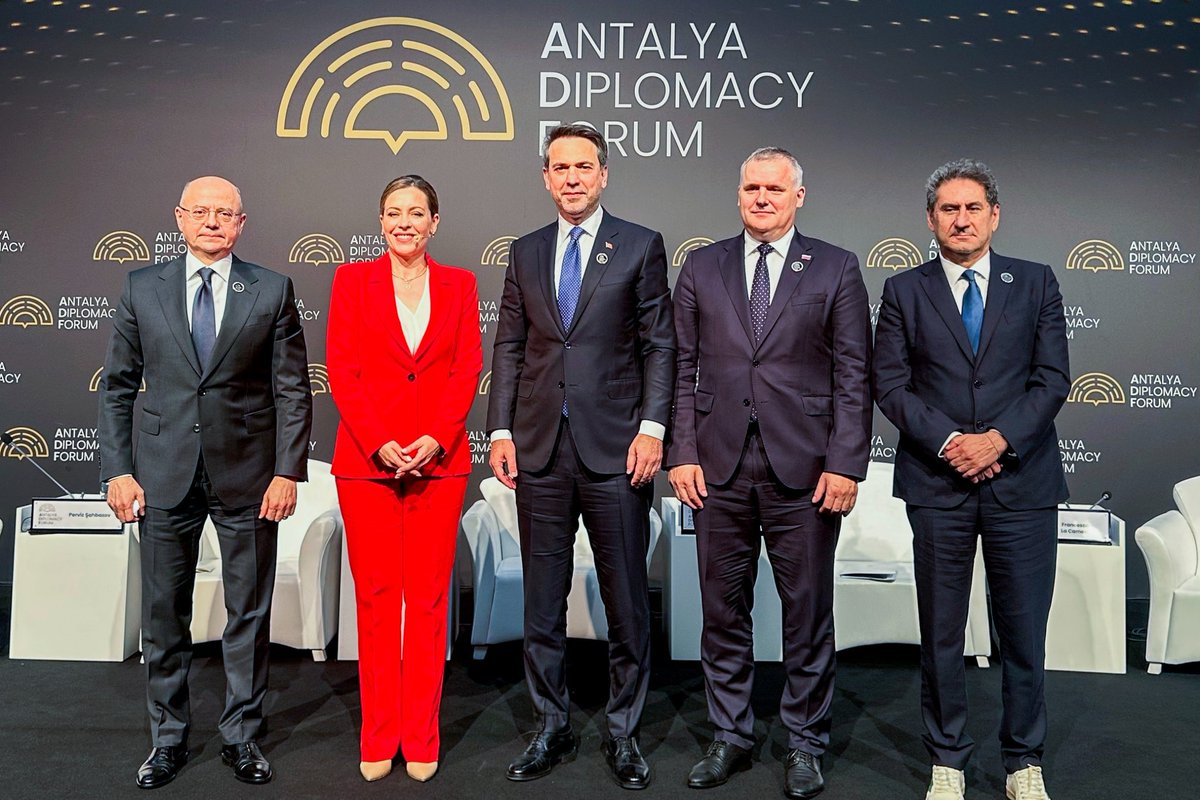
During the ministerial panel held within the framework of the Antalya Diplomacy Forum (@AntalyaDF), we shared our views on secure, affordable and #sustainable #energysupply in a geopolitical environment marked by supply chain disruptions and price volatility in #energymarkets, the management of uncertainties in the #energysector, as well as the importance of diversifying #energysources and routes. We discussed Azerbaijan’s policy, which is based on the parallel development of all types of #energy and #supply routes, and has enabled the country to stand out on the modern #energymap.
#ADF2026


10
23
635


energymap 💐📑🧳.
كؤد خصم تيمو

2
2
7

Jan 24
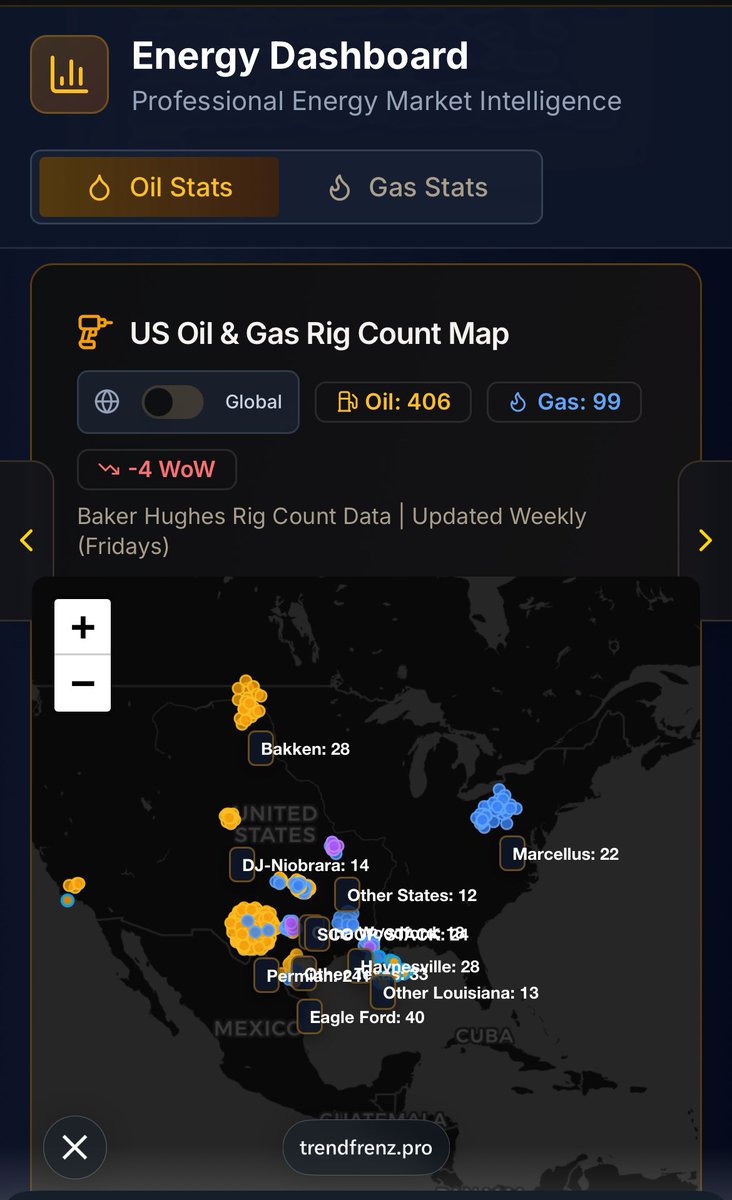
US rig count map shows 406 oil 99 gas rigs active, down -4 WoW with Permian leading at ~244 #RigCount
#EnergyMap 🗺️📉
Follow @trendfren_pro for more pro energy insights! 🚀
2
304

21 Dec 2025
⏰👨📘 energymap.\\\
▬كود▬خصم▬قصر▬الاواني▬ألدخىل▬للعؤد▬كؤبون▬RM31▬فعأل▬ؤلف▬CPP▬مغربى▬RR11▬قؤى▬رىف▬للعطؤر▬أؤسمأ▬ألأمأرأت▬ممتأح▬عطؤر▬جرأس▬RR12▬ألعىسائي▬للأطفأل▬تطبىق▬أسعأر▬قرأس▬سؤىتر▬ألسعؤدىة▬سكؤأت▬ؤؤلف▬

1
1
12

20 Nov 2025
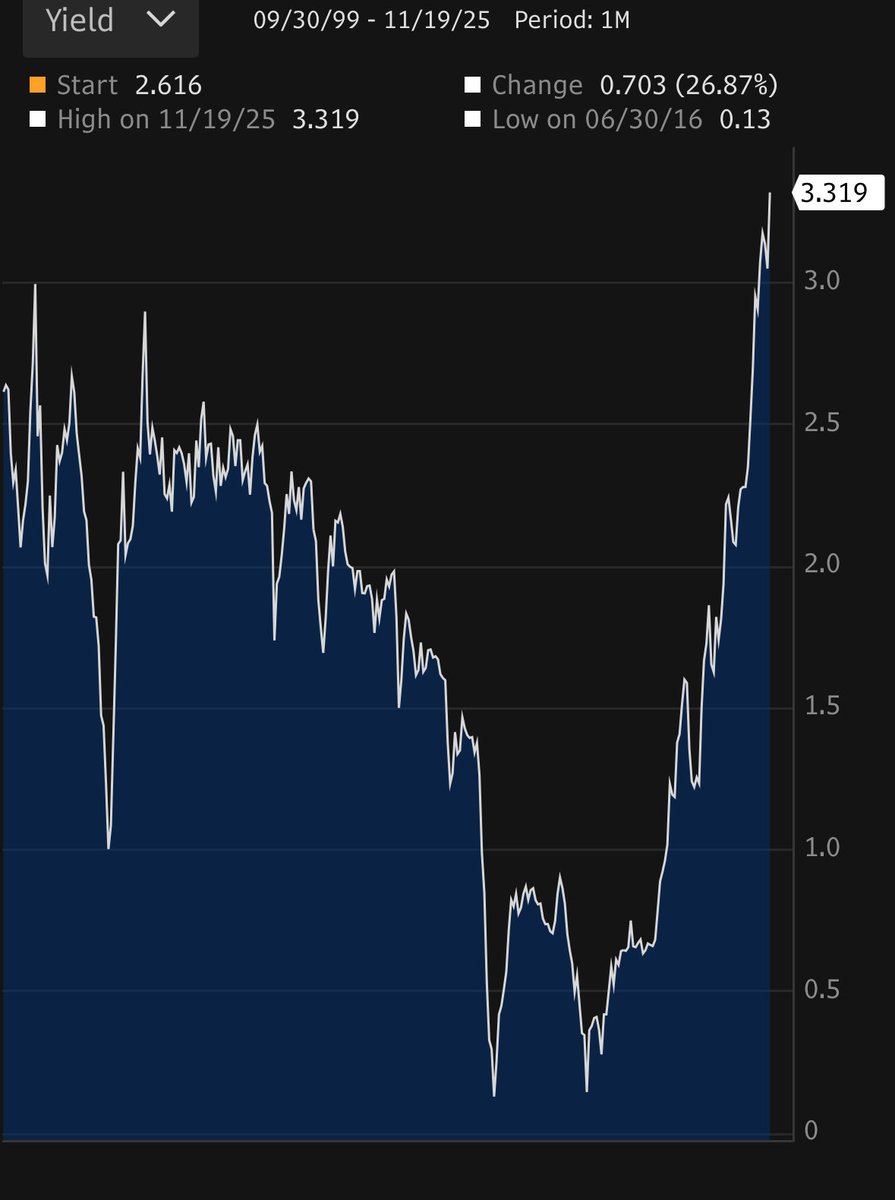
Everyone talks about Japan’s 30Y “highest yield in history ”
We just zoom out and see the whole path🗺️
Bottom was drawn✅
Breakout was expected✅
Targets are already marked✅
No surprise
No panic
Just the system moving from one box to the next …
JP30Y → first confirmation
Next stations: 4.21% → 5.04% 🟡📈
👨🎨
#Japan30Y #Bonds #Macro #CarryTrade #Nikkei #SystemReading #RTrade #EnergyMap

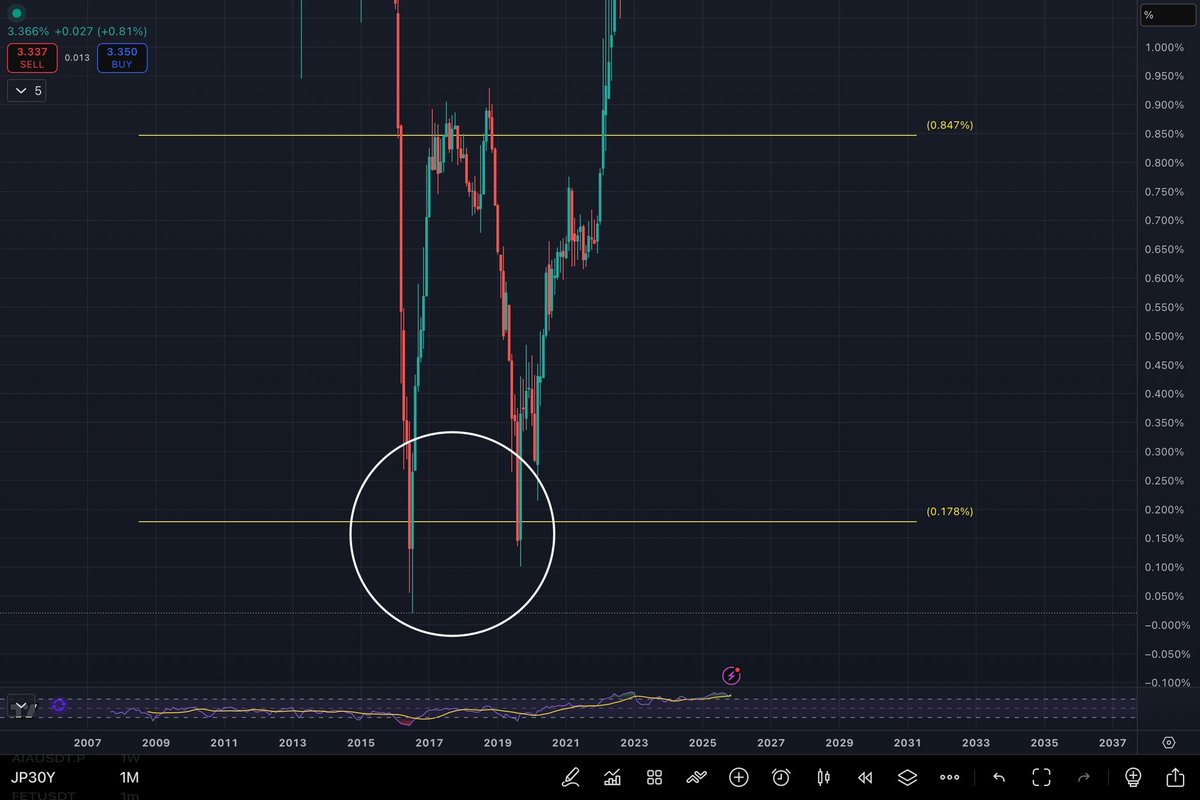

Japan’s 30y bond yield has never been higher in history than it is now
The global carry machine is on life support
1
2
780
12 Nov 2025
💭 THE ECONOMIST 2026 COVER
The world isn’t a globe this year — it’s a tangled sphere of forces.
Red vs blue, war vs chips, biology vs debt.
Read the currents, not the noise ⚡️
#TheEconomist #Economist2026 #Macro #Geopolitics #AI #War #Biotech #Markets #SystemReading #EnergyMap #RTrade #Future #GlobalTrends #World2026 #Investing

1
1
5
873
12 Nov 2025
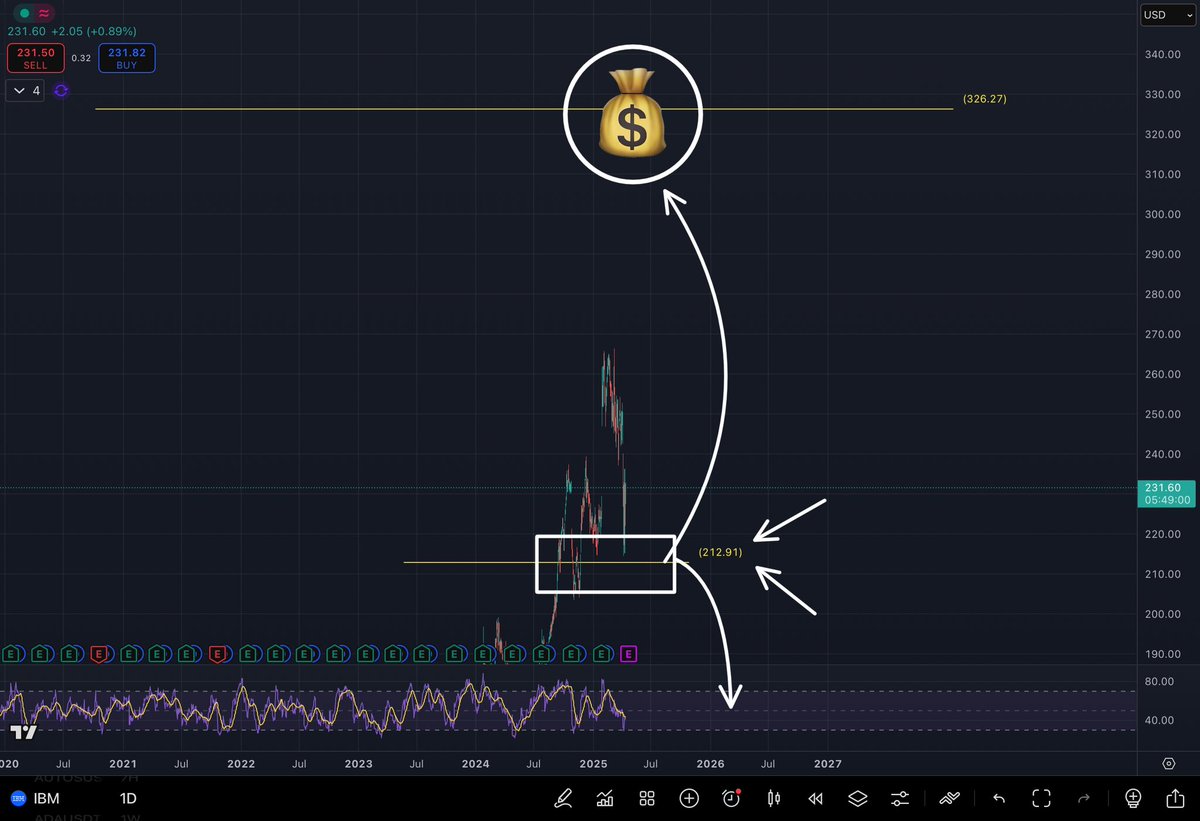
📍 $IBM
Months ago, the system marked $212.91 as the base.
Today — target fulfilled to the cent🎯🎯
This is not prediction …
This is reading the system⚡️
Few
👨🎨
#RTrade #EnergyMap #IBM #SystemReading


2
551

4 Sep 2025
⚡️ #EnergyMap: During August 25-31, #Ukraine exported the highest volume of #electricity in more than five years for the second week in a row. Exports increased by 5% and again exceeded imports, namely by six times. For the third week in a row, imports decreased, this time by 12%

1
1
105

21 Jul 2025
Just when I thought today’s sky log couldn’t get more layered… I checked my leg again. Yes — that bruise. Turns out, it wasn’t random at all. This one came encoded.
At the top, I saw it clear: an M or a pair of bunny ears. 🐰 You already know who that is if you’ve been following — @white_Rabbit_OG, aka MJT, aka Skywalker, aka the 5D bunny we spotted in the clouds the other day.
Then below that? A key. And not just any key — the top of it has a heart. 🗝️💖 A literal heart key. That’s love. That’s memory. That’s access.
🕒 Timestamping this at 15:33:
🔸 Top mark = M / Bunny / Mario / Skywalker
🔸 Bottom mark = Heart Key = Love code
🔸 Full pattern = Light-encoded, physically received message
Call it coincidence? I don’t think so.
The bruise is a message.
Received. Felt. Read.
Bruised by the Bunny.
Decoded by the Sky.
#SkyLog #EncodedMessages #5D #WhiteRabbit #DivineTiming #BunnyCodes #HeartKey #CluesEverywhere #EnergyMap #SkywalkerLog

1
1
34

18 Jun 2025
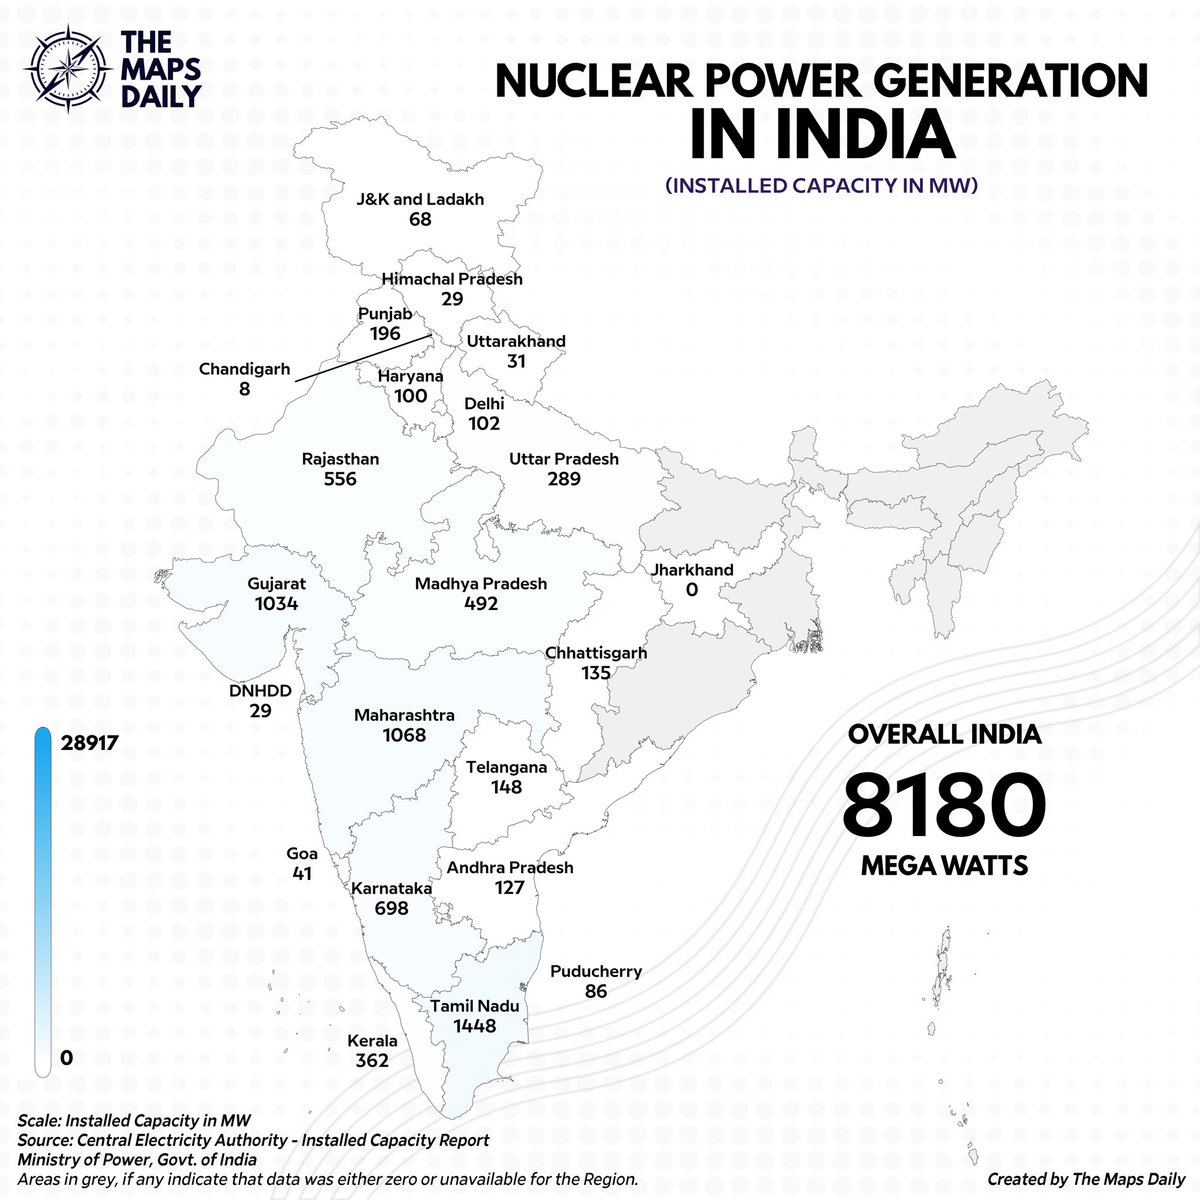
🇮🇳 India’s Nuclear Power Generation – State-wise Installed Capacity (in MW)
From Maharashtra (1068 MW) to Tamil Nadu (1448 MW), here’s how nuclear energy powers India ⚛️💡
Total capacity across India: 8180 MW
(Source: Central Electricity Authority)
#IndiaEnergy #NuclearPower #CleanEnergy #EnergyMap
🗺️: @themapsdaily
8
960
22 Jan 2025
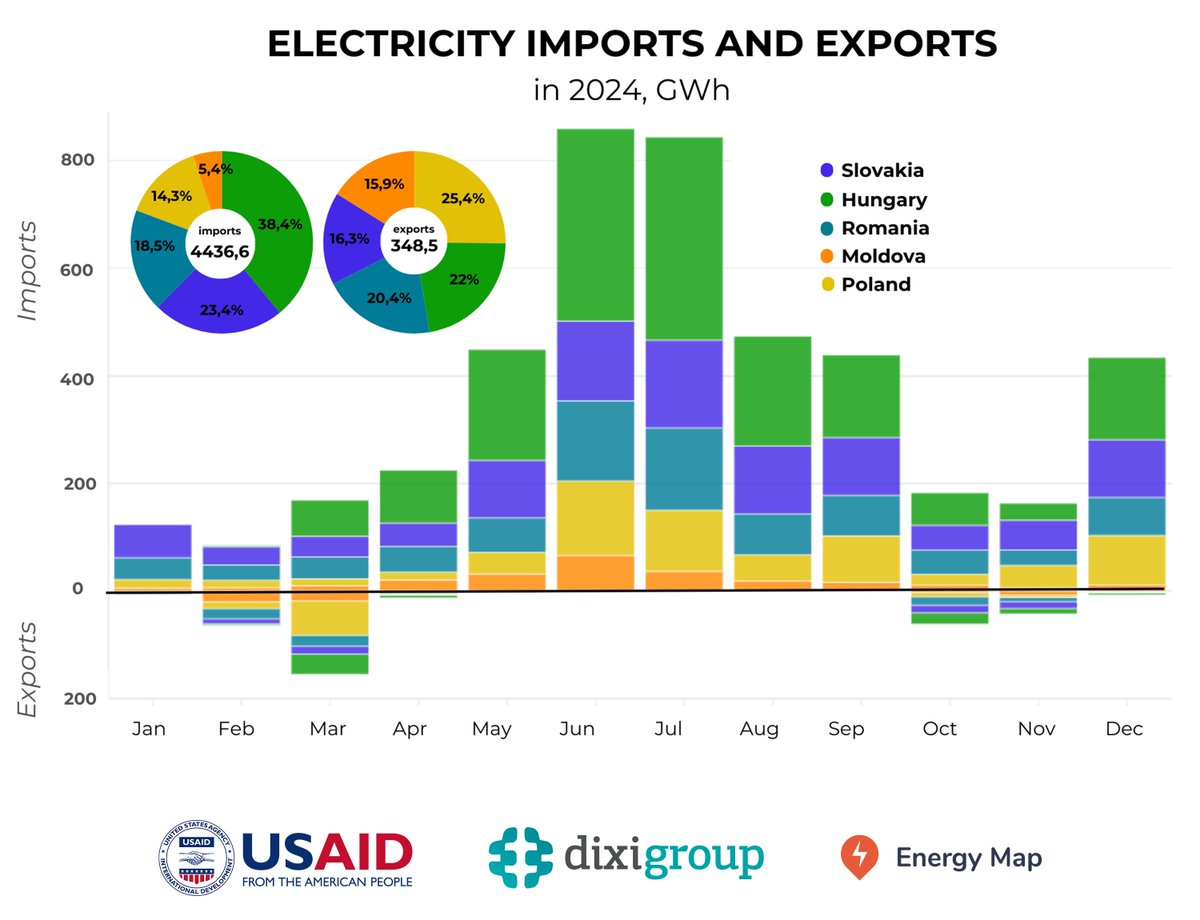
⚡️ #EnergyMap: During 2024, #Ukraine imported the most #electricity in at least the last 11 years because relevant actual data before 2014 isn't publicly available. Imports increased by 5.5 times while exports decreased by 5% to the historic minimum due to #Russia's energy terror
1
4
116

13 Jan 2025
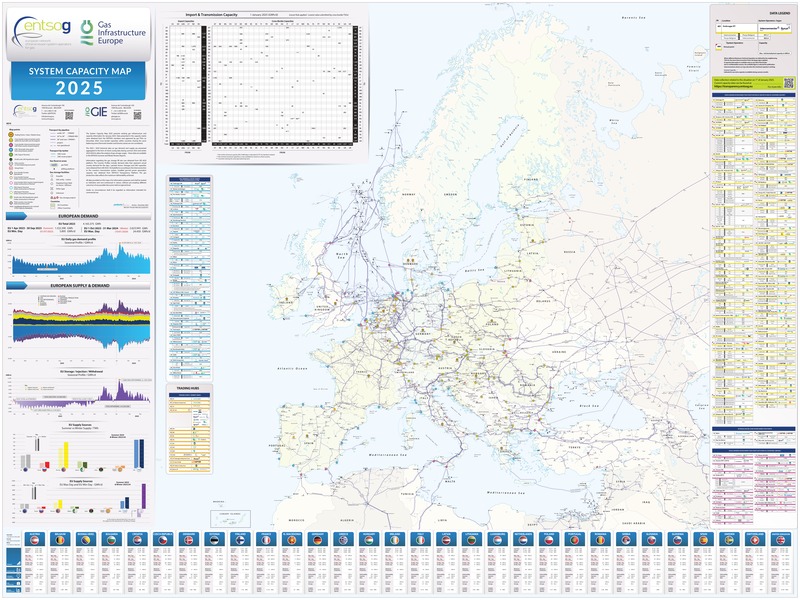
🚨 New from ENTSOG & GIE: System Capacity Map 2025! 🗺️
Features:
✅The latest insights into gas infrastructure and capacities across Europe.
✅Aggregated data on gas demand and supply from the 2023-2024 Summer and Winter Review Reports.
✅Updates on import, transmission capacity, storage fill rates, and LNG capacities.
✅Highlights of network grid projects and additional LNG terminals, as mapped in TYNDP 2024.
📖 Press Release ➡️ gie.eu/?post_type=jaic_gie_p…
📬 Order hardcopy map ➡️gie.eu/publications/maps/sys…
#energymap #GasInfrastructure #ENTSOG #GIE
3
180
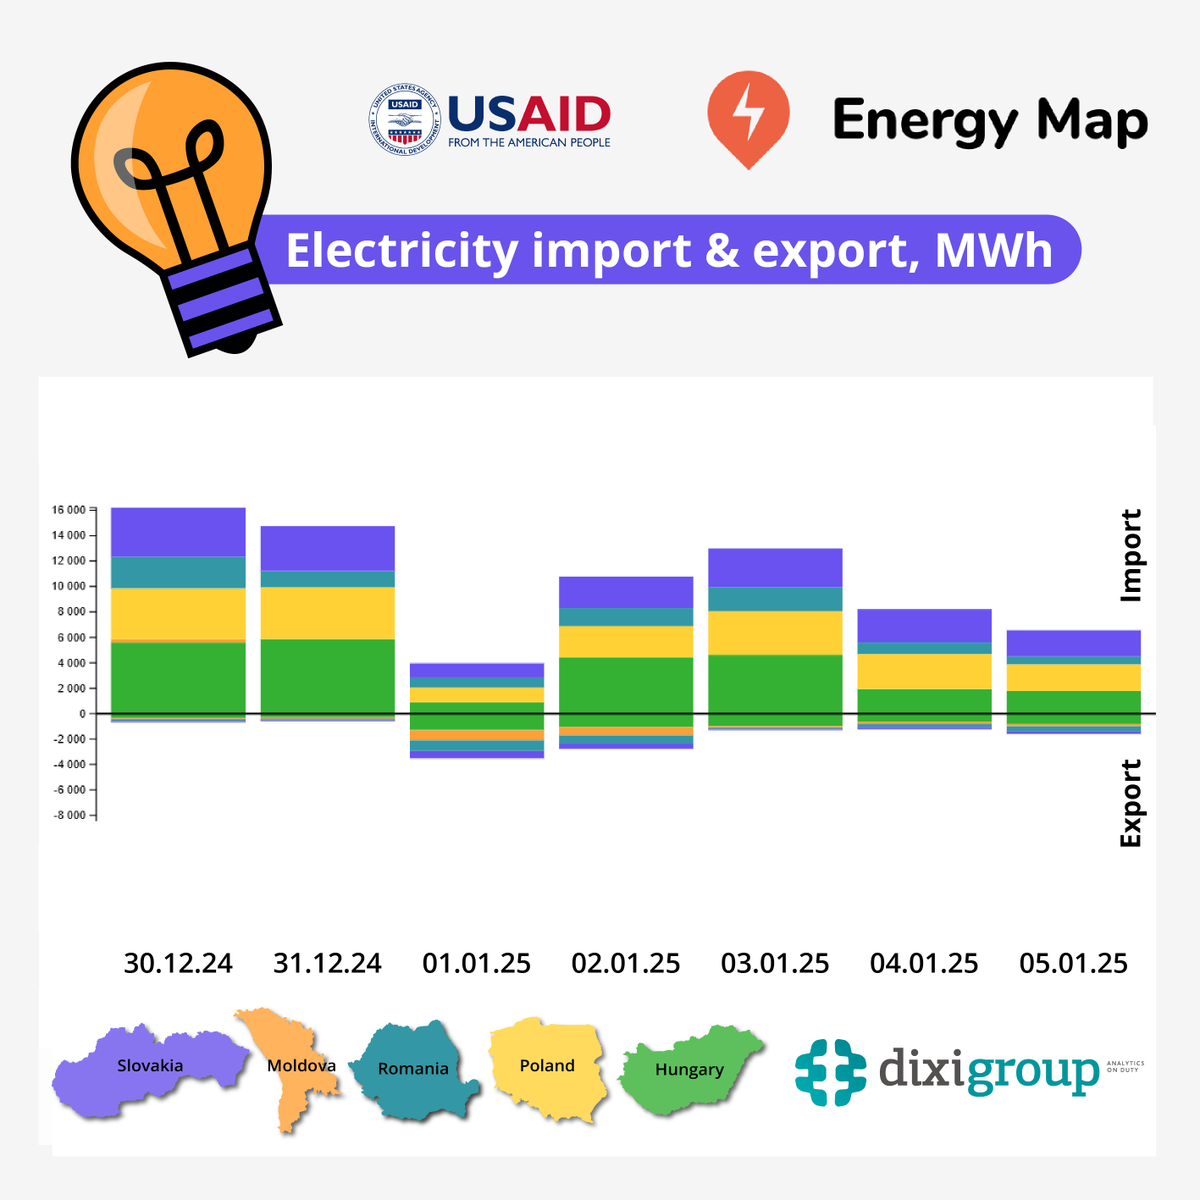
8 Jan 2025
📊 According to #EnergyMap, during December 30 - January 5, #Ukraine again exported more #electricity, this time by 2.6 times. Meanwhile, imports decreased by 32% but nevertheless exceeded exports by 6.3 times.
1
2
85
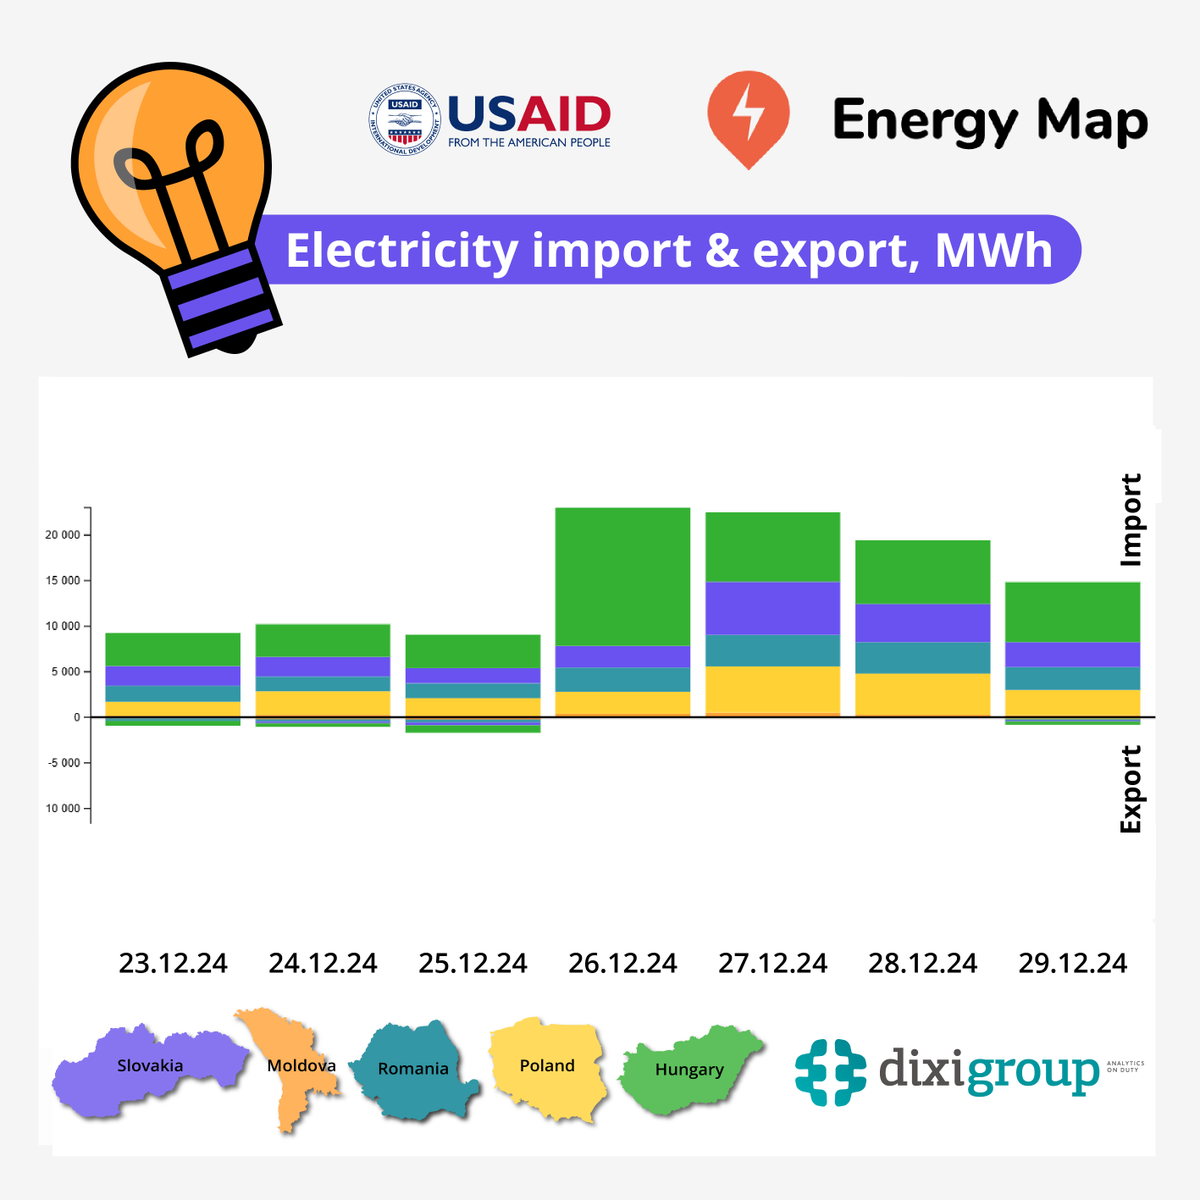
6 Jan 2025
📈 According to #EnergyMap, during December 23-29, #electricity exports increased by four times. Meanwhile, #Ukraine's electricity imports increased by only 6% but exceeded exports by as much as 24 times.
1
2
139
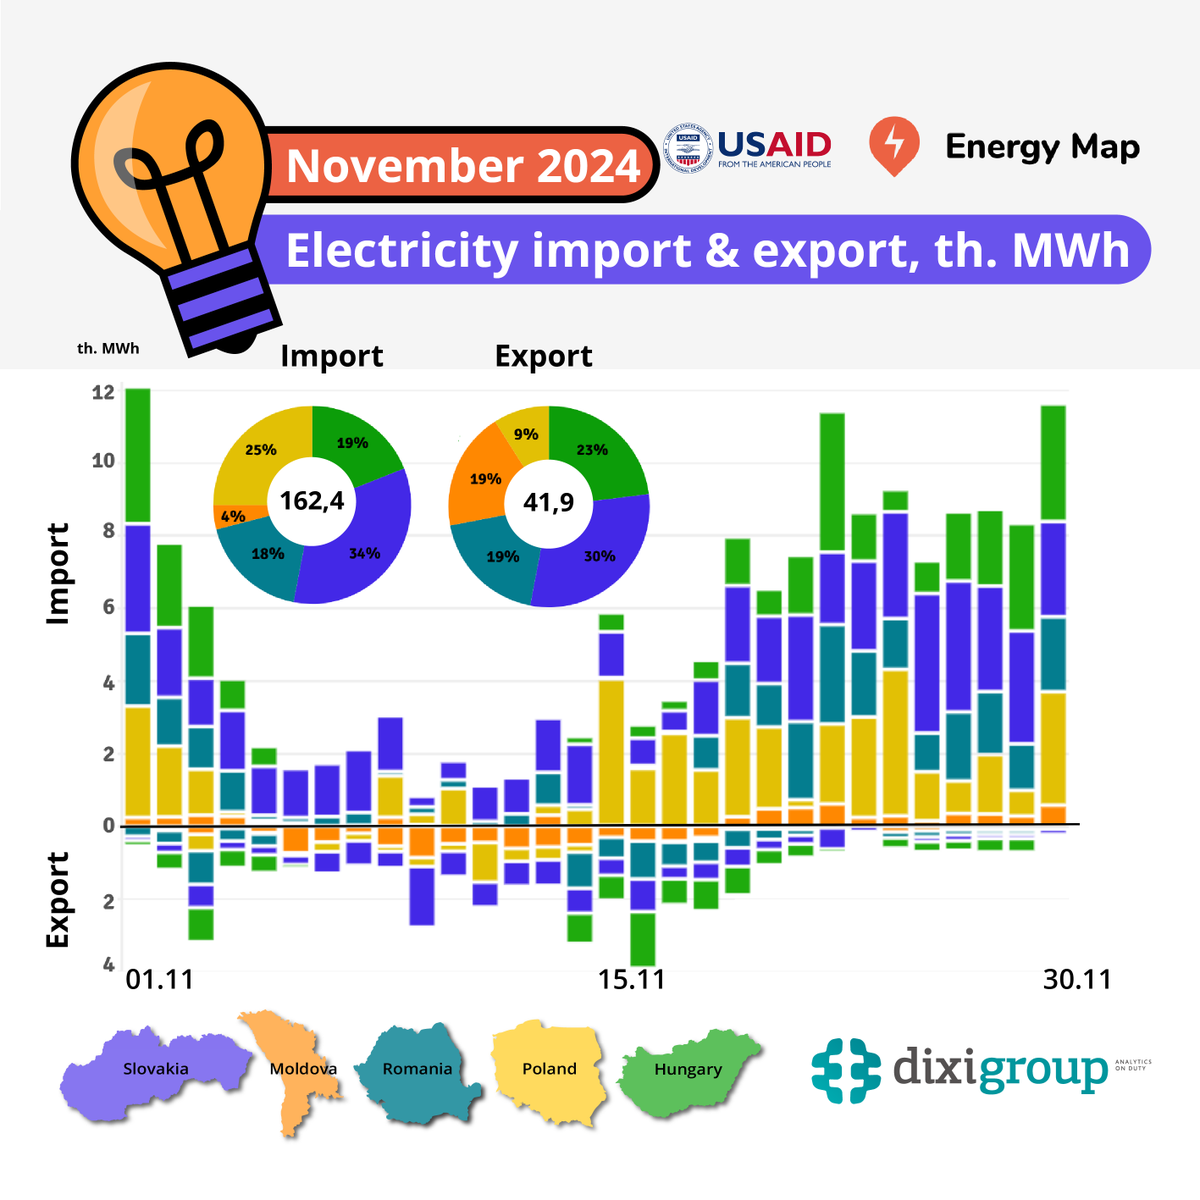
6 Dec 2024
📉 According to #EnergyMap, over the past month, both exports and imports of #electricity decreased. Compared to October, #Ukraine exported 32% less. At the same time, imports in November were 11% lower than during the previous month.
1
2
169
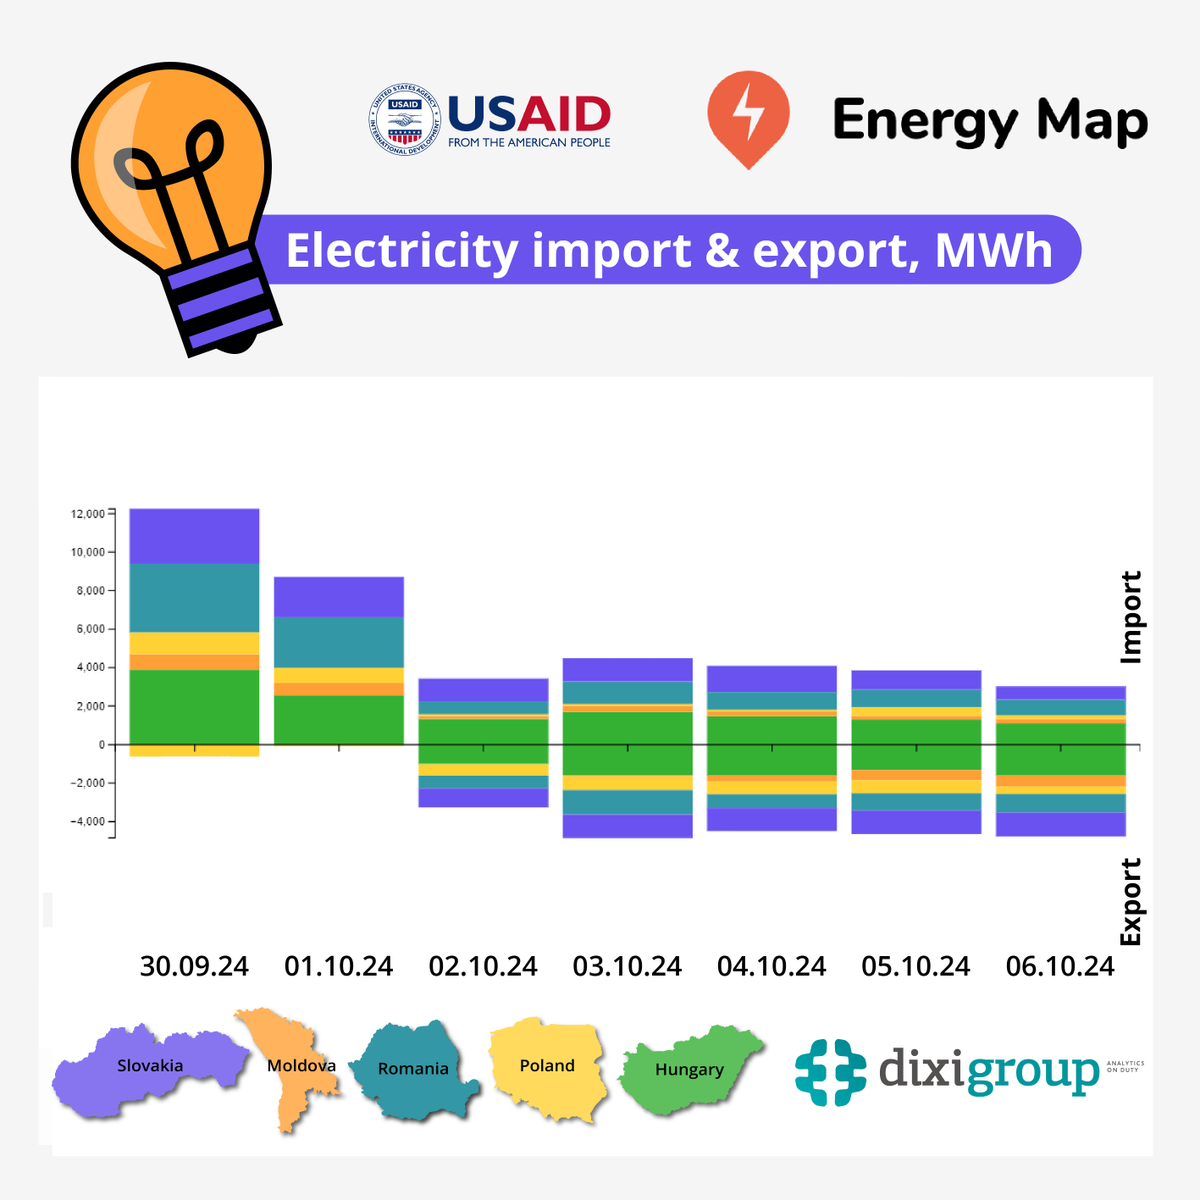
9 Oct 2024
According to #EnergyMap, during September 30 - October 6, #Ukraine's #electricity exports have increased significantly. Its daily volume has even exceeded imports by between 7% & 37% in the last 4 days of the week. Weekly imports decreased by 52% but exceeded exports by 1.8 times
1
4
136
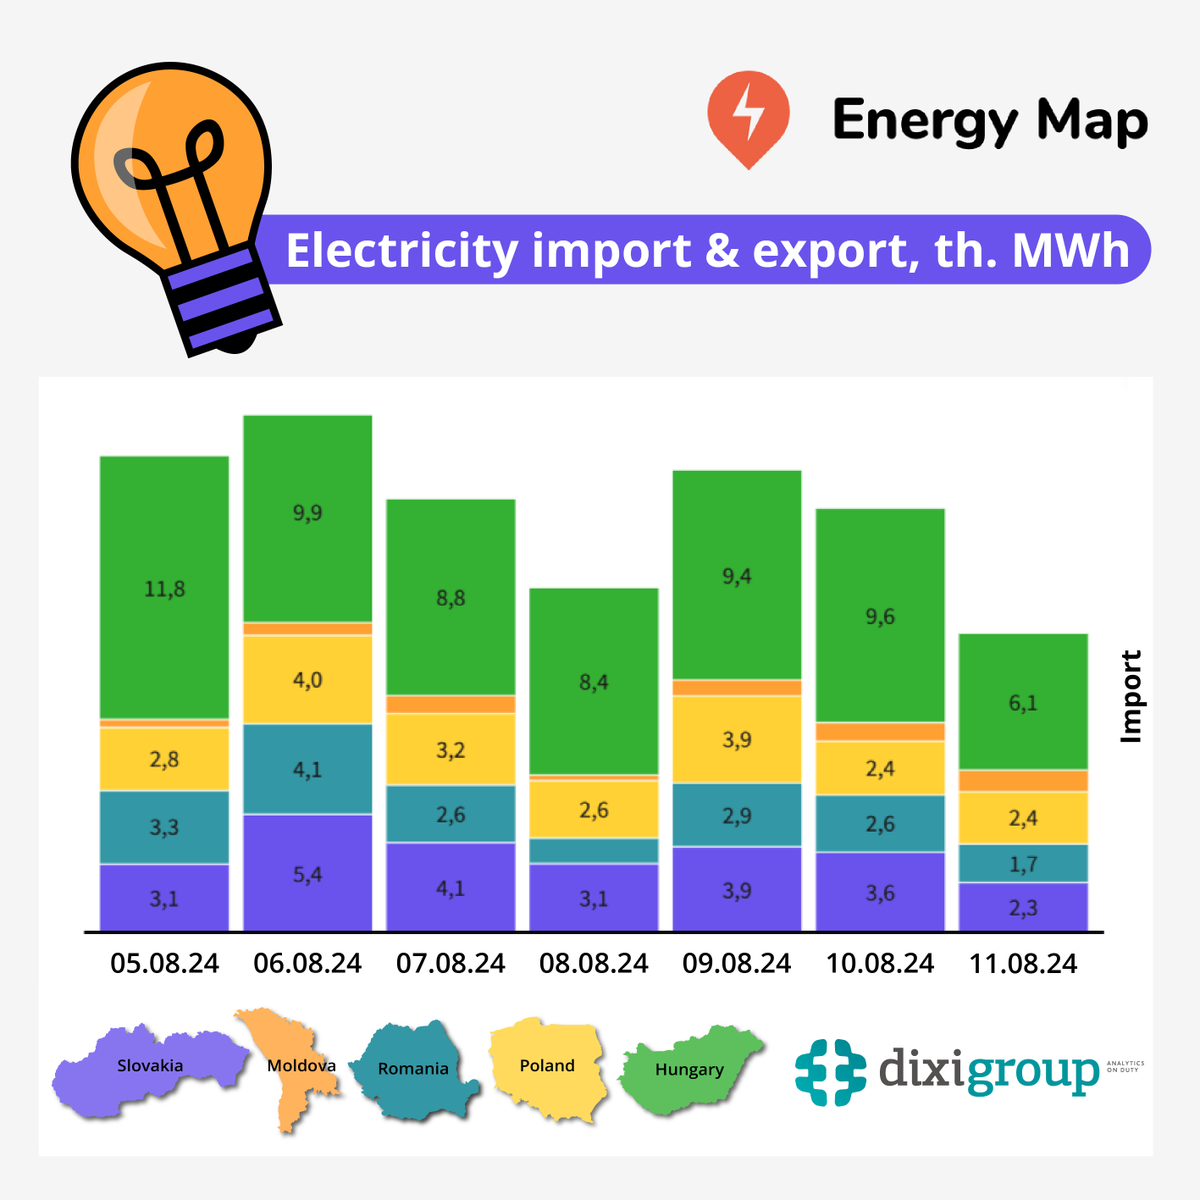
12 Aug 2024
According to #EnergyMap, during August 5-11, #Ukraine's weekly #electricity imports decreased again, this time by 8%. For 5 weeks in a row, imports have decreased by 8-16%. Ukraine hasn't exported electricity for exactly 3 months. The last time exports was carried out on May 12.
1
2
191
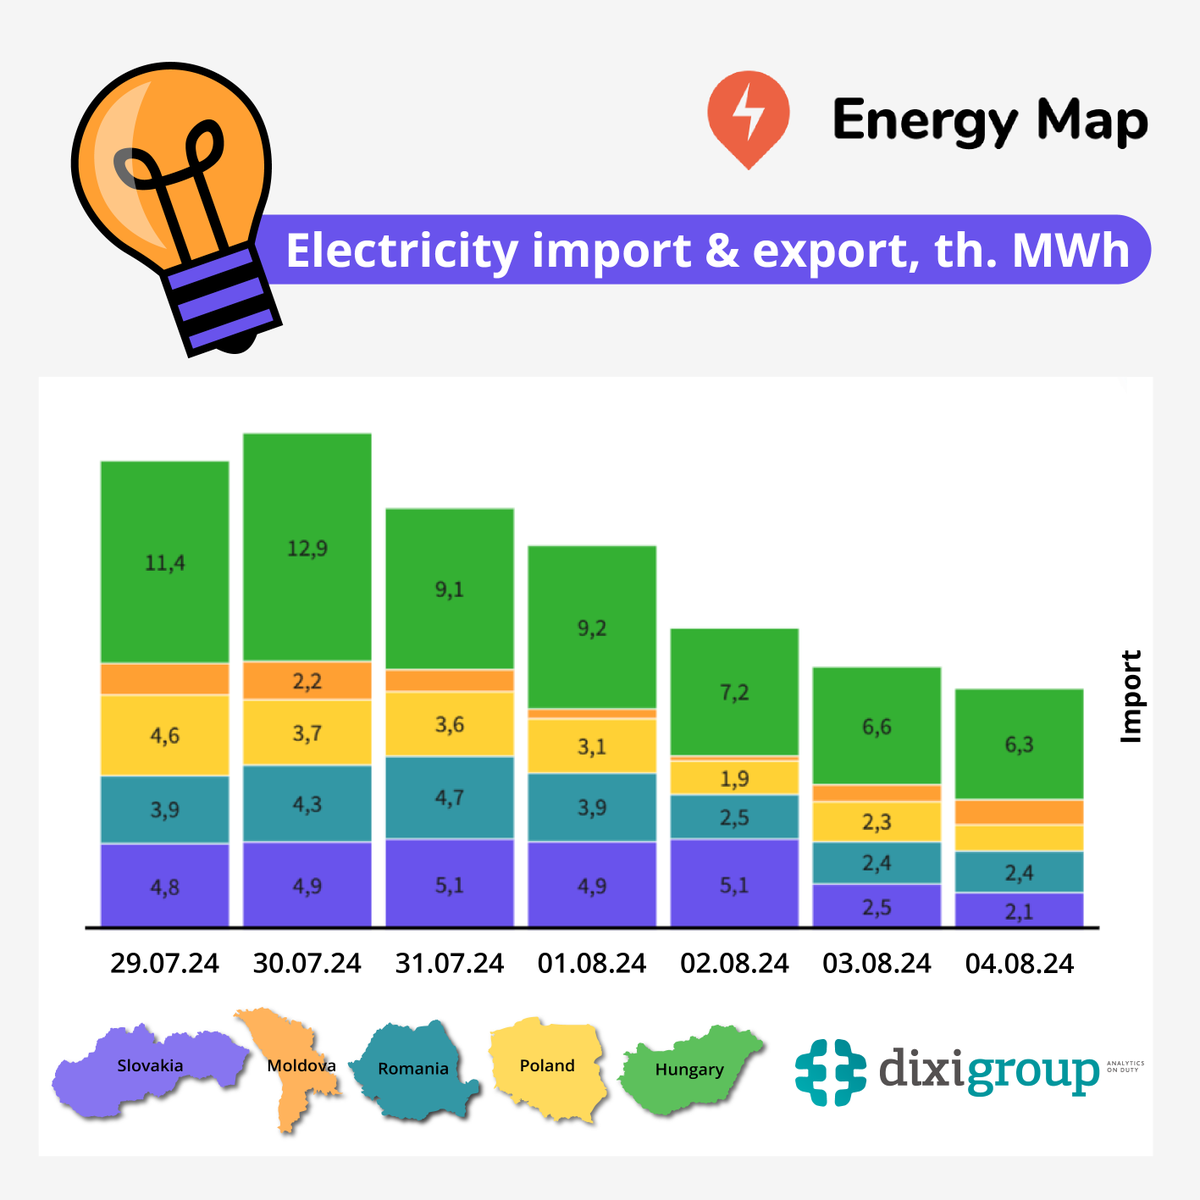
6 Aug 2024
According to #EnergyMap, during July 29 – August 4, #Ukraine's weekly #electricity imports decreased for the fourth week in a row, this time by 7–10%. There's a lack of data on supplies from #Moldova & #Slovakia for July 27 to provide an accurate comparison with the previous week
3
1
2
167