
5/ A imagem mostra a tese inteira: o caixa livre (FCFF) sai de ~R$ 0,4 bi em 2026 e sobe pra ~R$ 7 bi em 2035, enquanto o EBITDA cresce mais devagar.
Por quê? Quando a Ferrovia do MT ficar pronta (1ª fase no 3T26) e o capex normalizar, o mesmo EBITDA passa a virar CAIXA de verdade. A ação é uma aposta em dois gatilhos: o capex arrefecer E a Selic cair.
1
1
66
3/ Agora a lição mais importante de valuation que existe. Olha a diferença em 2026:
• EBITDA: ~R$ 8,3 bi
• Capex (investimento): ~R$ 6,8 bi
• Caixa livre que sobra (FCFF): ~R$ 0,4 bi
O EBITDA é gordo, mas a Rumo está construindo a Ferrovia do Mato Grosso e o capex devora quase todo o EBITDA. Sobra quase nada de caixa livre HOJE. EBITDA ≠ dinheiro no bolso do acionista.
1
64

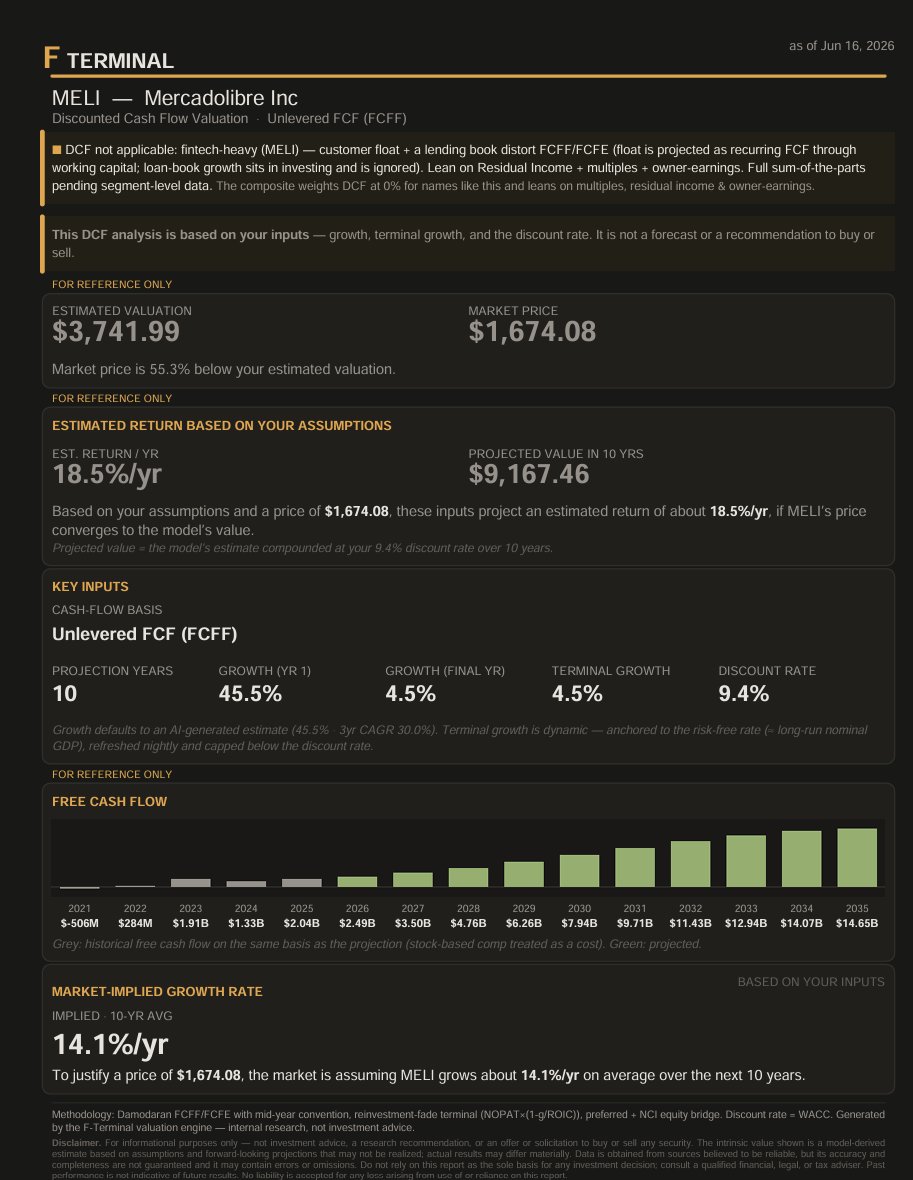
I see a lot of people on X posting DCFs of $MELI #FTerminal flags this properly. The valuation doesn't work using a DCF.
⚠ DCF not applicable: fintech-heavy (MELI) — customer float a lending book distort FCFF/FCFE (float is projected as recurring FCF through working capital; loan-book growth sits in investing and is ignored). Lean on Residual Income multiples. Full sum-of-the-parts.
35
Not Keith McCullough retweeted
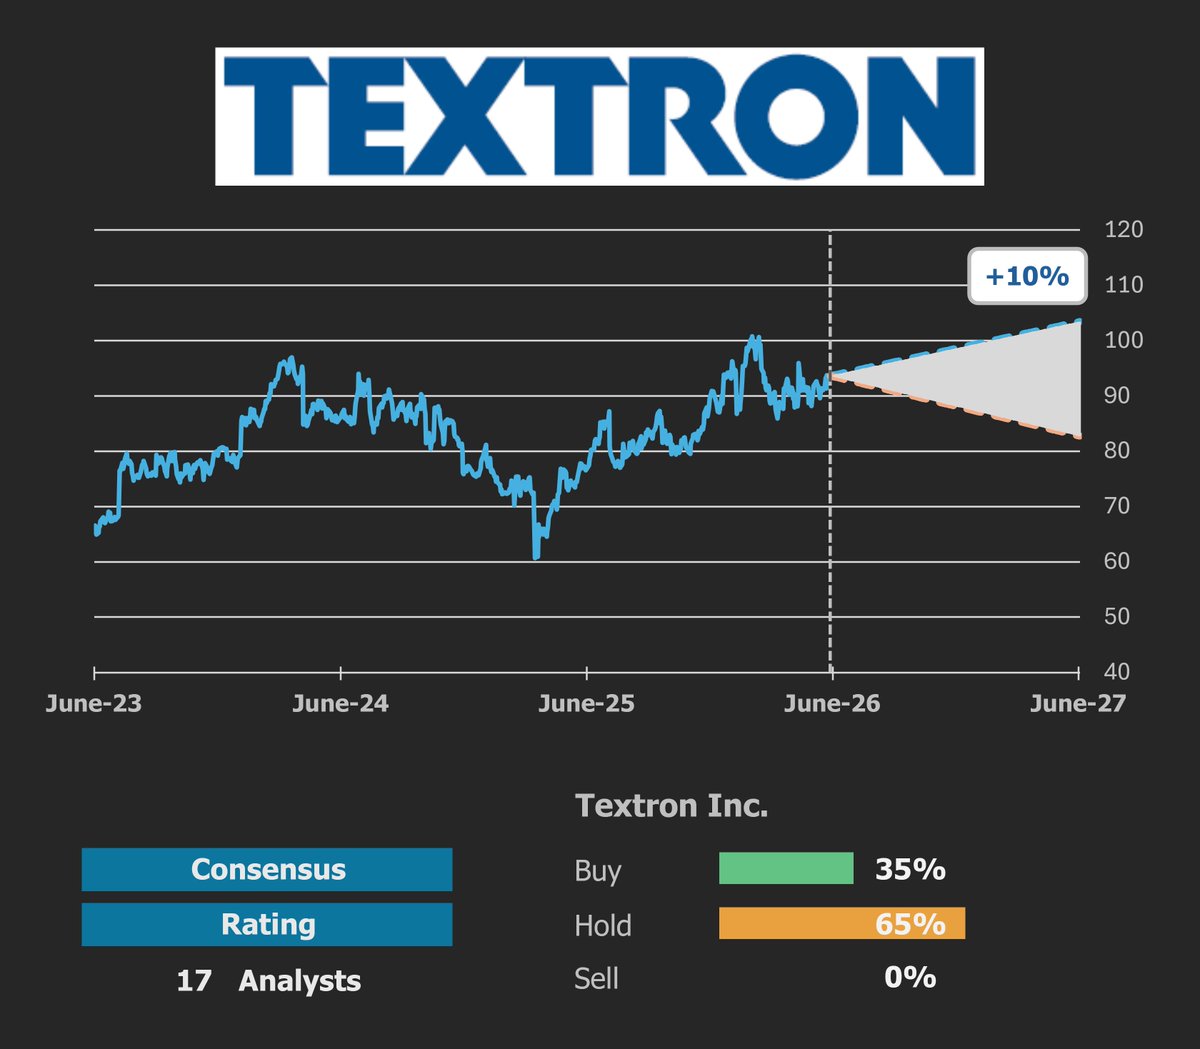
$TXT
10Y ROIC, Average 6% 🚫
10Y Revenue, CAGR 1% 🚫
FCFF 3Y Average, mln $961
3Y FCFF/TEV yield 6%
None Moat 🚫
Market Price $94
Fair value $96
Shares FAIRLY VALUED
Discount (-)/Premium ( ) -2% ⏸
1
1
1
251
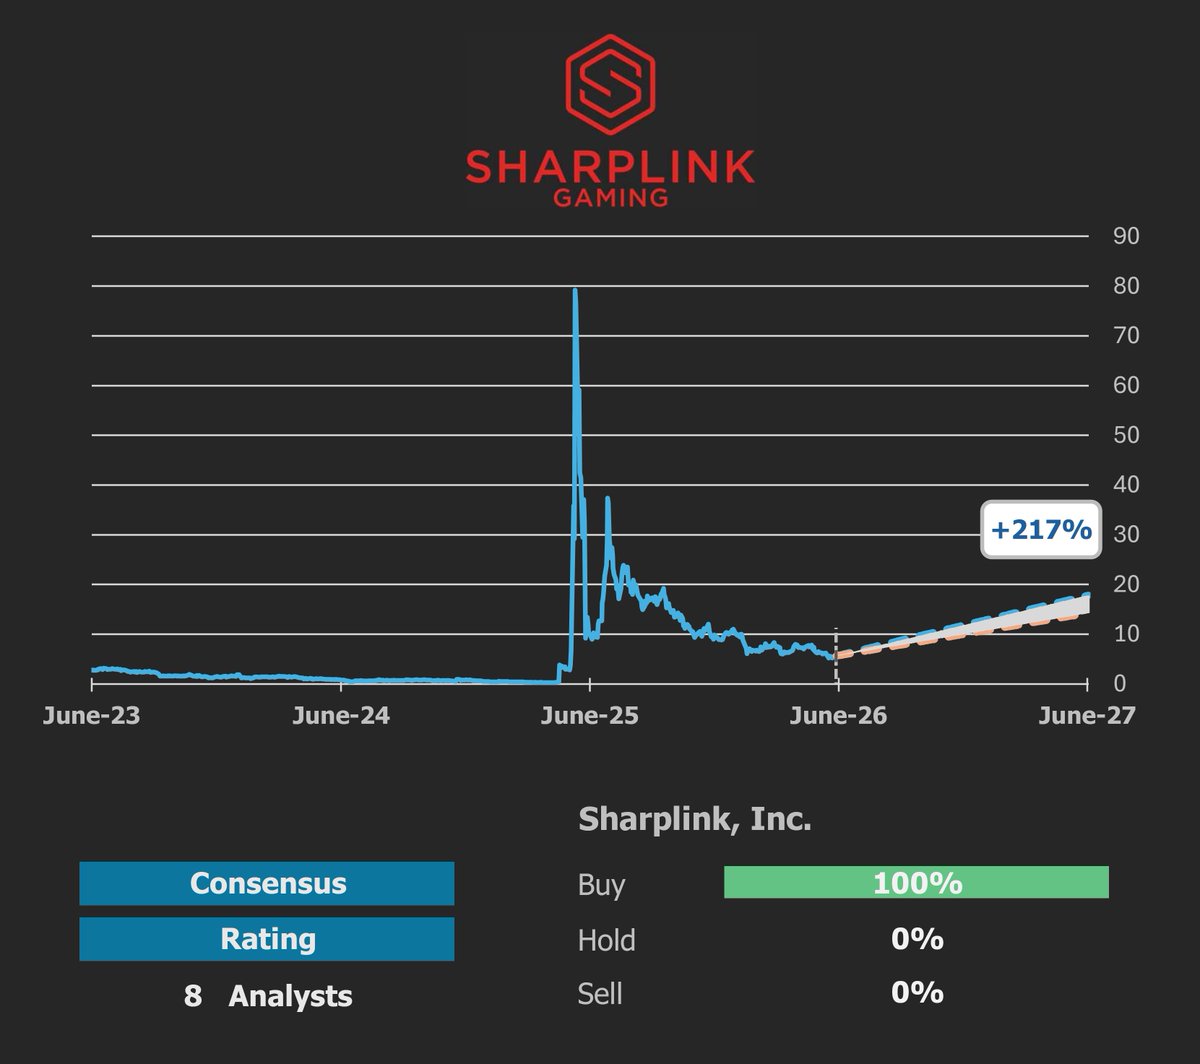
$SBET
10Y ROIC, Average -55% 🚫
10Y Revenue, CAGR 7% ✔️
FCFF 3Y Average, mln -$32
3Y FCFF/TEV yield -4%
None Moat 🚫
Market Price $6
Fair value $16
Shares UNDERVALUED
Discount (-)/Premium ( ) -66% ✔️
1
1
196


⚡ How insic works — a full walkthrough
insic runs a multi-model DCF valuation on any NYSE or NASDAQ stock. Here's exactly what happens when you type a ticker:
━━━ THE 5-MODEL BLEND ━━━
1. FCFF DCF (Unlevered)
Free cash flow to the firm, discounted at WACC. The Damodaran standard. WACC is calculated from CAPM country risk premium.
2. FCFE DCF (Levered)
Free cash flow to equity, discounted at the cost of equity. Strips out the debt layer.
3. DDM (Dividend Discount Model)
For dividend-paying companies. Prices the dividend stream.
4. Forward P/E multiple
Relative valuation anchored to analyst consensus EPS.
5. EV/EBITDA multiple
Enterprise value relative to operating earnings.
━━━ THE OUTPUT ━━━
Each model is weighted by company type (growth, financial, dividend, etc.) and blended into a single consensus fair value.
You also see: bear/base/bull scenarios, ROIC vs WACC, Piotroski score, Altman Z-score, Beneish M-score, analyst estimates, EPS surprises, financial statements.
━━━ WHAT MAKES IT DIFFERENT ━━━
Every assumption is shown. You can override WACC, CAGR, and terminal growth and see the fair value update in real time.
No black box. No opinion. Just a transparent model you can stress-test.
Free for any stock → insic.app
#DCF #Investing #StockAnalysis #FinancialModeling
35

15 Key finance terms
Every investor and analyst should know these
Inside the PDF:
• NPV, IRR, and WACC explained simply
• FCFF vs FCFE and why both matter
• ROIC, EVA, and leverage ratios made easy

1
6
25
1,162

Jun 16
SJS ENTERPRISES — MY Q1 FY27 CHECKLIST
FY26 was clean. Net cash, 26th straight quarter of beating the auto industry, EBITDA margin pushed to ~30%. But the stock has doubled in a year and sits at ~37x. So Q1 isn't about hoping — it's about checking the engine still runs and the books stay honest.
Exactly what I'm ticking off when results drop (early Aug):
🧭 GOVERNANCE FIRST (non-negotiable)
☐ Promoter holding (~21%) — and the WHY behind any move. Open-market is fine. Pledge / RPT / inter-se transfer is not. (My EFC scar talking.)
☐ Veni Thapar — "independent" director, same surname as Group CEO Sanjay Thapar, runs V K Thapar & Co. Check the RPT note for fees any family link.
☐ Everstone fully exited Aug'23. Confirm no fresh block exit or new overhang.
☐ WPI minority (Walter Pack Spain, 9.9%) — royalty / tech-fee RPTs, quantify vs PAT.
☐ Auditor remarks Nil. Independent board ratio still 50% (Kalsi added 5 May).
📈 GROWTH
☐ Revenue YoY vs industry. Guide: beat 2W PV by 1.5–2x. Order book already >85% of FY27 revenue. (Base: FY26 25.6%.)
☐ Segment split — PV holding up, Consumer recovering. (FY26: 2W 38 / PV 42 / Cons 16.)
☐ New-gen products % — target 25–30% over 5yrs. (Base 24%.)
☐ Exports % — target 14–15% by FY28. (Base 9.5%; FY26 exports 60%.)
💰 MARGINS & RETURNS
☐ EBITDA margin. The nuance most people miss: management itself guides 27–28% as sustainable. So a drift down from 29.6% is normalisation, NOT a red flag. Only sub-26% worries me.
☐ ROCE 35.5% vs ROE 19.5%. That gap is idle cash parked in equity. It only closes if they deploy it or return it. I watch the gap, not the headline number.
☐ Polymer/crude pass-through — ~1 quarter lag, aesthetic parts reprice yearly. Confirm no leakage.
🔧 THE PROMISES THEY MADE
☐ WPI / consumer recovery "in 1–2 quarters" — Q1 is the first real test of that promise.
☐ SDPL chrome greenfield (₹100cr) — commissioned and ramping? (was 95% util.)
☐ SJS Bangalore 20% line (₹45cr) — online? (was ~75% util.)
🏗️ CAPEX & CASH
☐ Capex vs the ~₹260–270cr 3yr plan (₹80cr done in FY26 — rest is payment timing, not a delay).
☐ Net cash ₹2,437mn, FCFF ₹1,427mn, debt ~nil. CFO/EBITDA was 78%.
☐ Any bite-size accretive M&A? ~₹243cr dry powder, targets "in discussions."
🖥️ DISPLAY / BOE VARITRONIX (the FY28 bet)
☐ Hosur — equipment in (guided Q2), trials started?
☐ Supplies start early FY28. Any slippage on that date is the real risk here.
☐ Customer wins / joint BOE programs. ~₹65cr capex. Kit value heading to 5–8x.
🏷️ VALUATION
☐ PE vs ~37x and vs peers (~34x avg). Forward ~30x on 25% growth.
☐ Is my return earnings-led or just multiple stretch? Earnings-led is what lasts.
☐ Price vs 52wk high (~2,034) and my own pre-set add/trim bands.
🚨 WHAT BREAKS THE THESIS
- Margin under 26% for 2 quarters with no one-off reason
- Promoter stake drops via an opaque route
- WPI/consumer still limp by Q2
- Display SOP pushed well past early FY28
- Cash keeps piling while ROCE/ROE fall
- Order-book cover slips far below 85%
- Any auditor qualification or RPT leakage
My read: business is in the right lane and every ratio moved the right way. But the easy re-rating is behind us. From here it's a compounder — PE expansion needs the display story to actually land, not just get talked up.
Not investment advice. My own checklist for my own holding. Verify every number against the filing. DYOR.
The Antifragile Notebook
@ARNABKANTIDHAR1
#SJS #SJSEnterprises #StockMarketIndia #Investing #AutoAncillary #FundamentalAnalysis #Nifty
1
1
160

Jun 15
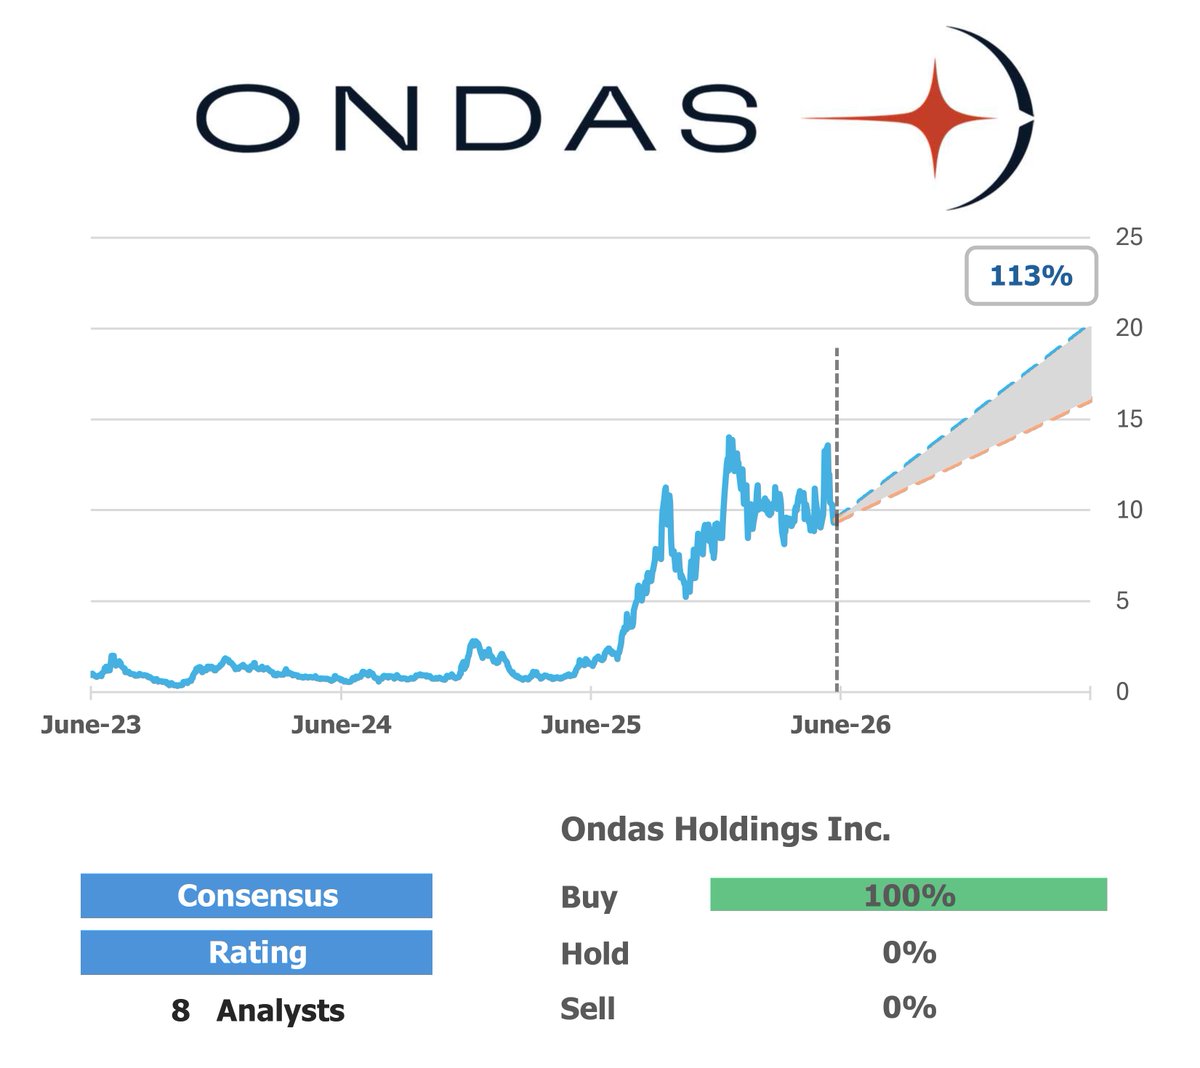
$ONDS
10Y ROIC, Average -271% 🚫
10Y Revenue, CAGR 158% ✔️
FCFF 3Y Average, mln -$32
3Y FCFF/TEV yield -1%
None Moat 🚫
Market Price $9
Fair value $19
Shares UNDERVALUED
Discount (-)/Premium ( ) -49% ✔️
349
Jun 15
$AIOT
10Y ROIC, Average -8% 🚫
10Y Revenue, CAGR 24% ✔️
FCFF 3Y Average, mln -$6
3Y FCFF/TEV yield -1%
Narrow Moat ✔️
Market Price $4
Fair value $10
Shares UNDERVALUED
Discount (-)/Premium ( ) -57% ✔️

178
Jun 15
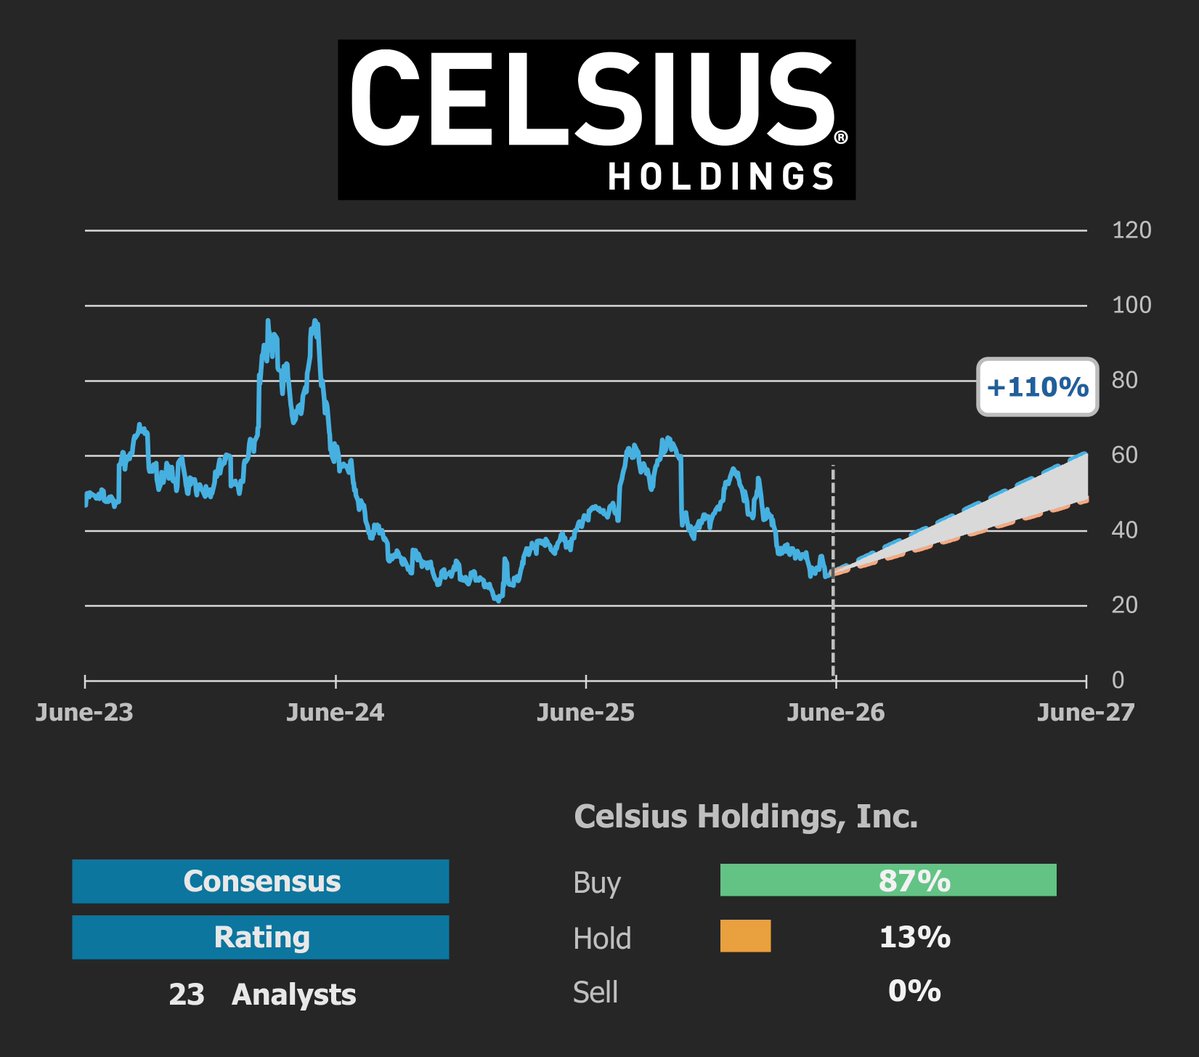
$CELH
10Y ROIC, Average -10% 🚫
10Y Revenue, CAGR 65% ✔️
FCFF 3Y Average, mln $245
3Y FCFF/TEV yield 2%
None Moat 🚫
Market Price $29
Fair value $56
Shares UNDERVALUED
Discount (-)/Premium ( ) -49% ✔️
4
388

Jun 15
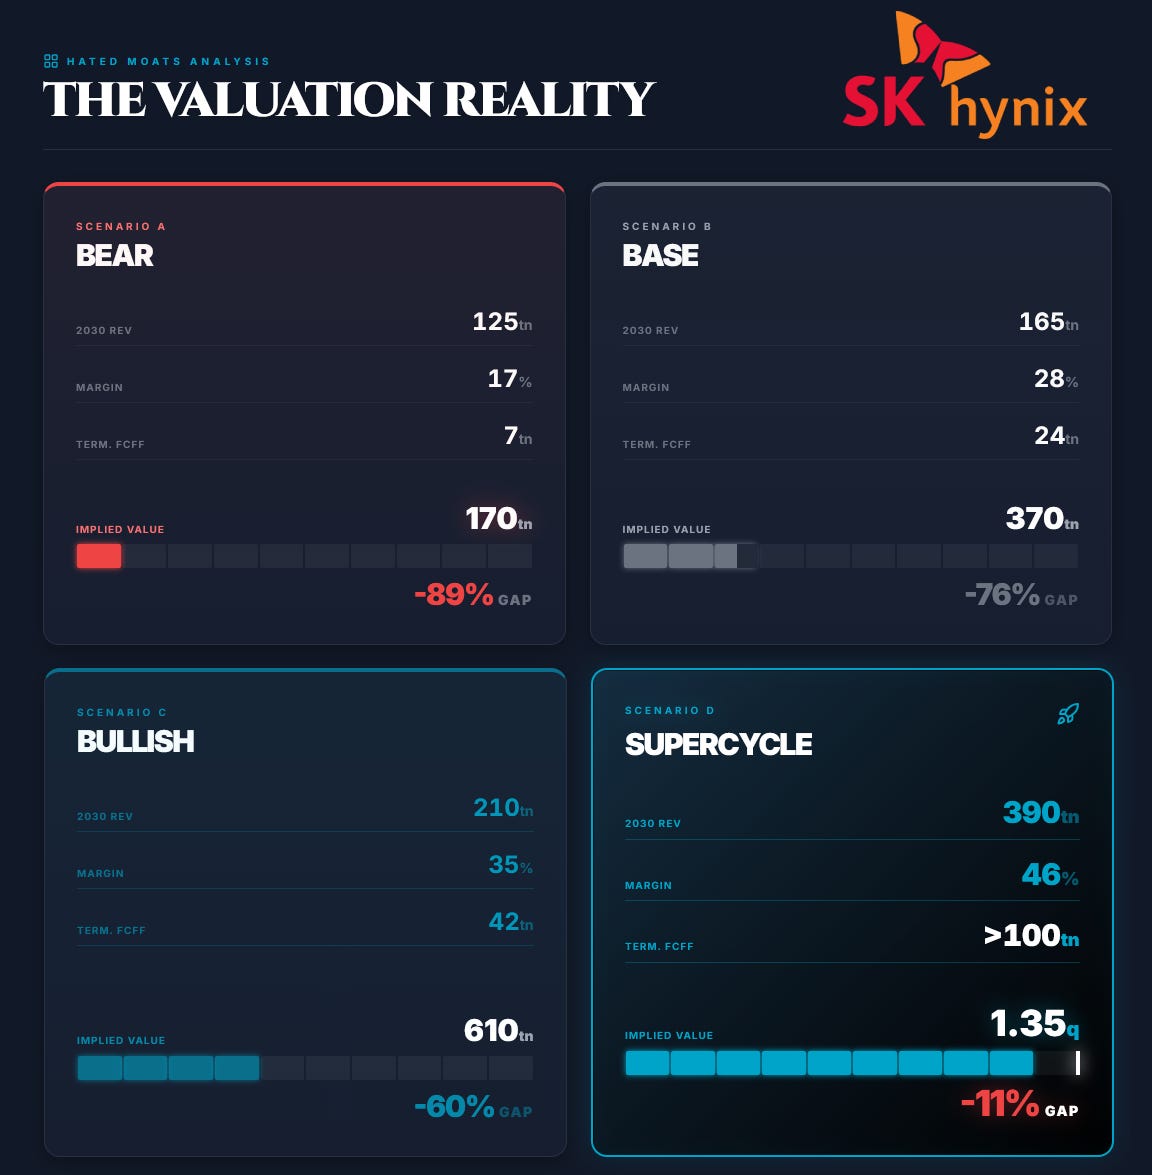
8/10 Scenario Map
The scenario map is the most important part here:
SCENARIO A
In the classic memory-cycle case, HBM remains real but doesn’t permanently rewrite economics.
Implied equity value: roughly KRW 170T, around 89% below the working market cap.
SCENARIO B
In the improved-cycle case, HBM lifts the business but doesn’t erase cyclicality.
Revenue reaches roughly KRW 165T by 2030, operating margin settles near 28%, and terminal normalised FCFF reaches around KRW 24T.
Still only roughly KRW 370T of implied equity value.
SCENARIO C
In the structurally better but still cyclical case, revenue reaches roughly KRW 210T, operating margin reaches 35%, and terminal FCFF reaches around KRW 42T. Even that gives only roughly KRW 610T of equity value.
SCENARIO D
The only case close to today is the AI memory supercycle.
1
1
133

Jun 14
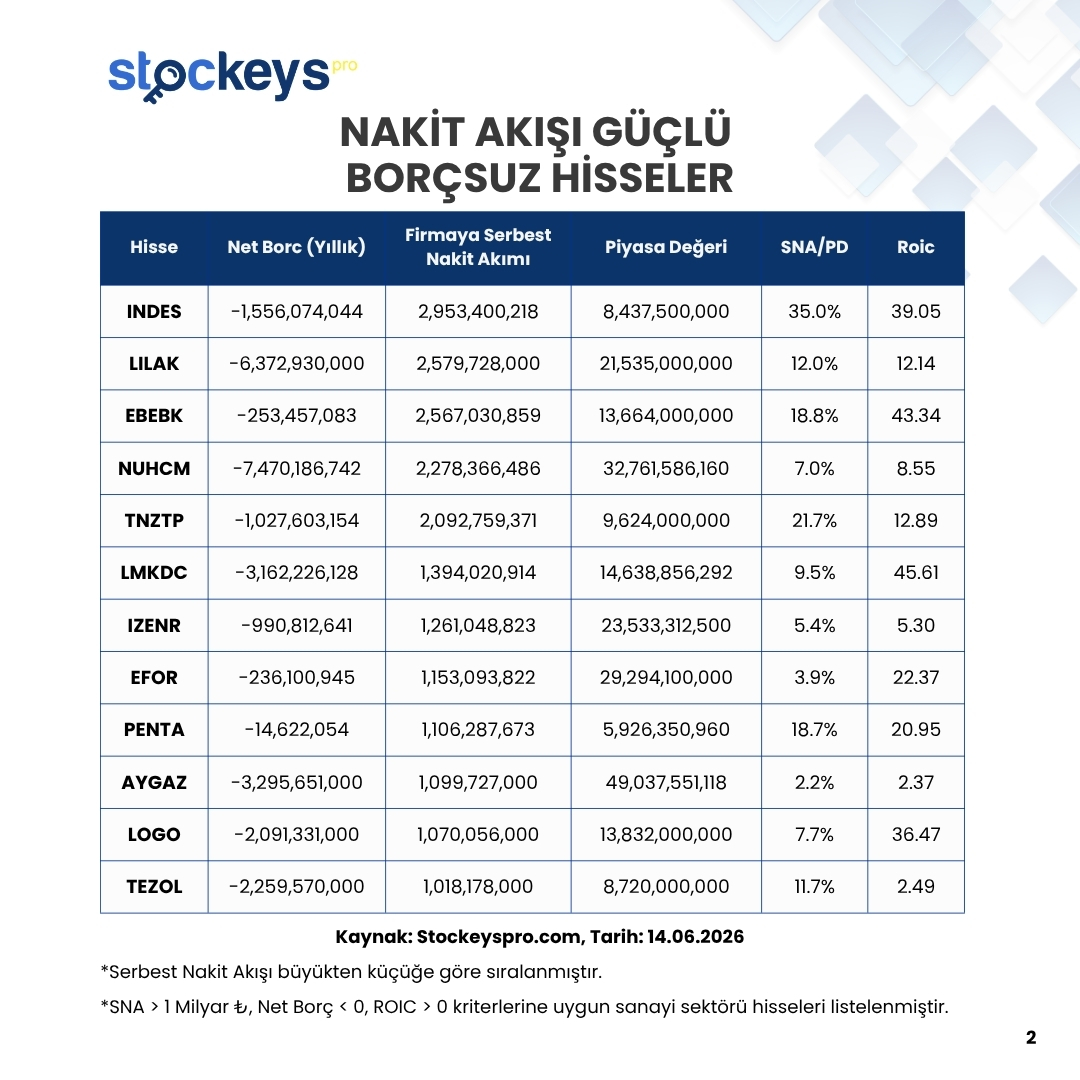
NAKİT AKIŞI GÜÇLÜ BORÇSUZ HİSSELER
Bu analizle şunlara bakıyoruz:
Net Borç: Şirketin gerçek borç yükü ne kadar?
Serbest Nakit Akımı (FCFF): Operasyondan yaratılan ve dağıtılabilir nakit gücü.
Piyasa Değeri: Şirket piyasada nasıl fiyatlanıyor?
SNA / PD: Piyasa değerine göre nakit üretimi ucuz mu?
ROIC: Yatırdığı sermayeden ne kadar verim alıyor?
1️⃣ Net Borç (Yıllık)
Şirketin toplam borcundan nakit ve benzerlerini çıkardığımızda karşımıza çıkan gerçek borç yükünü gösterir.
➡️ Düşük veya negatife yakın net borç, finansal riskin düşük olduğuna işaret eder.
2️⃣ Serbest Nakit Akışı (SNA)
Şirketin faaliyetlerini sürdürdükten ve gerekli yatırımları yaptıktan sonra geriye gerçekten cebinde kalan nakit miktarıdır.
➡️ Pozitif ve istikrarlı SNA, şirketin sürdürülebilir nakit üretme gücünü ortaya koyar.
3️⃣ Piyasa Değeri
Şirketin borsadaki toplam değerini gösterir.
➡️ Fiyatlama tarafında piyasanın şirketi nasıl değerlendirdiğini anlamamızı sağlar.
4️⃣ SNA / PD (Serbest Nakit Akımı / Piyasa Değeri)
Şirketin ürettiği nakdin, mevcut piyasa değerine göre ne kadar ucuz ya da pahalı olduğunu gösteren önemli bir çarpan.
➡️ SNA/PD ne kadar yüksekse, şirket o kadar “ucuz nakit üretiyor” demektir.
Bu oran, “şirketin ürettiği nakde göre ucuz olup olmadığını” en iyi anlatan göstergelerden biridir.
5️⃣ ROIC (Return on Invested Capital)
Şirketin yatırdığı sermayeden ne kadar verim aldığını gösterir.
➡️ Yüksek ROIC, güçlü yönetim, verimli yatırımlar ve sağlam rekabet avantajı anlamına gelir.
📉Stockeys Pro ile Finansal Verileri Kolayca Analiz Edin!
stockeys.com/FinansalAnaliz/…
📉Stockeys Pro’ya Abone Olmak İçin 👇🏻
finnet.com.tr/FinnetStore/Tr…
#hisse #değişim #borsa #analiz #nakitakış #TUPRS #ISDMR #ENKAI #AHGAZ #DOCO #TRMET #TRENJ #TRALT #OYAKC #GUBRF #MAVI #BASGZ #ENERY #INDES #LILAK #EBEBK #NUHCM #TNZTP #LMKDC #IZENR #EFOR #PENTA #AYGAZ #LOGO #TEZOL

5
41
2,409
Jun 14
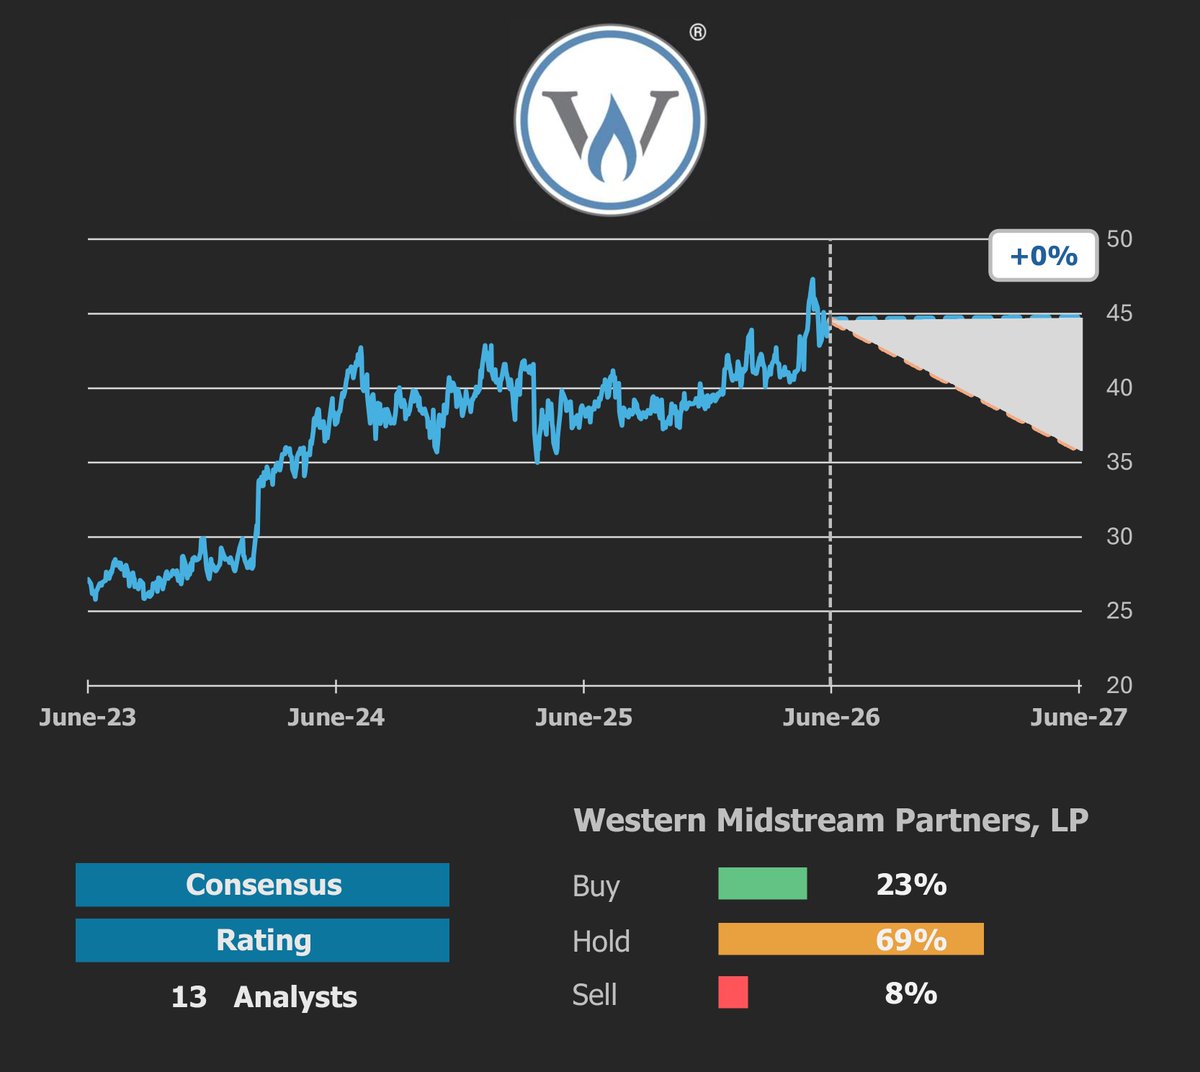
$WES
10Y ROIC, Average 11% ✔️
10Y Revenue, CAGR 9% ✔️
FCFF 3Y Average, mln $1,586
3Y FCFF/TEV yield 6%
Narrow Moat ✔️
Market Price $45
Fair value $41
Shares OVERVALUED
Discount (-)/Premium ( ) 8% 🚫
126
Jun 14
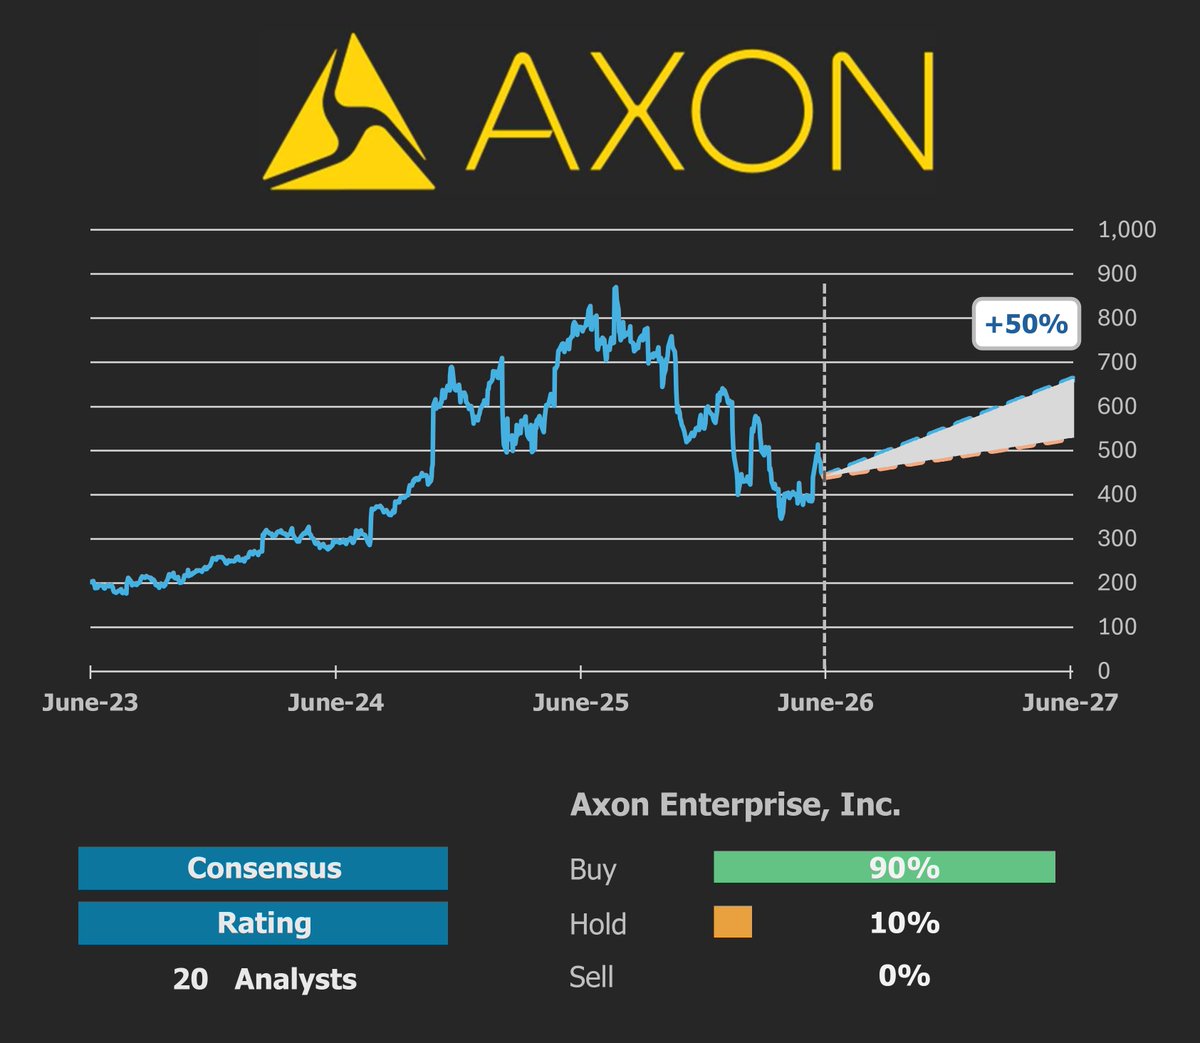
$AXON
10Y ROIC, Average 2% 🚫
10Y Revenue, CAGR 30% ✔️
FCFF 3Y Average, mln $214
3Y FCFF/TEV yield 0%
Narrow Moat ✔️
Market Price $442
Fair value $613
Shares UNDERVALUED
Discount (-)/Premium ( ) -28% ✔️
306
Jun 13
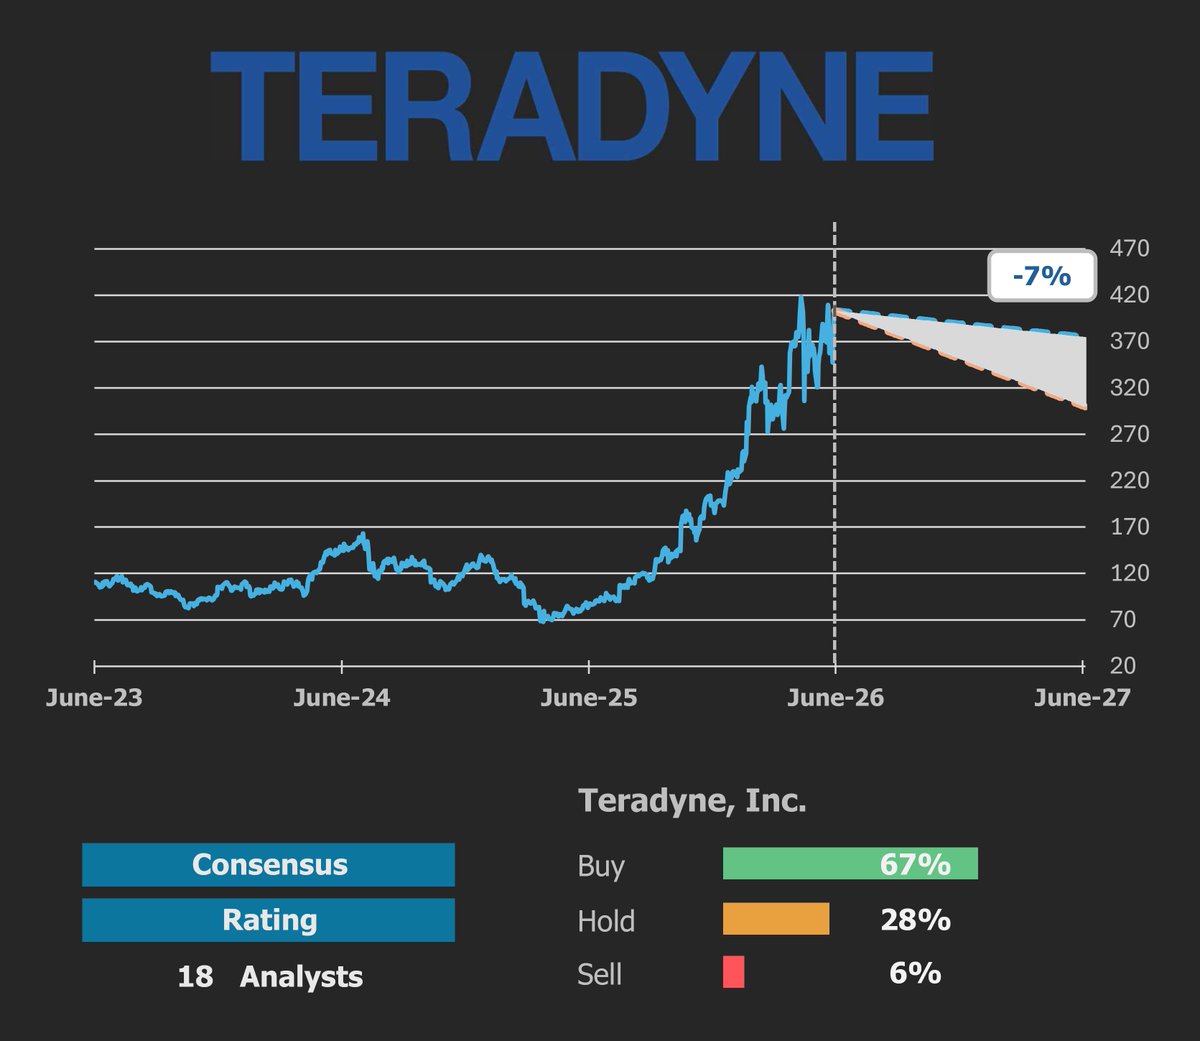
$TER
10Y ROIC, Average 19% ✔️
10Y Revenue, CAGR 7% ✔️
FCFF 3Y Average, mln $455
FCFF/TEV 3Y yield 2%
Wide Moat ✔️
Market Price $403
Fair value $347
Shares OVERVALUED
Discount (-)/Premium ( ) 16% 🚫
269
Jun 13
$SGI
10Y ROIC, Average 102% ✔️
10Y Revenue, CAGR 26% ✔️
FCFF 3Y Average, mln $707
FCFF/TEV 3Y yield 3%
Narrow Moat ✔️
Market Price $72
Fair value $90
Shares UNDERVALUED
Discount (-)/Premium ( ) -20% ✔️

125

Jun 12
📊 O Mapa de Atenção da Mídia: Ruído Macro vs. Alocação Institucional
A leitura do radar de hoje escancara a divergência clássica de comportamento entre o fluxo pautado por notícias e as estratégias de gestão ativa. Analisando o Top 10 de menções, a dinâmica de asset allocation no mercado brasileiro fica evidente em três frentes:
1. Precificação de Prêmio de Risco e Volatilidade
(IPCA, Banco Central, Dólar, Lula, Congresso, Trump)
O foco midiático está massivamente concentrado na incerteza fiscal e monetária (doméstica e externa). Essa sobrecarga de variáveis macroeconômicas eleva a volatilidade implícita e mantém a ponta longa da curva de juros estressada. O mercado ajusta o prêmio de risco exigido em tempo real, reagindo à desancoragem de expectativas.
2. Finanças Comportamentais no Varejo
($SPCX34)
O pico de atenção na listagem do BDR reflete um viés de disponibilidade clássico. O investidor não institucional tende a buscar exposição a teses de alto beta (growth) impulsionadas por manchetes, aceitando embutir spreads maiores e assumir o carrego cambial em um momento onde o próprio Dólar é uma das maiores pressões do dia.
3. Rotação para Valor (Flight to Quality)
($CSMG3, $VALE3, $CXSE3)
Enquanto a superfície do mercado reage aos dados de IPCA, o fluxo institucional opera o hedge estrutural. A liquidez se reposiciona cirurgicamente em teses de Value e setores defensivos: Utilities com receita corrigida pela inflação (saneamento/ $CSMG3), Hard Assets geradores de caixa forte (VALE3) e modelos de negócios blindados contra o ciclo de crédito (seguros/ $CXSE3). É a busca institucional por previsibilidade de fluxo de caixa (FCFF) em cenários adversos.
A inteligência de mercado exige separar o ruído diário das tendências de alocação de longo prazo. Acompanhe a assimetria de informação e o mapeamento do fluxo em tempo real:
⎯⎯⎯⎯⎯⎯⎯⎯⎯⎯⎯⎯⎯⎯⎯
powered by radar onwav
🔗 radar.onwav.com.br/midia?utm…
97