
Mar 3
BUSINESS
Cracks in FDI architecture
Writer: KS Chalapati Rao | KVK Ranganathan
Click- dailypioneer.com/news/cracks…
#FDIinIndia #ForeignDirectInvestment #FDIOutflows #MNCInvestments #GlobalCapital #EconomicSurvey2025 #DomesticSavings #ManufacturingGrowth #CapitalFlows #FinancialInvestors #PrivateEquity #HedgeFunds #MultinationalCorporations #Royalties #Dividends #TechnologyTransfers #IPO #OFSSales #FDITrends #EconomicPolicy #TradeBalance #ExternalAccount #InvestmentStrategy #IndiaEconomy #FinancialResilience #DomesticResourceMobilisation #FDITrap #SustainableGrowth #EconomicLiberalisation #FDIStatistics
3
49
Mar 2
BUSINESS
India’s FDI palace of illusion
Writer: KS Chalapati Rao | KVK Ranganathan
Click- dailypioneer.com/news/india-…
#FDIinIndia #ForeignInvestment #EconomicPolicy #RBI #FDIOutflows #NetFDI #IndiaEconomy #Liberalisation #IndustrialPolicy1991 #TechnologyTransfer #EaseOfDoingBusiness #InvestmentTrends #Manufacturing #GlobalCapital #EconomicAnalysis #ReformsAndGrowth #FDIImpact #PolicyReview #EconomicStrategy #FDIInsights #CapitalInflows #FDIvsOutflows #IndianIndustry #EconomicSustainability #ForeignCapital
3
94

Feb 14
India’s currency outlook is currently shaped by both domestic and global macroeconomic forces. According to Fitch Ratings, the rupee, which depreciated nearly 5% over the past year and crossed ₹92 per dollar, briefly appreciated to around ₹90.4 per dollar following clarity on the U.S.–India trade deal. However, despite this temporary strengthening, Fitch now expects the rupee to gradually depreciate to around ₹93 per dollar by the end of 2026. This is still an improvement from its earlier forecast of ₹95.
The projected depreciation is primarily driven by two structural pressures. First, foreign direct investment outflows are increasing as companies repatriate profits, leading to higher dollar demand. Second, India’s shift toward relatively expensive non-Russian crude oil imports is expected to raise the import bill, widening trade pressures and increasing dollar demand further. Since India is a major oil importer, higher crude prices directly weaken the rupee.
On the global front, potential U.S. Federal Reserve rate cuts may soften the U.S. dollar, providing selective support to Asian currencies including the rupee. However, Fitch emphasizes that domestic macroeconomic stability will be decisive. Economies with strong current accounts, credible policy frameworks, and political stability are likely to outperform, while those facing fiscal slippage or trade deterioration may struggle.
The rupee is also indirectly influenced by other major currencies. A weaker dollar against the euro or pound can temporarily support emerging market currencies. Meanwhile, movements in the Chinese yuan affect India’s export competitiveness. Therefore, global currency dynamics also shape the rupee’s trajectory.
A move toward ₹93 per dollar does not indicate a currency crisis. Rather, it reflects structural adjustment pressures. A weaker rupee can boost exports and increase remittance value, but it also raises import costs, fuels inflation, and increases external debt servicing burdens.
Ultimately, the rupee’s direction will depend on capital flows, oil prices, trade balance trends, and domestic economic stability.
Source: The Hindu
#RupeeOutlook #INRvsUSD #FitchRatings #CurrencyDepreciation #TradeDeficit #FDIOutflows #CrudeOilImpact #USRateCuts #AsianCurrencies #IndianEconomy #ForexMarkets #UPSC #UPPSC #SSC

2
8
113

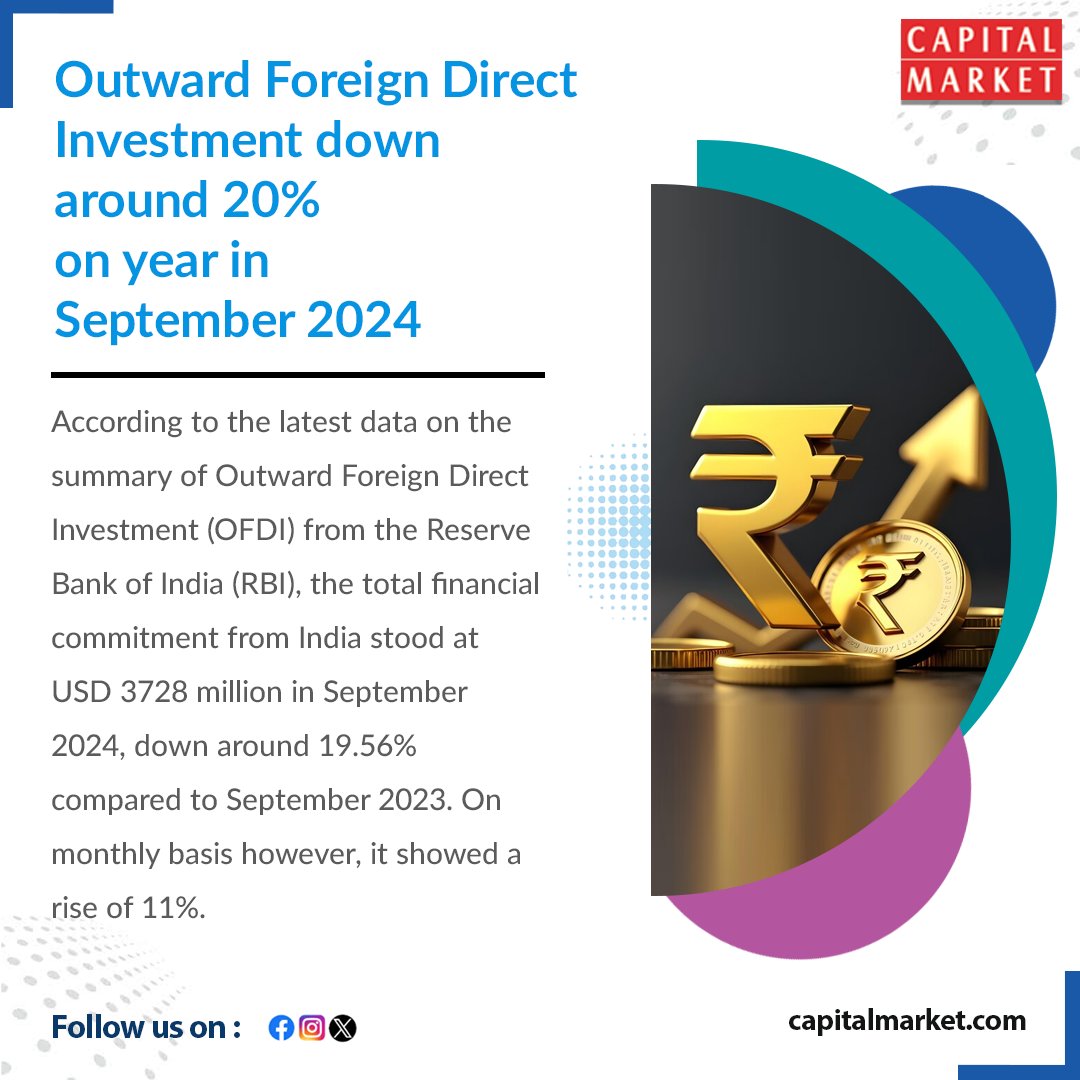
Outward Foreign Direct Investment Declines by 20% YoY in September 2024
Like | Share | Follow | Comment For Daily Updates.
capitalmarket.com
#ForeignDirectInvestment #FDIOutflows
2
72

25 Jun 2024
In a notable shift, India's current account swung into a surplus of $5.7 billion (0.6% of GDP) in the March quarter, marking its first surplus in four years. This turnaround from a deficit of $1.3 billion (0.2% of GDP) in the same quarter last year is attributed to moderation in trade deficit, higher services income, and increased remittances from the non-resident diaspora. For the full fiscal year 2023-24, India recorded a deficit of $23.2 billion (0.7% of GDP), a substantial improvement from $67 billion (2% of GDP) in the previous year.
India is often referred to as a net investment destination for Foreign Direct Investment (FDI). From a modest $3.5 billion in 2000, net FDI inflows peaked at $43.4 billion in 2008, fell after the global financial crisis, and subsequently reached $50 billion in 2022. However, an intriguing aspect often overlooked is the significant outward FDI flows from India – i.e. investments made by Indian individuals and corporations in foreign enterprises.
FDI outflows from India rose dramatically, from just $514 million in 2000 to a peak of $19.3 billion in 2008. This peak was followed by a decline after the economic crisis. In recent years, these outflows have stabilized, averaging around $11-15 billion annually over the past decade. These outflows represent Indian companies and conglomerates investing in foreign entities, showcasing India's growing global economic footprint.
In a parallel observation, India's Gross National Income (GNI) is approximately equal to its Gross Domestic Product (GDP). This suggests that the income earned by Indian entities abroad is roughly equivalent to the income earned by foreign entities within India. It implies that although FDI inflows are substantially higher in value, they largely end up flowing into Indian companies (with realizations being counted under GDP), whereas outflows from India are establishing Indian-owned entities abroad, with their earnings reflecting in India's GNI.
Given this scenario, it would be prudent for the Indian government to incentivize the repatriation of profits from foreign subsidiaries of Indian companies back to the mainland. While double taxation avoidance treaties are in place with most countries, additional incentives could encourage reinvestment of foreign profits into the Indian economy.
Several avenues could be explored to encourage such investments:
--Reinvestment allowances and tax holidays for repatriated profits invested in specific sectors, e.g. those included under the PLI scheme.
--Special infrastructure bonds with attractive yields for companies investing foreign profits.
--Innovation hubs and Special Economic Zones with preferential treatment and tax breaks for repatriated investments.
--Enhanced benefits for investments in green technology, sustainable development, and favorable terms for using repatriated profits in local acquisitions and equity investments.
By implementing these measures, India can create an additional pillar to support its local markets. Alongside Domestic Institutional Investors (DIIs) and regular FDI inflows, repatriated profits from Indian companies' foreign operations can serve as a new channel for economic growth and development.
This approach not only strengthens India's economic position but also enhances its global corporate presence. It's a testament to India's growing stature in the international business arena and a call to action for Indian companies to play a more significant role in the nation's economic progress.
#IndianEconomy #FDIOutflows #EconomicGrowth #InvestInIndia #StockMarket
*Also see x.com/swaminathankp/status/1…
26 Apr 2024

In a testament to India's economic potential, Japanese investments in the country have surged by an impressive 30% in the past year alone, signaling a deepening economic relationship between the two countries. Recent reports show a significant jump in Japanese investments in India, from ~$15 billion at the end of 2022 to ~$20 billion by the end of 2023.
One often overlooked aspect when evaluating the economic stature of a country is the value and revenue generated from its foreign investments. Traditional economic indicators like GDP and GNI do not account for a country's overseas equity holdings and the resultant revenues from these foreign investments. This brings us to the concept of the Net International Investment Position (NIIP), which provides a more comprehensive view of a country's financial assets and liabilities on a global scale.
NIIP measures the difference between a country's external financial assets and liabilities. Japan tops the worldwide NIIP rankings with a staggering net position of $3.6 trillion, followed by Germany ($2.5T), China ($2.10T), and Hong Kong ($1.7T). In contrast, while India does not have considerable outward foreign investments, its substantial foreign exchange reserves help mitigate its NIIP deficit, resulting in an overall position of -$370 billion. Interestingly, NIIP can be used to adjust a country's GDP to include revenue from its foreign investments (and deduct domestic foreign-owned revenue), resulting in a metric indicative of its globally generated value, i.e., Global Economic Output (GEO).
Japan's economic story over the last few years offers a fascinating case study. While its domestic GDP growth has remained stagnant over the past decade, the value generated by its foreign investments has been steadily rising. Japan's NIIP has grown from $2.6 trillion in 2015 to an impressive $3.6 trillion today, while their GDP has remained at ~$4.3 trillion.
Over the years, Japan has strategically invested in key international markets. The United States leads the pack with Japanese investments ranging from $700 to $800 billion, followed by China ($150-200B), and the United Kingdom ($100-150B).
Interestingly, Japan's inward FDI position (investments by other countries into Japan) stands at a mere $225 billion, accounting for just ~5% of its GDP.
To estimate the revenues from these foreign investments, we can consider an average Price-to-Sales (P/S) ratio for each country. The prevailing P/S ratios are ~2.5 in the United States, 2.0 in China, 2.3 in the United Kingdom, and for emerging markets, we can conservatively assume a P/S ratio of 5.
Given these valuations, the annual revenue generated by Japan's foreign investments is estimated to be around $1 trillion.
Using these conservative estimates, incorporating revenues from foreign investments and deducting inward FDI, Japan's Global Economic Output amounts to a staggering $5 trillion – a remarkable $700 billion (16%) increment to its current GDP.
Japan's strategy of investing aggressively in foreign markets, and more recently in growing economies such as India, serves as a blueprint for developed nations grappling with stagnant domestic growth and aging populations. By leveraging the potential of emerging markets, these countries can unlock new growth drivers for economic prosperity.
#NIIP #GlobalEconomicOutput #GEO #Japan #JapanFDI #EmergingMarkets #IndiaRising #InvestInIndia #GlobalEconomy
*Also see twitter.com/swaminathankp/st…
14
131
534
130,810