
17 Aug 2025
Naya dataset = nayi kahani 📊🔥 Data analysis feels like solving a thriller puzzle 🤯✨ #DataScience #FunWithData
1
3
38

9 Dec 2024
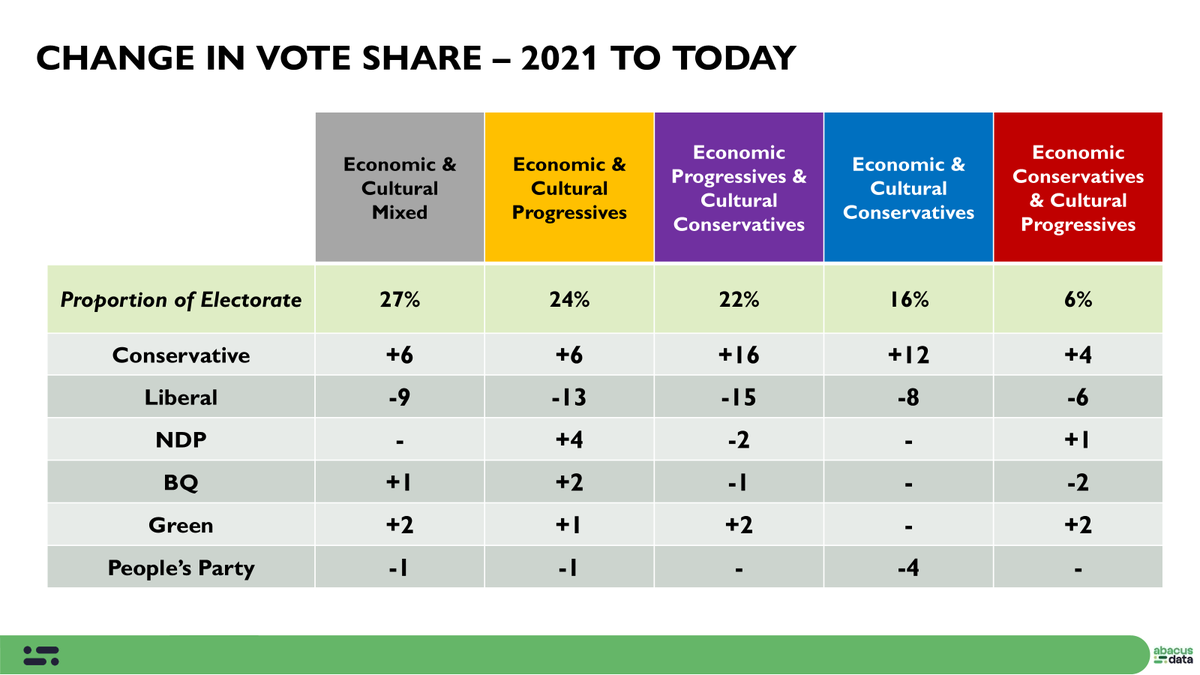
2021 to Today: Biggest shift from LPC to CPC has been among economic progressives/cultural conservatives.
More to come exploring this exciting new dataset I just got. #datalab #chefinhiskitchen #funwithdata #cdnpoli
9 Dec 2024

Working on something new! Really excited about it and what it will tell us about Canadians - where we are and where we are going.

14
22
92
33,809

8 Apr 2024
This morning's #FunWithData inspired by the G-man.
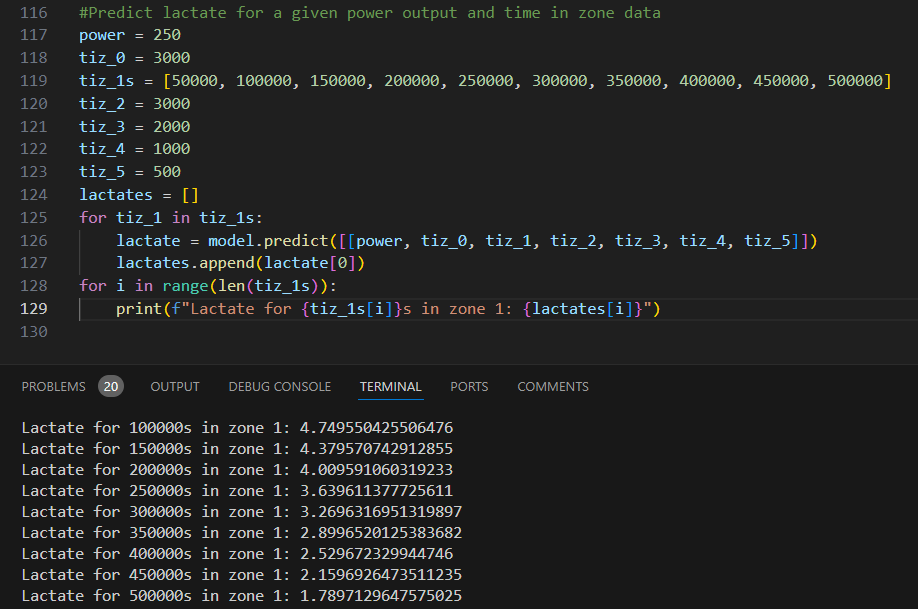
I took all lactate test data and all time in zone data for athletes that I have both for and built a linear model that describes the relationship between 3 month zone 1 volume leading up to the test (in seconds) and lactate level at 250 watts.
*On a group level* for every additional 50,000s of zone 1/3mo, i.e. ~5hrs per month, lactate at 250W will decrease by ~0.4mmol/L.
This value starts to approach AeT at 500,000 seconds of zone 1 (139 hours) in the 3mo leading up to the test.
Interestingly, zone 2 volume did not have the same effect.
7 Apr 2024

You ever look at the dataset and see the impact of LT1/Z1 expansion?
Thinking about 1️⃣ a volume effect, assuming a static LT1 pace/power (your 10% point above) and 2️⃣ an effect from Z1 moving to-the-right
I suspect a rightward move in my running and a need to update my HR & pace zones
11
7
94
45,551

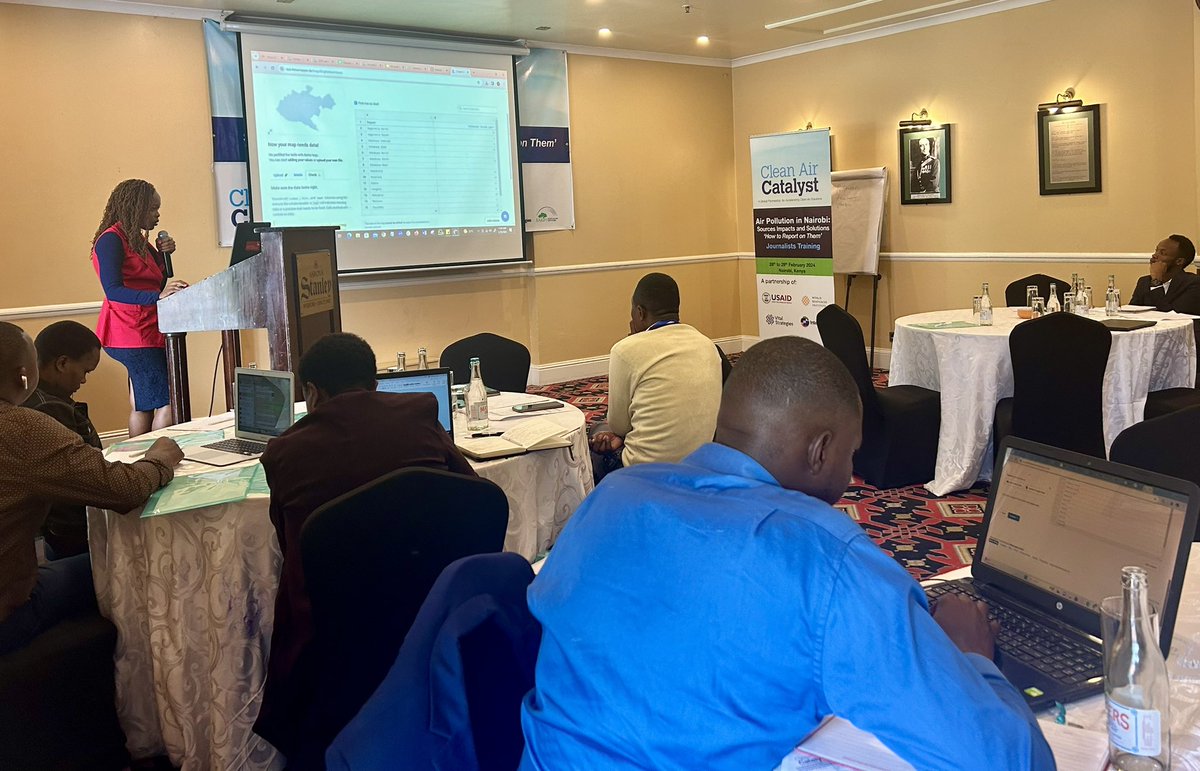
#Nairobi : final day of our media training series on #AirPollution ! Today we are learning from @JudyNguta how to use data in #airquality reporting. Later, we will do #spcialmedia and story idea development. Loving the energy in the room! #training #mediadevelopment #funwithdata #ejnat20 #ejnattwenty @CleanAirCAC @earthjournalism


2
13
432

Data analysis is like solving a puzzle - but instead of a 'pretty picture', you get actionable insights! 🧩 At HiveDT, we're piecing together the data puzzle to reveal the big picture for your business. Who's up for the challenge? #DataPuzzle #FunWithData #Apple

ALT data puzzle apple fun
2
106

5 Dec 2023
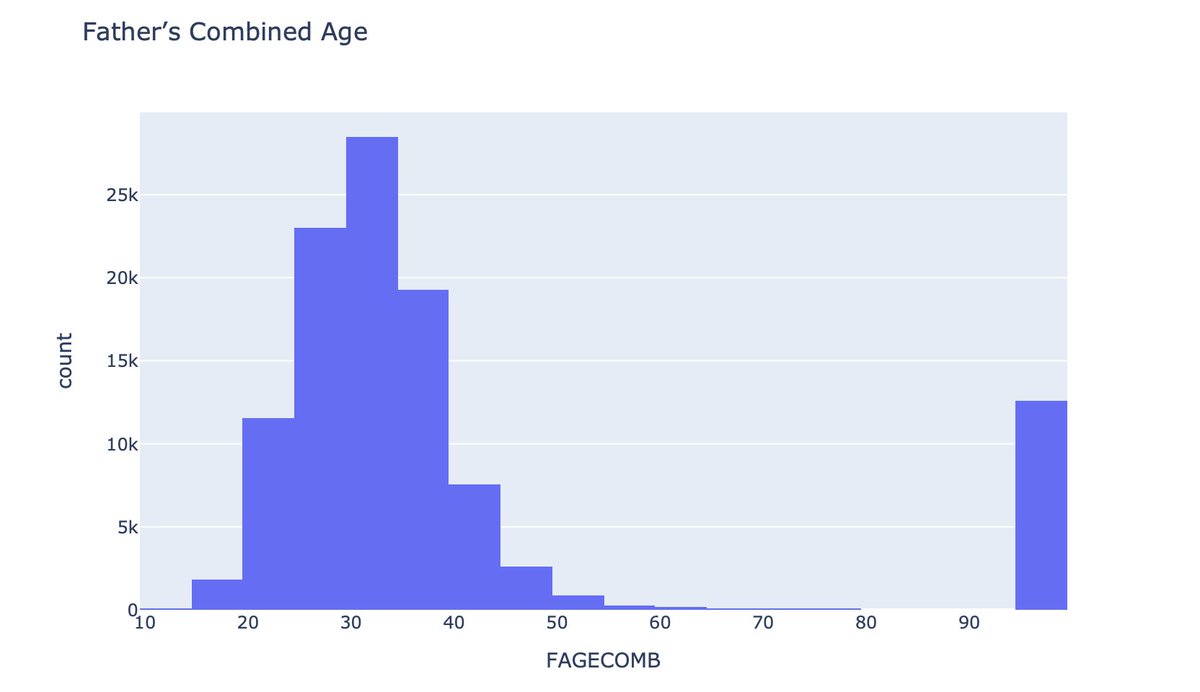
Excited about the new @kaggle prediction interval competition 'Prediction interval competition I: Birth weight'! 🎉
It's all about reliably predicting interval of a baby's weight based on various factors.
Great opportunity to practice and hone your skills in conformal and probabilistic prediction.
A great opportunity for honing data cleaning and preprocessing skills too. 🧑💻
And here's a quirky one - Father's age listed as 99.
Mick Jagger vibes, or is it something else?
What's your take? #DataScience #FunWithData
#uncertainty #conformalprediction
kaggle.com/competitions/pred…
2
1
18
2,353
7 Nov 2023
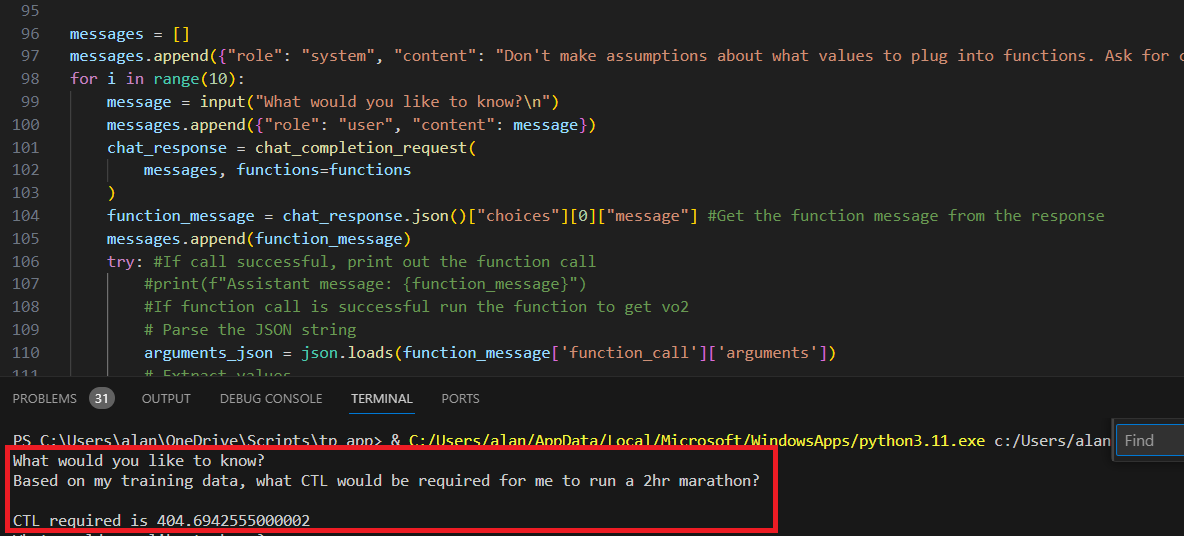
A little #FunWithData today playing around with some of OpenAIs new function... well... functions 😊
Pretty cool...
- Get natural language qu from user (me)
- Translate natural language to function parameters
- Feed parameters to function to pull stats for the user from database.
- Build model from that data
- Answer the user's question.
Looks pretty accurate to me 😊
#SoYoureSayingTheresAChance
2
1
44
23,181
29 Aug 2023
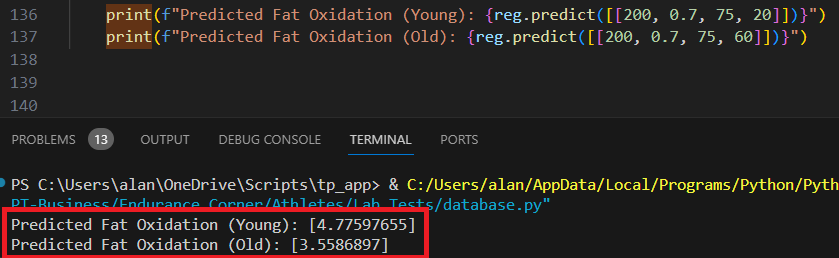
Today's #FunWithData
Pulling all tests from the database...
Even if all other markers of fitness remain the same, the average athlete will lose 0.03 kcal/min of #FatBurning power every year!
i.e. the average 60 yo will be burning ~25% less fat than the average 20 yo at a given power, even if they keep the same aerobic fitness!
Beyond general fitness, it's critical as we age, to our #MetabolicHealth, that we keep that fat oxidation strong!
29
19
179
172,241
19 Jun 2023
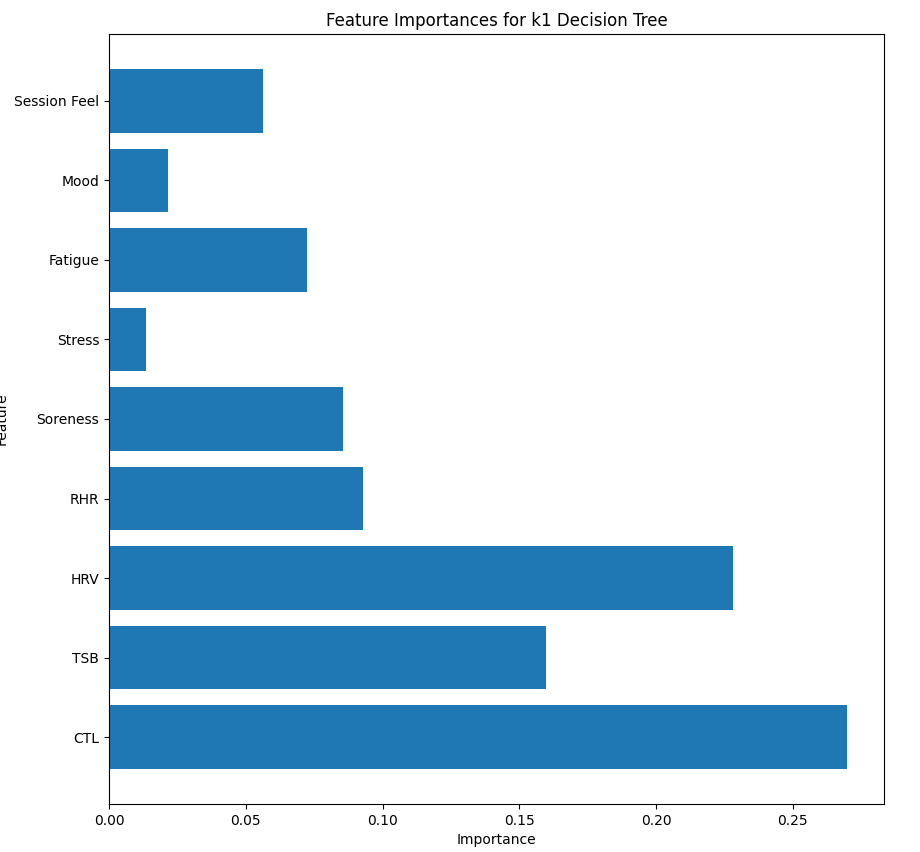
A little #FunWithData today...
Looking at how much of an influence different factors have on #TrainingResponse (Banister's k1) using a Decision Tree model....
1/CTL (negative)
CTL has the largest influence on training response for most athletes. This is just the nature of diminishing returns, i.e. novices respond more/faster than athletes with a long training history because they're starting from zero.
2/HRV (positive)
A high HRV is a good sign that the athlete will get good fitness benefit from a high training load that day. Particularly when paired with the below...
3/TSB (positive)
The higher the TSB, the more training response an athlete is likely to get from a given amount of load )of course, it must be <0 to qualify as load, but not too much <0)
4/RHR (negative)
When resting heart rate is higher than normal, the athlete's training response is likely to be compromised.
5/Soreness (negative)
When soreness is higher than normal, the athlete's training response is likely compromised.
For this reason, we should consider each of the above when deciding to load an athlete.
11
8
116
50,355
16 Apr 2023
A little #FunWithData this morning taking a deeper look at Nils' training in the lead-up to his 2 Olympic Gold medals for my upcoming chapter...
alancouzens.substack.com/
Despite some insane individual sessions, the overall proportion of time working threshold or above was a measly 6%.
90 % of the work was Eazzzy at 60-75% MHR

1
15
4,020

15 Apr 2023
Subsidence is the sinking or settling of the Earth's surface. When subsidence occurs, the ground level drops, which can have a range of negative effects on infrastructure, buildings, and the environment. In the United Kingdom, most subsidence is caused by the shrinking and swelling of clay-rich soils, which compress when dry and swell up when wet.
You might not know this, but subsidence is the second most costly environmental hazard in the UK after flooding. As the ground sinks or swells, the foundations of buildings can shift and crack, leading to structural damage.
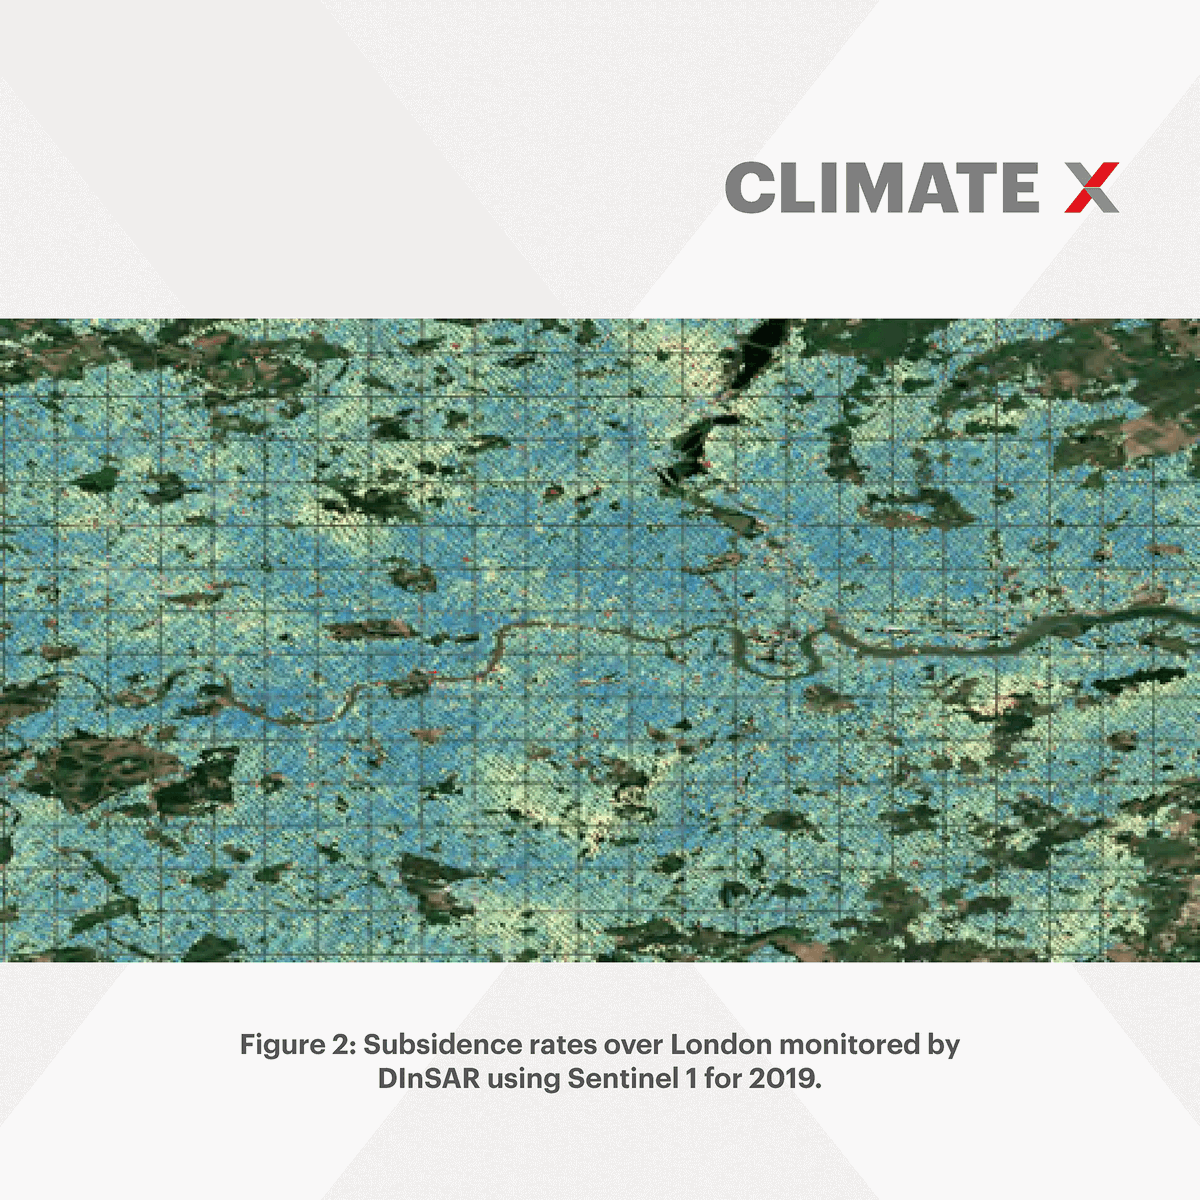
We can monitor subsidence from satellites with a technique called “Differential Interferometric Synthetic Aperture Radar” (DInSAR). As the satellite passes overhead, it sends out a beam of light towards the Earth's surface and records how long it takes for the beam to bounce back. This tells the satellite how far away the ground is, and can be used to create a 3D map of the Earth's surface. DInSAR takes this a step further by comparing two different measurements of the same location taken at different times.
We’ve included some images of subsidence rates over London monitored by DInSAR using Sentinel 1 for 2018 and 2019. A dry summer in 2018 caused considerable subsidence in areas of London, shown in red in the image, whereas a wetter summer in 2019 resulted in lower levels of subsidence.
If you want to see how your property/assets/portfolio/business might be at risk from subsidence, get in touch: climate-x.com/spectra.
#climatechange #climatescience #finance #science #funwithdata #subsidence #realestate #london


1
2
199
21 Mar 2023
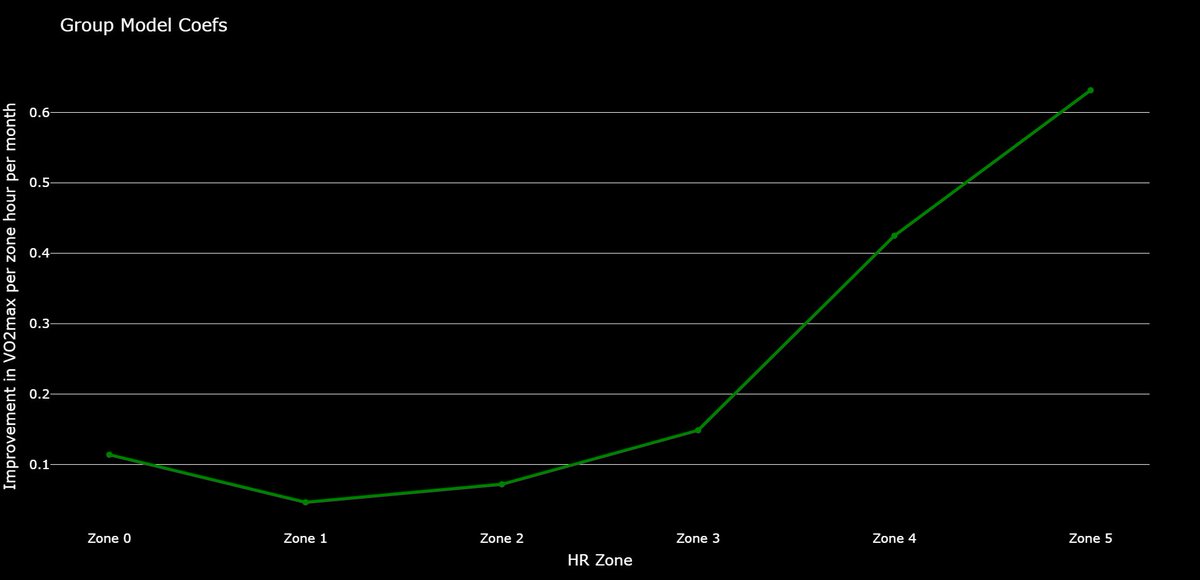
This morning's #FunWithData...
The "J" pattern of #TrainingZones
Change in #VO2max per hour/mth spent in each zone 3mths before the test.
While the bottom of the "J" varies, greatest benefit consistently comes from going very easy or quite hard.
#AvoidTheMiddle
#Polarized
20
10
120
142,823

3 Mar 2023
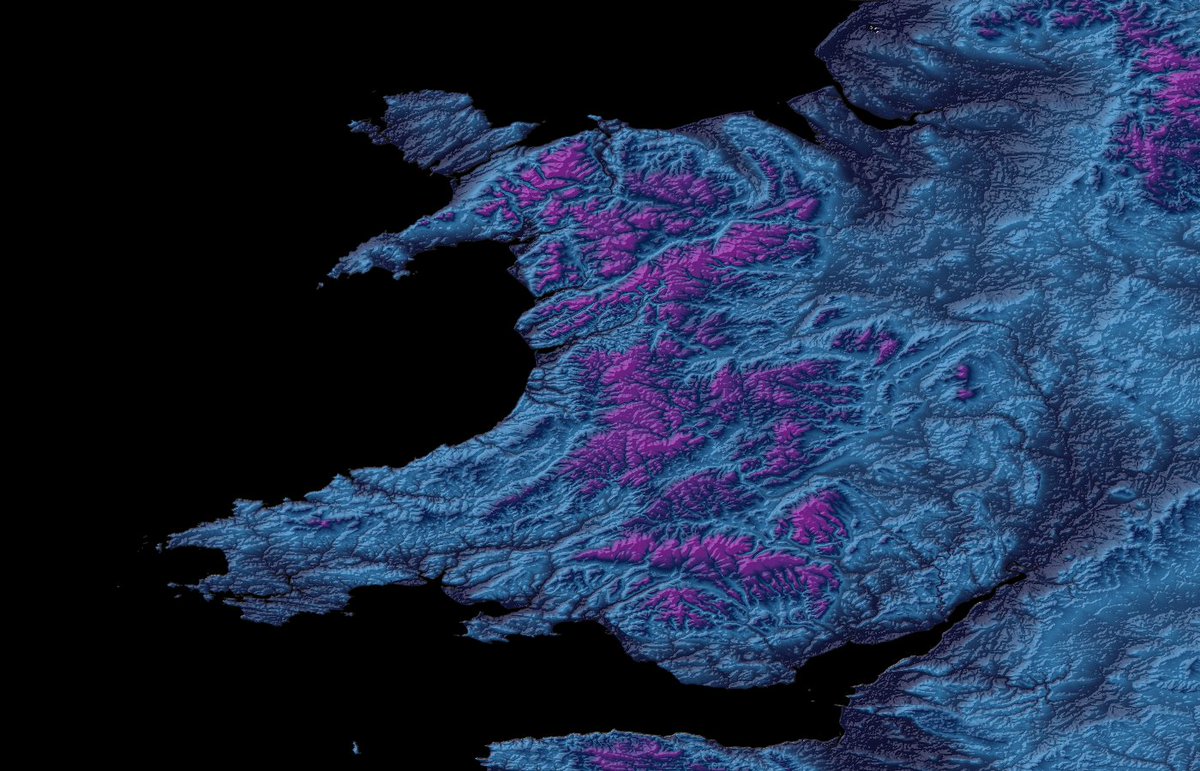
Friday is here, so let’s have #funwithdata!
Fathomer Rhianwen Davies used Fathom’s Global Terrain Data - FABDEM to create this beautiful render of the Welsh landscape in honor of #StDavid’s Day this week.
Can you spot your favorite Welsh mountains? 🏴
1
1
2
402
10 Feb 2023
Global roads data helps better model the role of humans in contributing to global fire risk. Knowing the location of roads helps us predict where fires could start.
Full context 👉 bit.ly/3Xid5oZ
#climatescience #climatetech #climaterisk #coolstuff #funwithdata
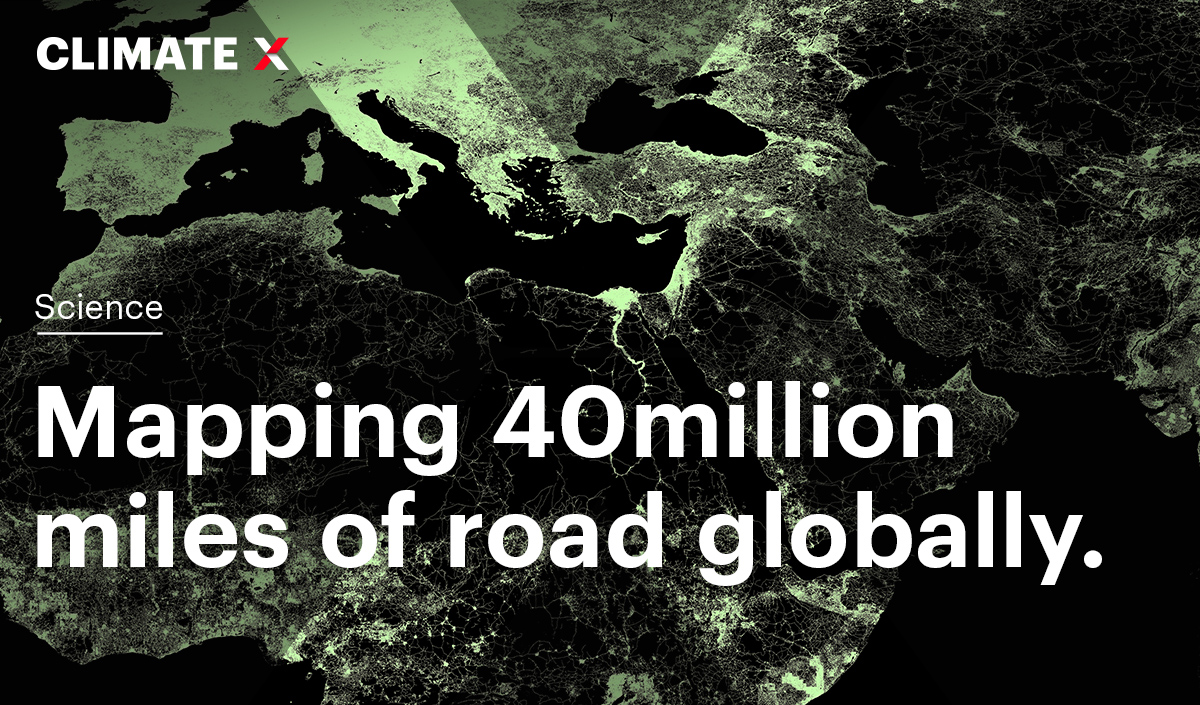
ALT Mapping 40 million miles of road globally, with Spectra

ALT All the roads in Shanghai, China
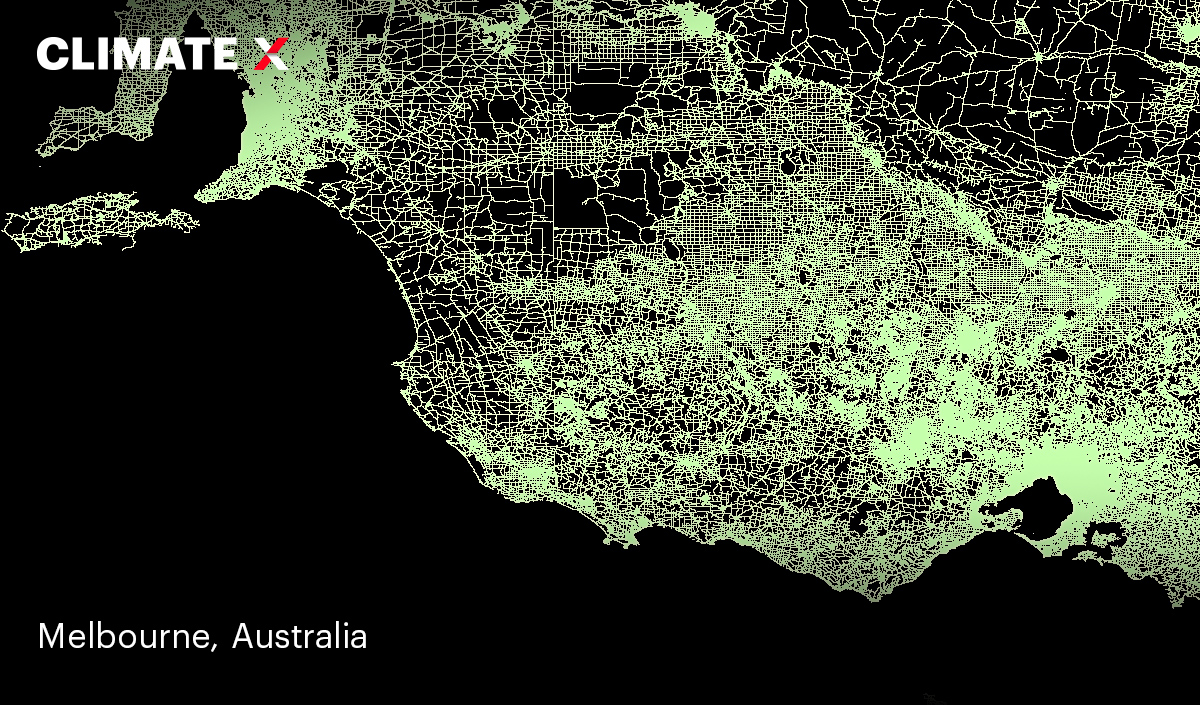
ALT All the roads in Victoria, Australia

ALT All the roads in Brazil, South America
1
3
476

8 Feb 2023
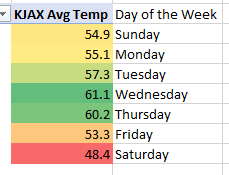
@GaughanSurfing @MikeFirstAlert @wxgarret @NWSJacksonville mild mid-weeks since Dec 16.. cool weekends. #funwithdata
3
3
134


31 Jul 2022
Imagine replacing the name of your city with the name of its most “notable people”.
Bellow is a screenshot of an interactive database that just do that for a part of Morocco.
The database : lnkd.in/e82D-rHD
#FunWithData lnkd.in/e56Z2i4u


26 Jul 2022
If you fancy some #funwithdata you can check out our interactive map to see how productive your local area is compared to the national average...
datawrapper.de/_/OsmEv/
26 Jul 2022

Read todays @NorthernAgenda_ edited by @RobParsonsNorth for work by @NP_Partnership analysing @ONS data to demonstrate the 40 per cent gap between #North and #LondonSE on the productivity challenge e.manchestereveningnews.co.u…
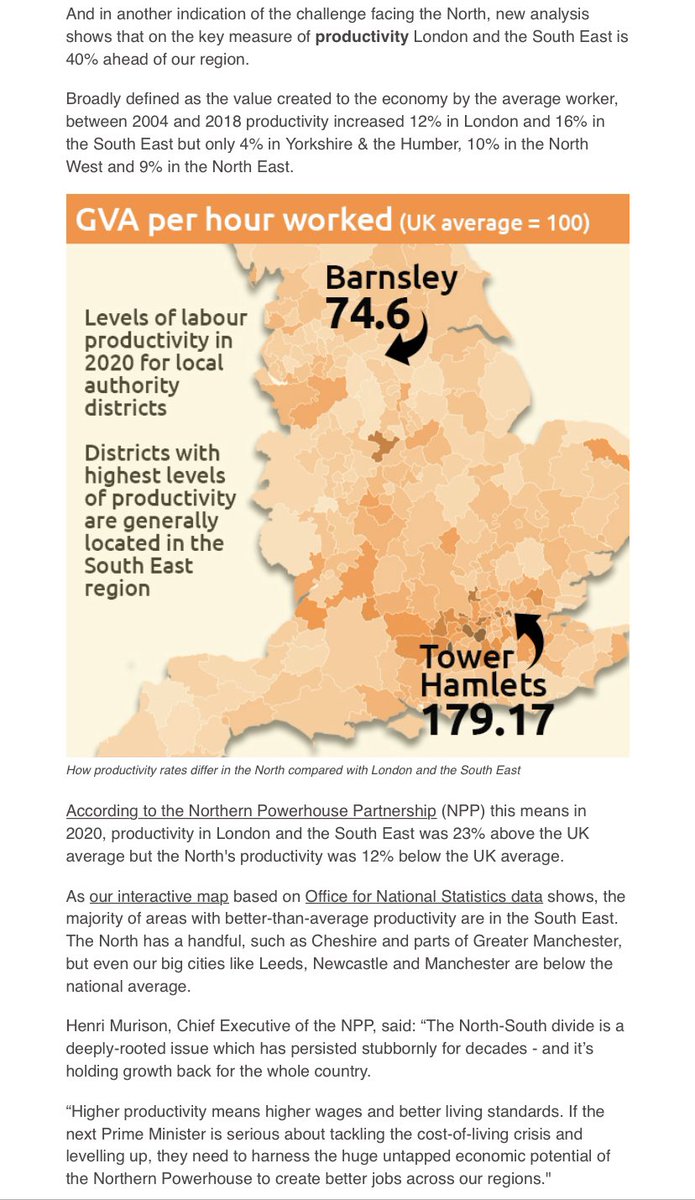
2