
23 Dec 2025
Understanding your land or tract’s story requires more than a static map. It requires context, history, and the ability to compare conditions over time. Our latest release brings all of this directly into the GoTrace platform.
linkedin.com/posts/chainpare…
2
19

25 Aug 2025
it’s 2025 and we still don’t have a proper goroutine visualizer for production workload
people point to gotrace and say "well there's that" but gotrace requires patching the Go runtime and hasn't been maintained since basically forever, plus it only works with toy programs because WebGL just dies when you try to visualize anything with more than a few dozen goroutines which is completely useless for real world debugging
the first issue is that goroutines are these incredibly lightweight abstractions that the runtime multiplexes onto OS threads in ways that are almost impossible to track without massive performance overhead. when you have thousands of goroutines (which is normal), trying to capture their lifecycle events, channel operations, and state transitions in real time creates this observer effect that completely changes the behavior you're trying to debug
the Go runtime actually HAS most of the data we need through the execution tracer (go tool trace) but it's buried in binary format that's optimized for post mortem analysis, not real time visualization. the tracer can show you goroutine scheduling, channel ops, GC events, all of it, but only after your program finishes running
pprof gives you snapshots but no temporal information, delve lets you inspect individual goroutines but has no concept of the bigger picture of how they interact over time.
the closest thing we have to a decent solution is GoLand's goroutine debugger view but even that is just a static list with stack traces, no visualization of communication patterns, no timeline view, no way to see the actual concurrency flows that make Go programs so powerful (or so broken)
what we actually need is something that can hook into the runtime at a much deeper level, maybe using eBPF or similar kernel tracing tech to capture events with minimal overhead, then stream that data to a visualization layer that can handle the scale. but that's a massive engineering effort that would require deep runtime knowledge and nobody wants to maintain something that complex
the other issue is that most goroutine bugs aren't actually about individual goroutine behavior, they're about properties of the system like deadlocks, resource contention, subtle race conditions that only happen under specific timing conditions. you need to see the forest, not the trees, and current tools are all tree focused
we're still debugging concurrent Go programs by throwing fmt.Printf statements around and hoping for the best, or staring at wall of text stack dumps trying to piece together what 47 different goroutines were doing when everything went sideways. it's honestly embarrassing for a language that makes concurrency so central to its identity
the community keeps building these point solutions like better pprof UIs, nicer delve integrations, prettier trace viewers but nobody is tackling the core problem of making goroutine behavior actually visible and understandable in real time. we need something that shows you the shape of your concurrent system, not just its individual components
2
24
1,671

23 Jul 2025
Trace is moving on in Dallas!
With a 1up victory in the opening round of match play, Trace will compete in the round of 32 tomorrow morning 😤
G.A.T.A., TC! 🦅
#HailSouthern | #GoTrace
1
24
826

EUDR's Article 9 requires full supply chain due diligence to prevent deforestation. Products must meet origin country laws and UN human rights standards, with specific data. Is EUDR concerning you? Contact us to discuss how GoTrace can help your compliance efforts.

4
485
6 Feb 2025
🚀 Our January Newsletter is here!
Start 2025 with the latest updates on supply chain transparency, industry trends, and how GoTrace is making an impact. Don't miss our insights and success stories!
📖 Read now: Chainparency January Newsletter: medium.com/chainparency/janu…
3
45
25 Jan 2025
GoTrace is being used all over the US forestry industry. Check it out here!
2
4
80
6 Dec 2024
We’re proud to see Penn State University's spotlight on our #GoTrace platform! It’s rewarding to see our work published in a top academic journal and validated by esteemed professors from Penn State, @utknoxville, @utsa, and @UHouston
linkedin.com/feed/update/urn…

1
5
79
2 Dec 2024
The Food Safety Modernization Act (FSMA) sets the bar high for food safety and traceability. Are your supply chain processes ready to meet the challenge? GoTrace by Chainparency makes FSMA compliance a breeze!
Visit chainparency.com?utm_campaig… and discover how GoTrace can help!

5
71
19 Nov 2024
GoTrace, the first EU Regulation on Deforestation-free products (EUDR) compliance solution powered by blockchain technology.
GoTrace makes regulatory reporting easy, simple, convenient, and efficient.
chainparency.com/gotrace?utm…

3
100
1 Nov 2024
Since our last product update, we continue to add new features and functionalities for our GoTrace platform. Here we’ll highlight the latest GoTrace filtering, reporting, and data export capabilities for regulatory and carbon accounting reporting.
medium.com/chainparency/chai…
2
85
2 Oct 2024
Our partners at ProNatura have used GoTrace to pilot fish traceability from the Alto Golfo region in Baja California, ensuring fish have been caught with vaquita safe equipment and not come from protected marine refuges. Check it out here! storymaps.arcgis.com/stories…
1
3
183

17 Aug 2024
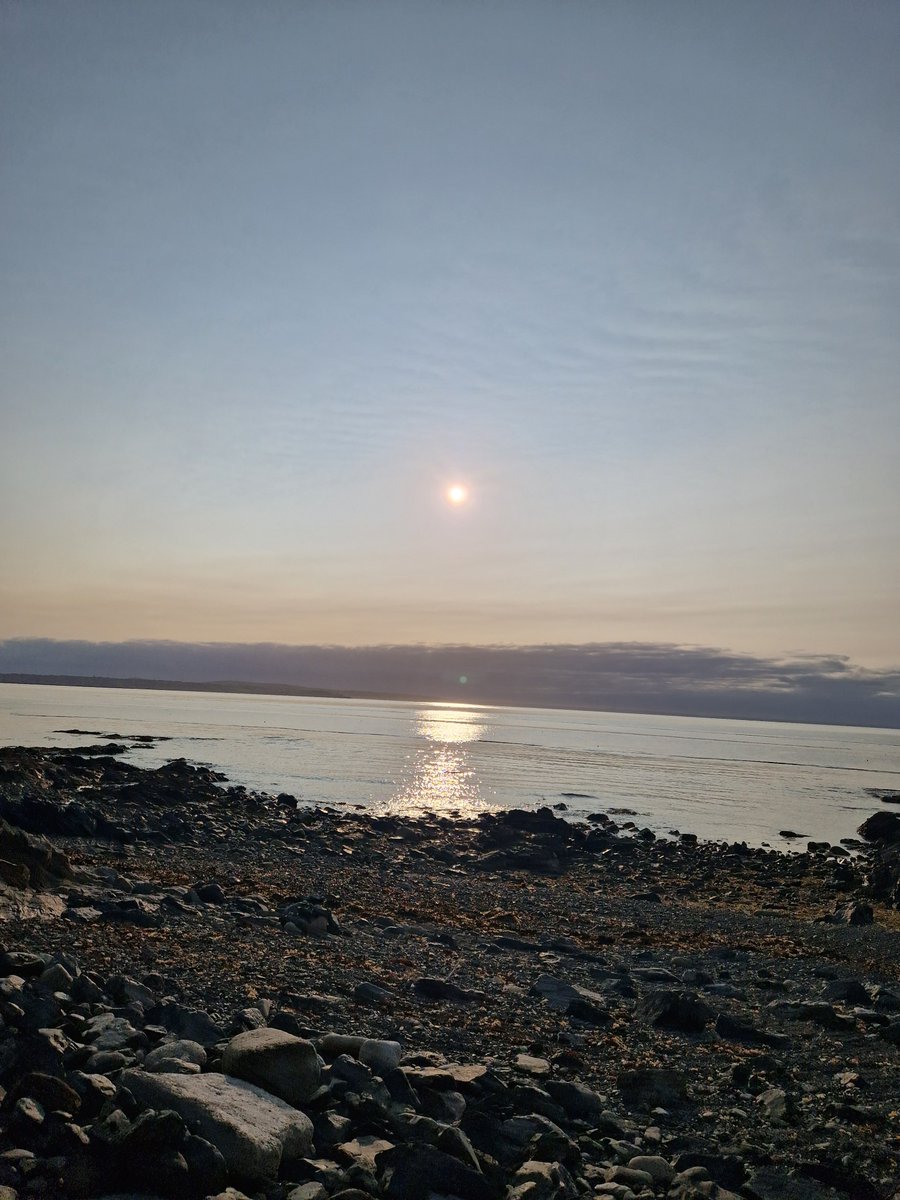
Just opted for a cheeky #6amclub 5k this morning & had a lovely chat with a lovely lady I see every year; nice to catch up!! Did a shorter run to take me to over 32 running miles from Sunday to Saturday - well chuffed!! #ukrunchat #running #GoTrace #training ❤️🏃♀️☀️
1
24
409

14 Aug 2024
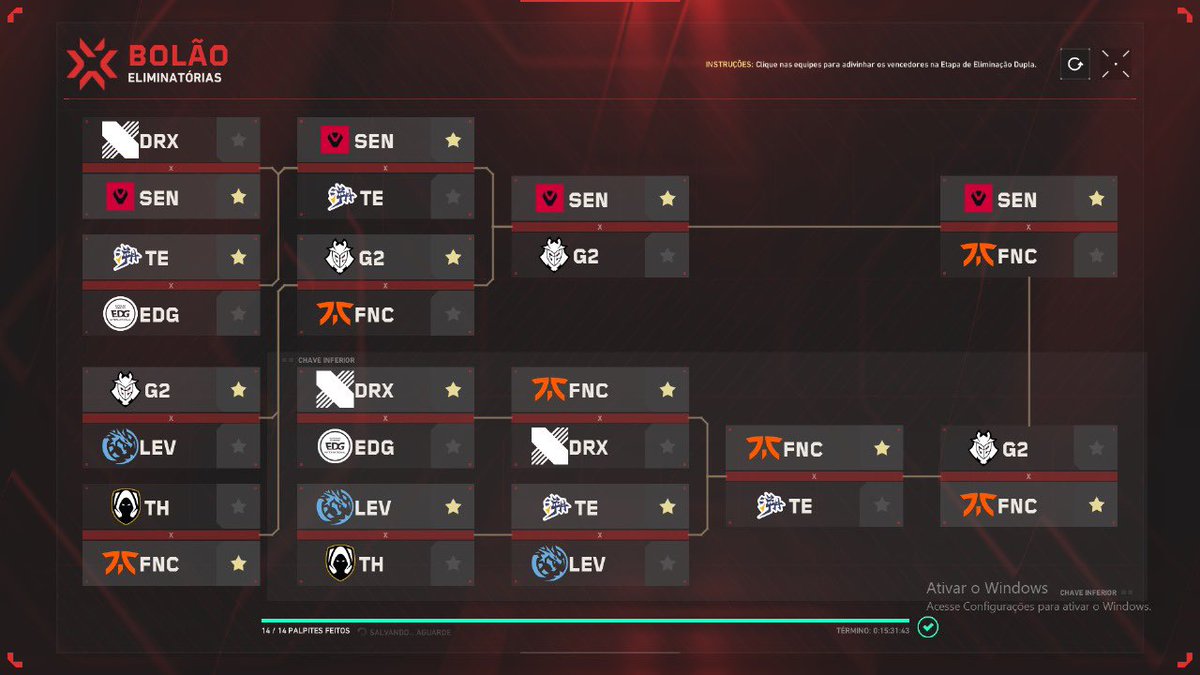
Já que esse Champions tá imprevisível, eu meti o louco nos playoffs. 🙂↔️🙂↔️
#goTRACE #VALORANTChampions 😂🙂↔️
1
3
419
18 Jun 2024
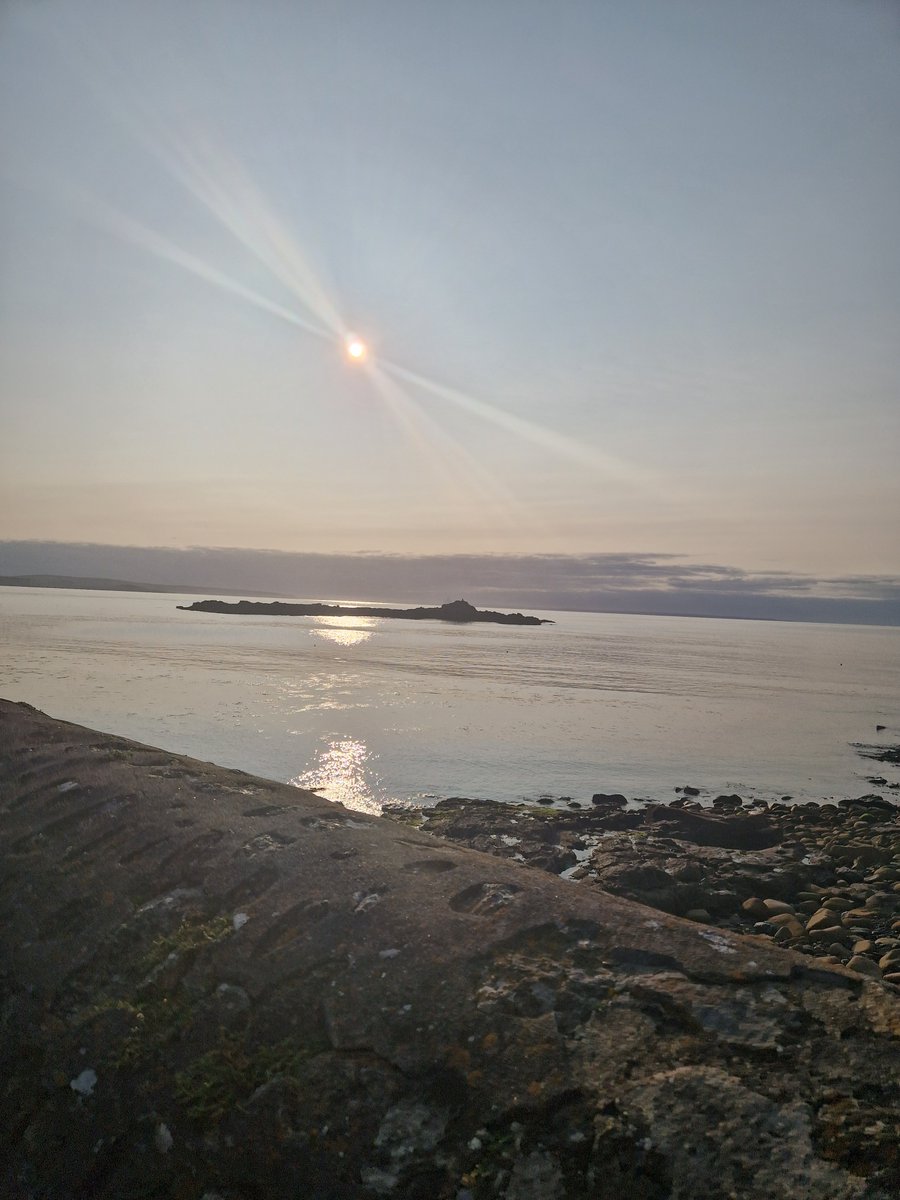
Yay for #HumpDayEve!! Celebrated with another fabby pre work #5amclub 5k to my bridge - obv - lovely & sunny out there with a welcome breeze! 26 working days to go - this girl can do this! #ukrunchat #running #GoTrace #countdown 😂💓🏃♀️☀️🫡
1
9
320


29 May 2024
Yay for my #FridayEve; just today & tomorrow to go before another 3day #weekend!! Celebrated with another #5amclub 5k - number 10 in a row before work & rather refreshing out there! Have a good day peeps; today is a good day!! #ukrunchat #running #GoTrace #countdown ❤️🏃🥳🎉🍃
6
19
384
28 May 2024
Yay for my #humpday!! Not working Friday this wk so just 3 days to go until another long weekend!! Celebrated with another #5amclub pre work 5k & legs felt amazing! Bit muggy & dribbly out there! Have a good day peeps! #ukrunchat #running #GoTrace #happydays 🥳🎉🏃🌧️☂️
4
16
339
27 May 2024
Fabby #7amclub 1.20mile run all ticked off this morn, before a nice 2.6mile bridge/canal walk - lovely & sunny out there at the mo! Now to chill! #ukrunchat #running #GoTrace #chillout 😀❤️🏃
3
15
477
26 May 2024
Rather fabby #6amclub 10.17mile run round my fav rural route; set out to go slower, less stops & run it better & achieved all of these & still ran under my 2hr 30min Half target time! Happy Days! Have a good #Sunday peeps! #ukrunchat #running #GoTrace #BankHoliday #training ❤️🏃♀️
5
17
384