
Jun 13
Further context ..
ComponentDaily Volume ImpactNotes
🟥Middle East Net Loss-8.5 million bpd11.0M bpd shut-in, minus 2.5M bpd bypassed via East-West pipelines
🟩Organic Production Increases 2.3 million bpd 1.5M bpd from US/Brazil/Guyana; 0.8M bpd combined from Russia, Venezuela, and Africa
🟩Demand Destruction 1.1 million bpdBarrels saved globally due to record-high fuel prices and refinery run cuts
👉🏼Net Structural Market Balance-5.1 million bpdCurrent Daily Deficit
So the world is only 5% short and this is currently being met by outflows from strategic oil reserves. .. 5% is no big deal but could drive oil prices well above $100 but only in the short-term as everyone adjusts.
267

8 Sep 2025
Nope this is a lie. Here is the distribution of benefits by income group per chat gpt. This is an easy falsehood to debunk folks, this was not a helper to the middle class. It was a gift to the wealthy.
Here’s a breakdown of the One Big Beautiful Bill Act (OBBBA)—commonly referred to as the “big, beautiful bill” of 2025—focusing on how its tax cuts and policy changes affect different income groups:
---
Distribution of Tax Benefits by Income Group
1. Majority of Tax Relief Flows to the Wealthy
Top 20% of earners receive over 70% of all tax relief under the bill.
Within that group, the top 1% alone receive over 20% of all tax benefits.
Another analysis supports this: 72% of overall benefits go to the top 20%, while low-income households may lose up to 2.9% of their income due to cuts in social supports.
2. CBO—Tax Cuts vs. Losses from Reduced Benefits
The Congressional Budget Office (CBO) estimates:
Top 10% of earners gain about $13,600 annually in tax cuts.
Bottom 10% actually lose approximately $1,200 per year, largely due to reduced access to programs like Medicaid and SNAP.
3. Yale Budget Lab: After-Tax-and-Transfer Income
When considering both tax changes and increased tariffs:
The bottom 10% experience an average 7% reduction in after-tax-and-transfer income.
In contrast, the top decile (top 10%) see an increase of about 1.5%.
4. Budget Lab (Standalone Tax Cuts)
Relative to a baseline that assumes the Tax Cuts and Jobs Act (TCJA) would have continued:
About 1/3 of households see no additional benefit beyond the TCJA provisions.
Nearly half receive a tax cut of less than $100 for the year.
Two-thirds see less than $500 in additional tax relief.
Highest gains are in the upper-middle income range:
Fourth quintile (approximately $75K–$130K): >50% see cuts of at least $500.
Top quintile: 50% of households receive at least $1,000 in tax cuts.
---
Summary Table: Tax Benefits by Income Group
Income GroupMain ImpactNotes
Bottom 10%Net loss of resources−7% after-tax-and-transfer income; −$1,200 due to benefit cuts
Lower–Middle ClassMinimal or no additional tax cutUnder TCJA baseline, many see < $100 relief
Upper–Middle ClassModerate gainsMany gain $500–$1,000 ; largest standalone tax relief
Top 10% & 20%Majority of tax benefits—by far 70–72% of tax relief; top 1% receives >20% of benefits
Key Takeaways
Wealthier households—particularly the top decile—are the primary beneficiaries of tax relief under the OBBBA.
Low-income households often lose out, both through reduced social benefits and negligible or no tax relief.
Upper-middle-income families gain more than lower-income groups but much less than top earners.
When comparing to a scenario where the TCJA remained, most households see little to no additional benefit, whereas the affluent reap the largest rewards.
---
1
6
99

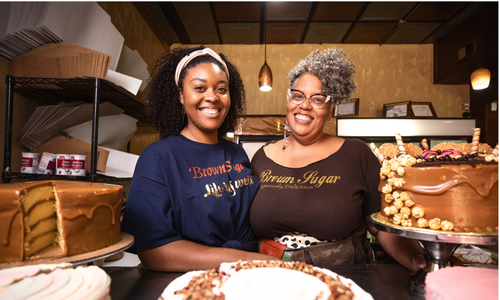
Need gift-giving inspiration? Proceeds of our #ImpactNotes finance entrepreneurs rooted in our communities like those featured in our #SmallBiz Shopping Guide: lisc.org/our-stories/story/2… #smallbusiness #giftguide #shopsmall
1
1
4
166
Happy 4 Year Anniversary to LISC #ImpactNotes! We want to celebrate and thank our investors who have raised over $224 million to date to help forge resilient and inclusive communities of opportunity across 49 states. [1/3]
1
1
5
195
LISC celebrates raising $200 million in #ImpactNotes! Our investors’ commitment to #impactinvesting made this possible, helping us raise funds to refinance our existing debt and invest in people places underserved by the traditional financial system. [1/3]

1
2
201
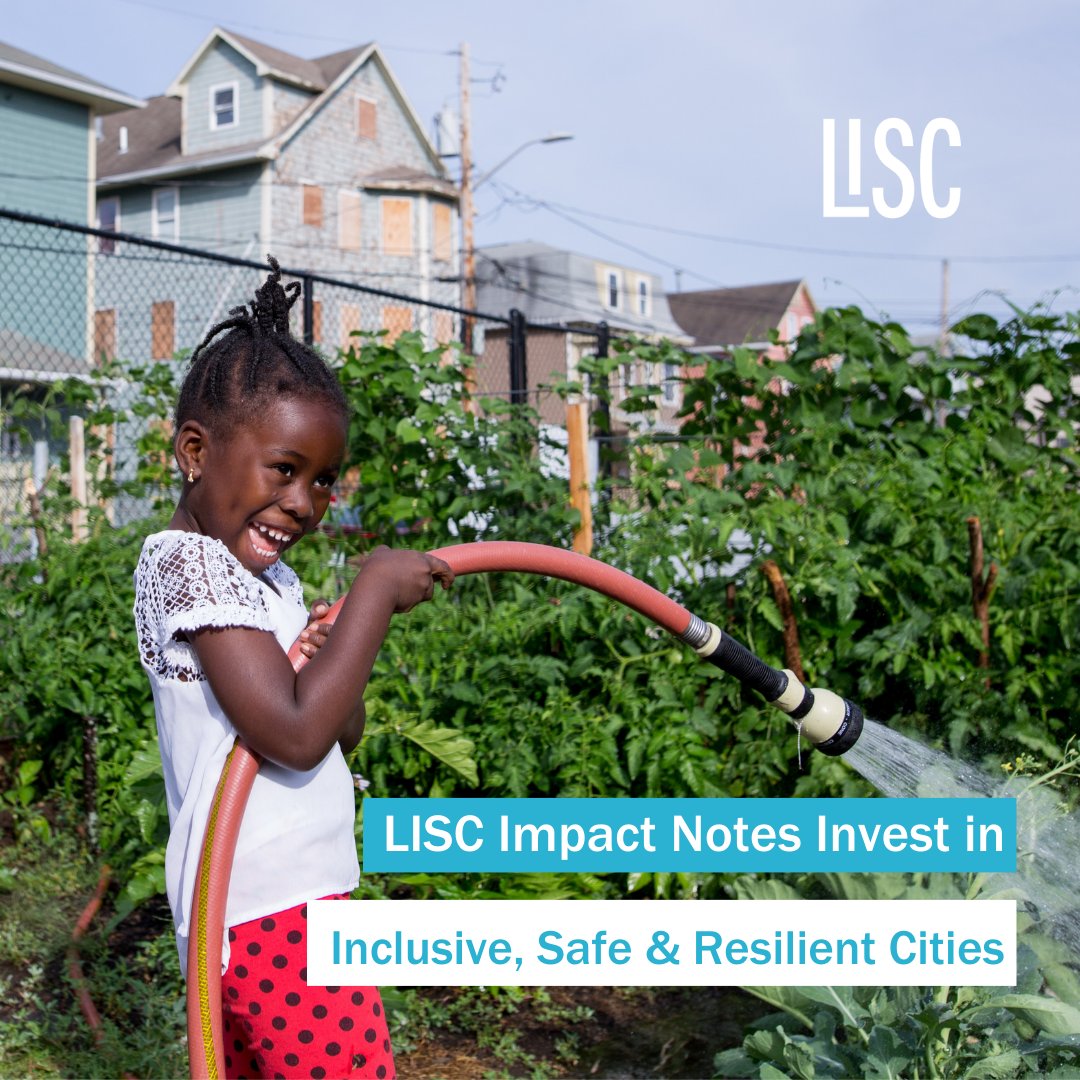
Join us in celebrating #UNWorldCitiesDay by investing in LISC #ImpactNotes, which help groups like @1_neighborhood develop inclusive, safe and resilient cities across Greater Providence #impinv lisc.org/our-resources/resou…
1
1
4
348
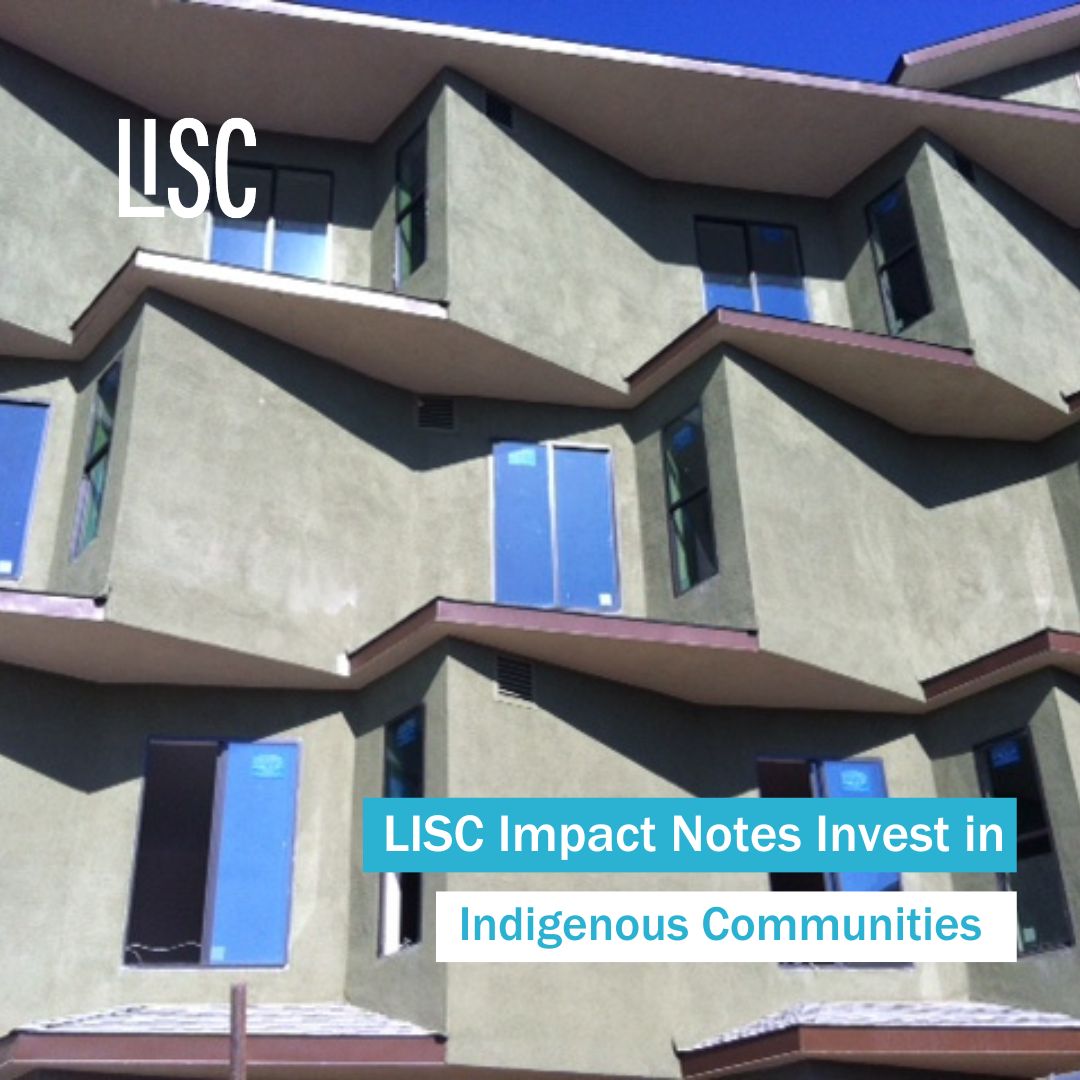
Celebrate #IndigenousPeoples Day by investing in LISC #ImpactNotes. Proceeds help grow our portfolio of projects supporting groups like @NAC_Phoenix who provides housing and culturally appropriate services in Phoenix #IDWIP lisc.org/our-resources/resou…
1
2
3
447
Celebrate #PrideMonth by investing in LISC #ImpactNotes! Proceeds help grow our portfolio of projects funding groups like @TransLatina_C whose important advocacy work serves the Trans Latina community: lisc.org/our-resources/resou… #Pride2023
1
2
290
Celebrate #NationalHomeownershipMonth by investing in LISC #ImpactNotes. Proceeds help grow our portfolio of projects supporting homeownership, like Stonley-Brookley, which is creating 45 affordable units and artist studios in Jamaica Plain. Read more: lisc.org/our-resources/resou…

1
1
3
311
Celebrate #AAPIHeritageMonth by investing in LISC #ImpactNotes. Proceeds grow our portfolio of projects funding groups like @AsianCDC whose work supports affordable and sustainable AAPI communities in Boston, MA #impinv lisc.org/our-resources/resou…
1
2
218
#Retailinvestors and #ImpactInvestors, align your portfolio and values this #EarthDay. LISC #ImpactNotes help use #greenbuilding techniques to invest in sustainable and energy-efficient communities. lisc.org/our-stories/story/g… #impinv #ESG
1
2
5
366
Did you know that LISC #ImpactNotes help communities flourish by investing in quality healthcare, nutritious food and safe places to play? Align your values and your portfolio today: lisc.org/invest #impinv #WorldHealthDay
1
1
3
299

27 Oct 2022
Noon Today more than 350 people will join @EconInclusion for our report launch on solutions for legislative accountability for closing racial wealth gaps with #RacialEquity #ImpactNotes join us! bit.ly/pi-oct2722
1
2
Celebrate #IndigenousPeoples by investing in LISC #ImpactNotes. Proceeds help refinance our existing debt and grow our portfolio of projects supporting groups like @NAC_Phoenix who provide housing and culturally appropriate services in Phoenix. #IDWIP lisc.org/our-resources/resou…
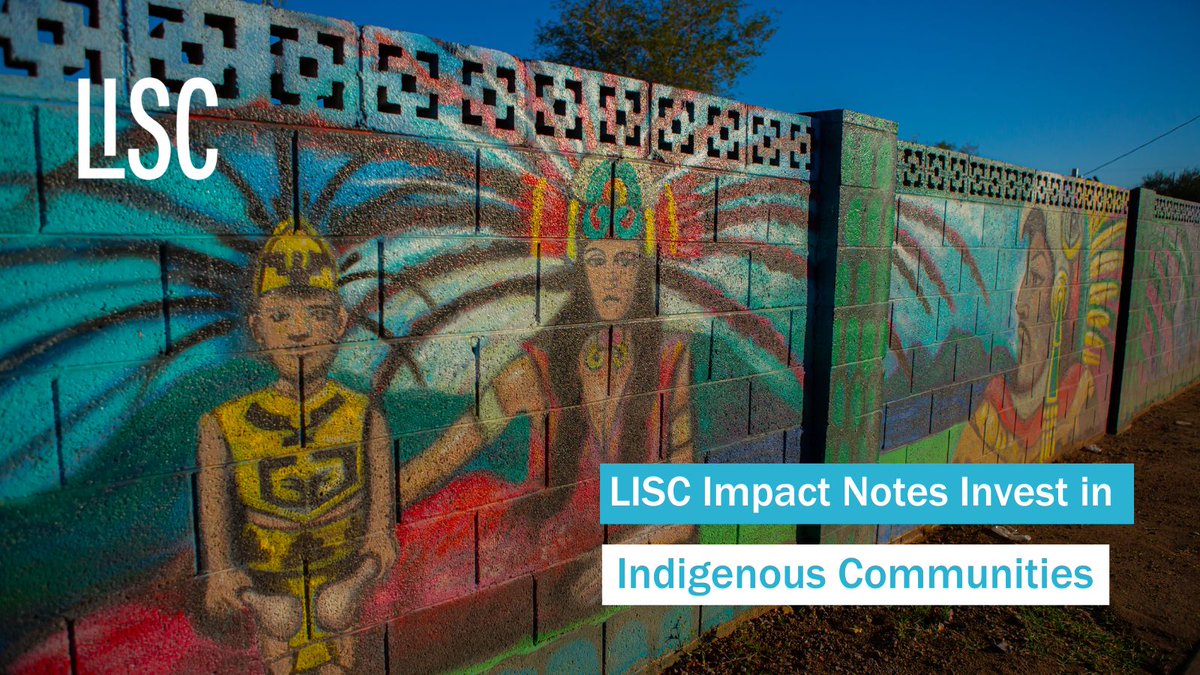
ALT A mural of indigenous peoples in cultural attire. Text overlay reads, "LISC Impact Notes Invest in Indigenous Communities".
1
1
3
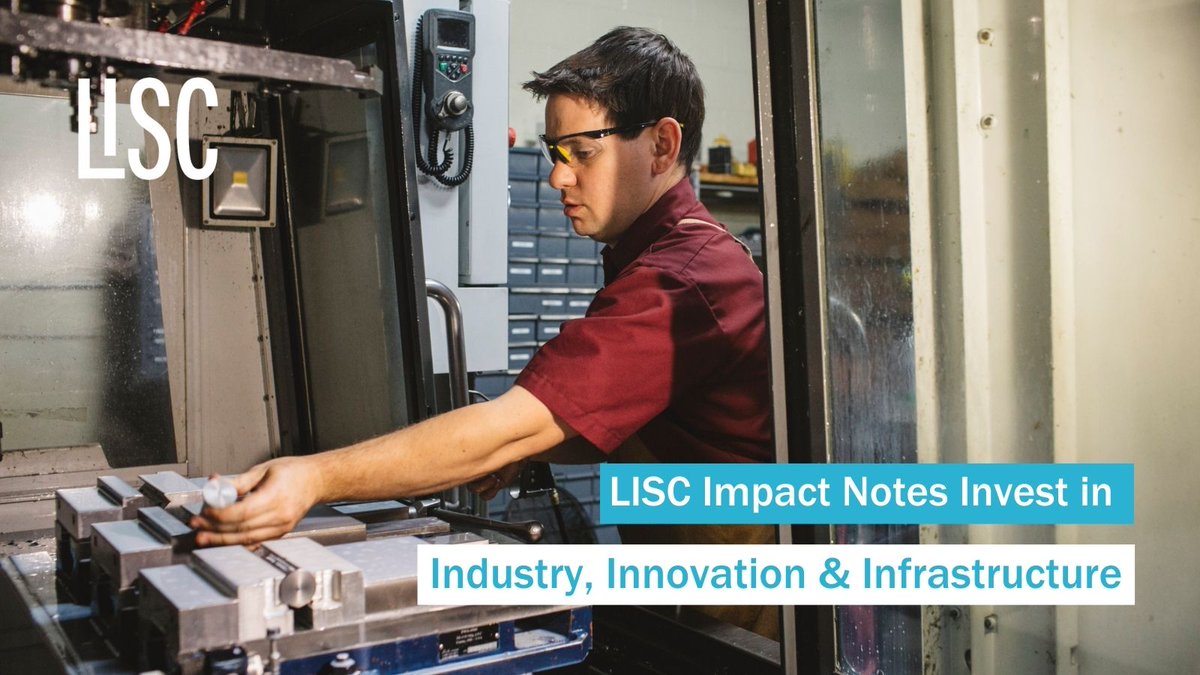
Industry, Innovation & Infrastructure is @UN’s #SDG9. #ImpactInvestors can contribute by purchasing LISC #ImpactNotes, which refinance our existing debt & invest in projects like MaKen Studios, a hub for small manufacturers & artisans in Philly. lisc.org/our-resources/resou…
1
2
5
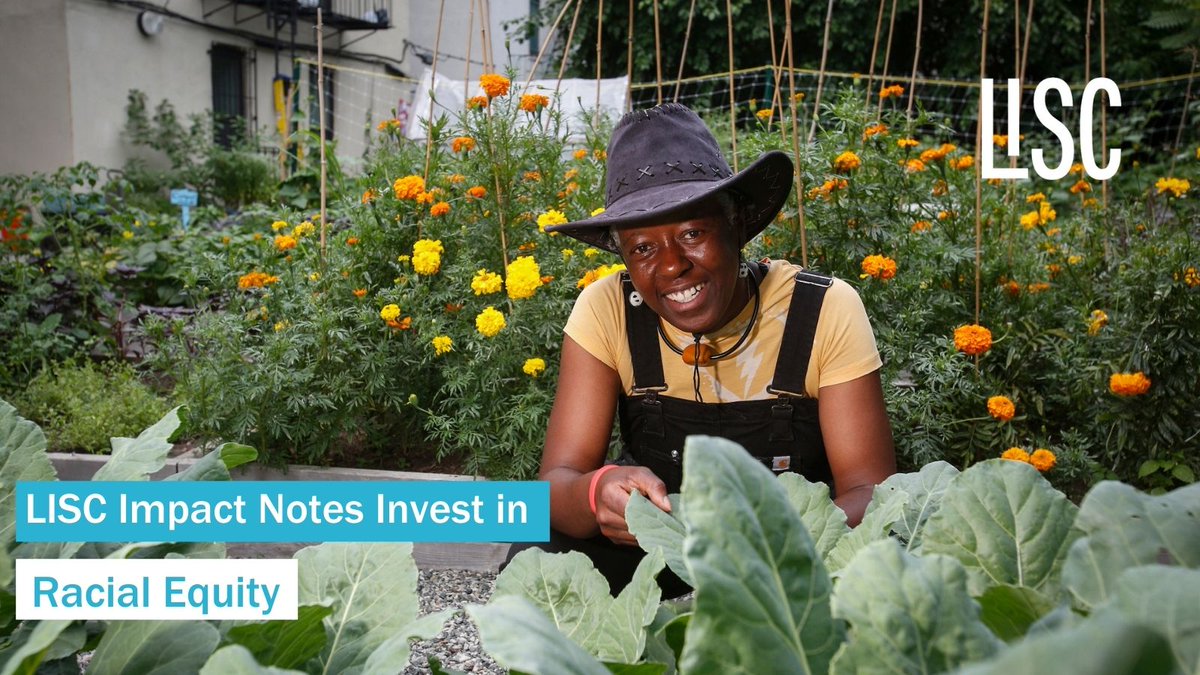
Did you know up to $10M in #ImpactNotes proceeds will support #Project10X, @LISC_HQ’s $1B commitment to #racialequity? #ImpactInvestors this is your chance to take part: ‘AA-’ rated notes are available in denominations starting at $1,000. Learn more lisc.org/invest
1
2
Are you an #ESGAdvisor looking for new paths to #SRI investing this #EarthDay? LISC ‘AA-’ rated #ImpactNotes were named @Enviro_Finance’s Corporate Social Bond of the Year in 2021. Learn more about #impactinvesting in #CDFIs today lisc.org/invest #impinv #fixedincome
1
1
3
#Retailinvestors and #ImpactInvestors, align your portfolio and values this #EarthDay. LISC #ImpactNotes help refinance our existing debt and use #greenbuilding techniques to invest in sustainable and energy efficient communities. lisc.org/our-resources/resou… #impinv #ESG
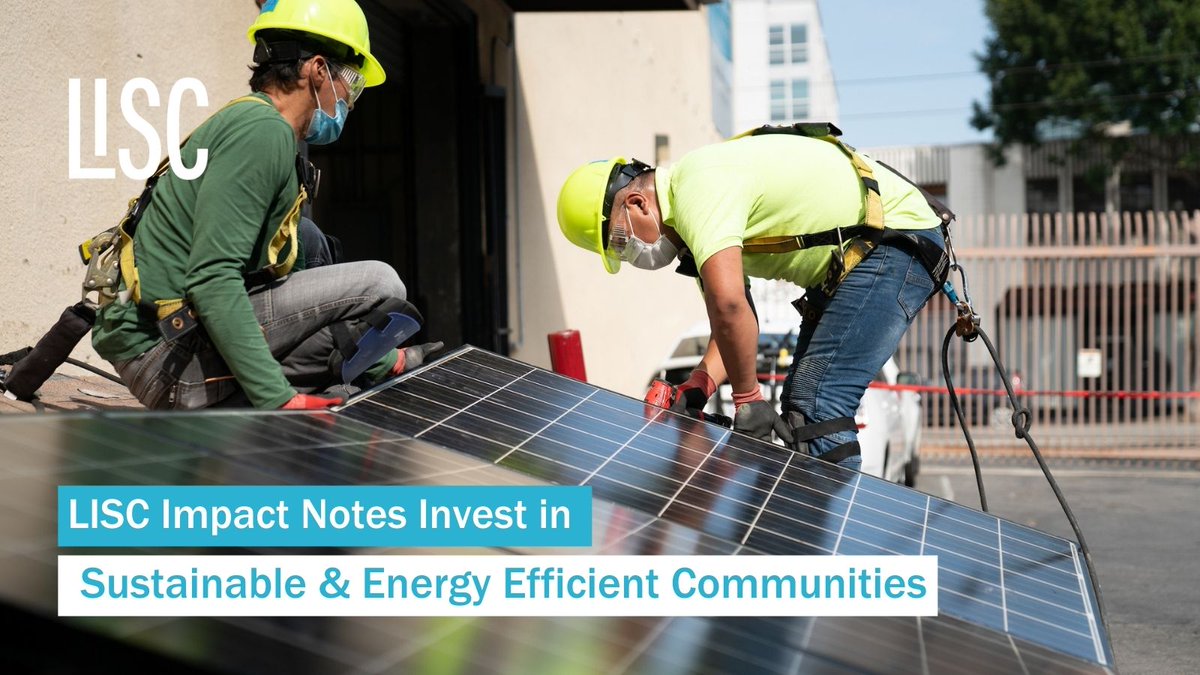
ALT Two people install solar panels. Text reads "LISC Impact Notes Invest in Sustainable & Energy Efficient Communities"
1
2
2
Did you know that LISC #ImpactNotes help communities flourish by refinancing our existing debt and investing in quality healthcare, nutritious food and safe places to play? Align your values and your portfolio today: lisc.org/invest #impinv #WorldHealthDay2022

ALT A group of people smile at a baby. Text reads "LISC Impact Notes Invest in Healthy Communities"
1
1
2
How can the financial industry create new pathways to #ImpactInvesting for #retail investors? LISC CFO Christina Travers reflects on raising $100 million in #ImpactNotes capital and ways to democratize investing in community development finance. lisc.org/our-stories/story/l…
1
5
6