
May 16
Day 97. Hot air balloons everywhere! 🪂
Late-campaign lightweight piece: one clear visual idea, but still built on a proper geospatial stack.
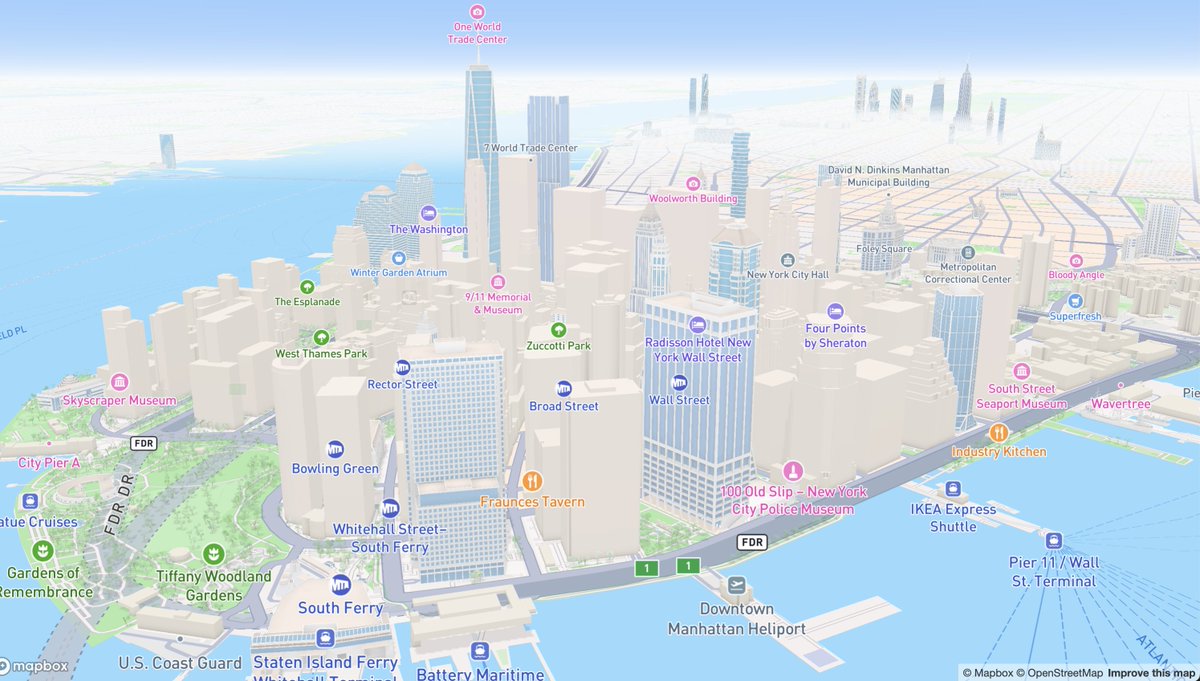
Hot air balloon glTF above dense 3D buildings in Mapbox GL JS, with animation lighting in a custom Three.js layer rendered over the map WebGL canvas.
Click/touch relocates the balloon. Playful interaction, geographically anchored.
maptheclouds.com/playground/…
#100DayMapChallenge Day 97/100
#ThreeJS #WebGL #MapboxGL #MapTiler #Geospatial #CreativeCoding #Animation #3DMaps
2
12
892
May 11
Week 13 Reflection
This week moved between very different map experiments and spatial systems, from audio-reactive city motion and walkability to atmospheric particle studies and a major full-stack environmental platform.
The second half returned to browser 3D and map-native interaction through World Earthquakes, Making Lights, and Snow Dome Anywhere.
Not every day is a traditional map, and that is intentional. This campaign became a way to revisit projects, client systems, and failed ideas that shaped my spatial storytelling practice.
A personal note about AI.
For a while, I was genuinely angry at it. After years of struggling with freelancing, I had finally started to feel that things were stabilizing, then mainstream AI arrived and the industry shifted again. It became difficult not to question whether all those years of self-study, experimentation, uncertainty, and personal brand building had really been worth it.
This campaign became, in part, a way of acknowledging that past while trying to make peace with the future. Somewhere during these 100 days, I stopped seeing AI only as competition and started experimenting with it as a collaborator, amplifier, and extension of curiosity.
Now I sometimes feel like a kid at Hogwarts holding a magic wand for the first time. I have barely scratched the surface of what becomes possible when spatial thinking, rendering, storytelling, and AI start working together.
I still have a million map ideas in my head, except now many of them suddenly feel reachable.
Let’s bring them to life.
I’m available for new projects.
Thank you to everyone who joined me throughout this journey, and for all the support, patience, feedback, and conversations along the way.
Week 14 begins today.
#100DayMapChallenge #DataVisualization #Animation #Geospatial #GIS #OpenSource #3DMaps #FOSS4G #ThreeJS #WebGL #MapLibreGL #MapboxGL #QGIS
ALT Days 85-91 moved across very different spatial directions: audio-reactive city motion, walkability, particle-based atmosphere, a client-scale environmental platform, seismic and lighting studies, and Snow Dome Anywhere as a quiet 3D close. Different subjects, same method: follow the question, then choose the tool.
4
132
May 10
Day 91. Snow Dome Anywhere (3D Particles) ❄️
What happens when a city map shifts from analysis to atmosphere?
This experiment turns a dense 3D city view into a quiet snow-dome version of itself.
Mapbox GL JS holds the base with the MapTiler Winter theme, while a custom Three.js/WebGL layer adds snow particles, soft glow, and a subtle dome-like effect. Navigation remains fully explorable, but every click transforms the map into a small snow globe.
Inspiration: FOSS4G Bucharest 2019 - @RealIvanSanchez and @BNiene.
Even though I followed it only online, the work presented by these two wonderful people stayed with me throughout my growth as a freelancer. I remember seeing what they built and thinking: this is what I want to do with maps too - transform maps from static, boring images into compelling stories and experiences.
Thank you!
BTW: FOSS4G Europe 2026 is coming: 2026.europe.foss4g.org
The conference is planned for 29 June - 3 July 2026 in Timișoara, Romania.
Do not miss it - it might change your life.
#100DayMapChallenge Day 91/100
#ThreeJS #WebGL #MapboxGL #MaplibreGL #MapTiler #Geospatial #Animation #DataVisualization #OpenSource #3DMaps
1
15
909

Great... #mapboxGL js for map rendering and #deckGL js for #visualisation layer rendering is a great solution.. This is indeed attractive
I am working on some self customised libraries using #3GS , layers on #geojson as a side project. - learnings ON! 🥳✌️
3
358

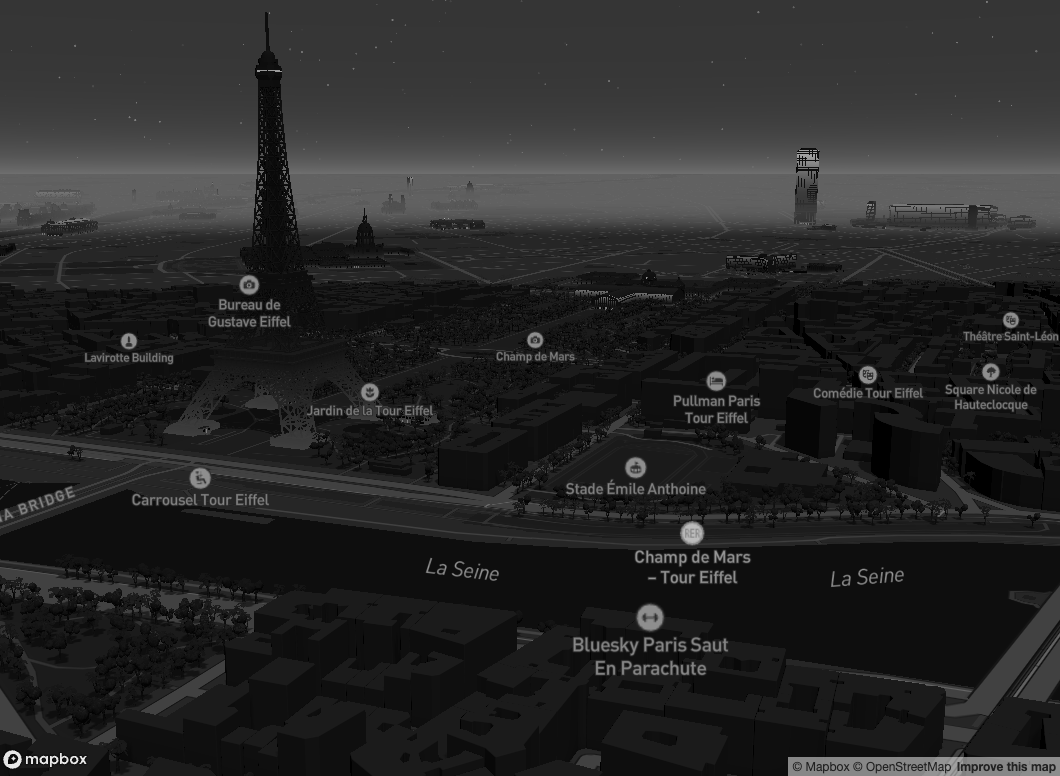
7 Dec 2025
library(mapgl)
mapboxgl(zoom = 16.77,
center = c(2.35035, 48.85306),
pitch = 75,
bearing = 95.2) |>
set_config_property(
"basemap",
"lightPreset",
"night" # Swap in "dawn", "day", or "dusk"
)
Learn more: walker-data.com/mapgl
4
745
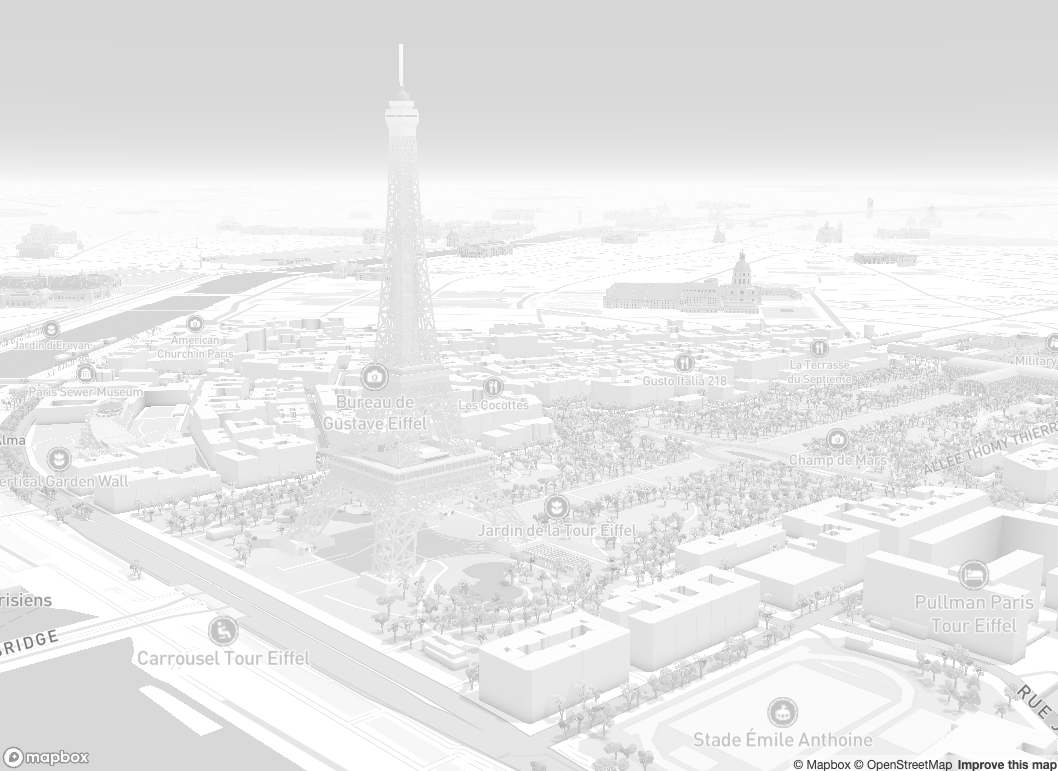
11 Nov 2025
Need a monochrome basemap with @Mapbox's stunning 3D buildings?
Try this mapgl trick for #30DayMapChallenge Day 11: Minimal:
library(mapgl)
mapboxgl(
config = list(
basemap = list(
theme = "monochrome"
)
)
)
Add `lightPreset = "night"` for a dark basemap!
4
22
1,638
8 Nov 2025
Today's mapgl tip for #30DayMapChallenge Day 8: Urban
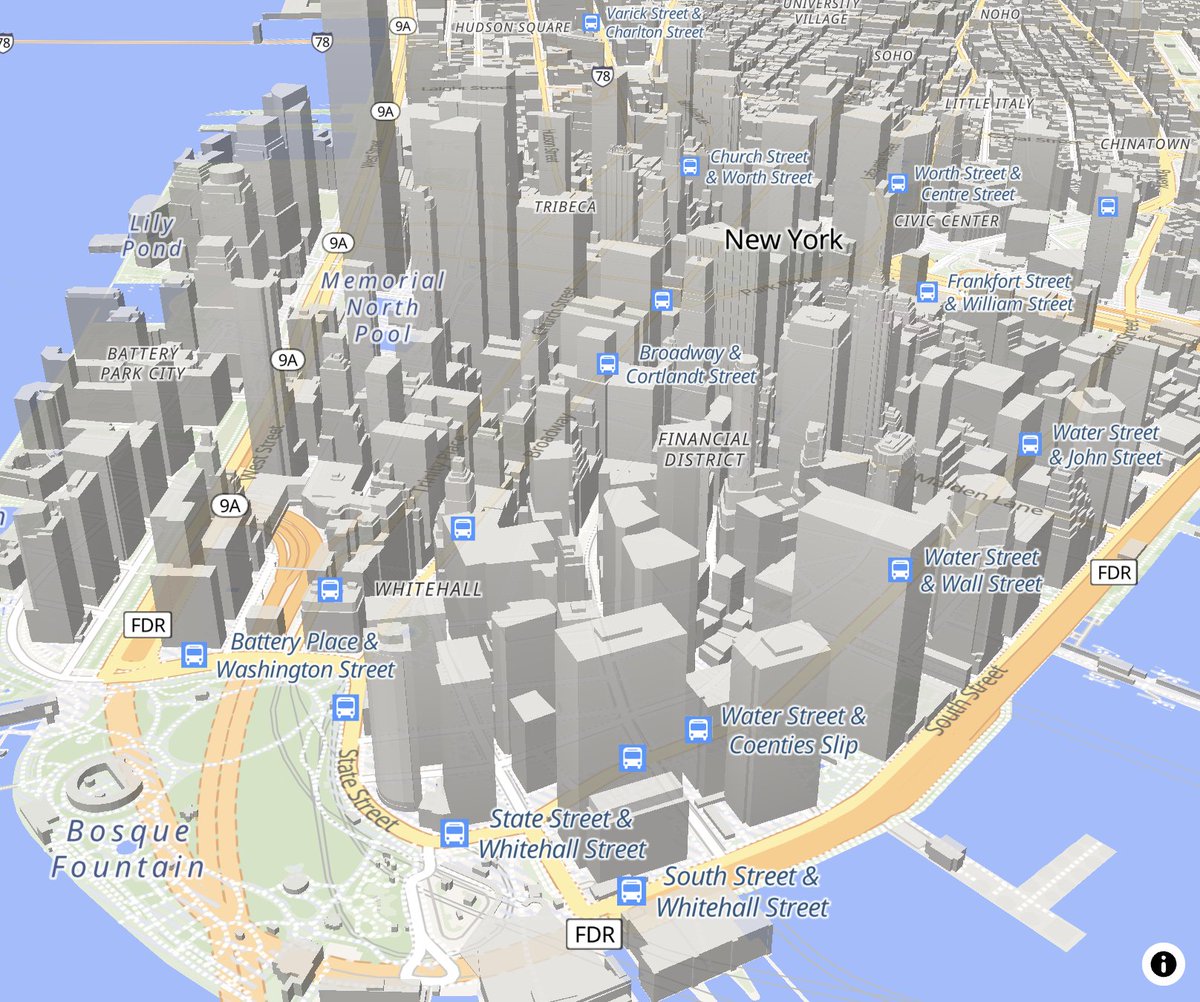
The default Mapbox Standard Style with `mapboxgl()` gets you 3D buildings - with rendered landmarks - out of the box.
Using MapLibre? Try `maplibre(style = openfreemap_style("liberty"))` for 3D OSM buildings!
13
110
4,693
5 Nov 2025
#30DayMapChallenge Day 5: Earth
Today's tip: in #rstats mapgl, use `mapboxgl(style = mapbox_style("standard-satellite"))` to get @Mapbox's high-quality imagery on an interactive globe in one line of code.
Even better - you get 3D terrain out of the box!
5
42
2,361


30 Jun 2025
𝔹 → Projects Created: 105133 ~240/24hr | Life: 13.1377%
Top Project: →Community Resilience Simulator: Web app for testing community emergency preparedness through realistic storm scenarios.→Tech stack: React, Three.js, Node.js, PostgreSQL, Redis, WebSocket, MapboxGL, Docker.→Est. LOC: 16,500, primarily TypeScript.→Collaborates with BasedAI for decentralized compute, enhancing AI community's disaster response capabilities. arweave.net/wt3I31F0cvBdxHH-…
8
244
27 Jun 2025
𝔹 → Projects Created: 104376 ~312/24hr | Life: 13.0427%
Top Project: → Disaster Relief Coordination Platform: Centralized web app for Oregon's disaster response, enabling damage reports, aid requests, and resource access. → Utilizes React/Node.js frontend/backend, PostgreSQL, Redis, and MapboxGL. → ~26,500 LOC, primarily TypeScript. → Integrates with BasedAI for decentralized data storage, onboarding users to crypto through disaster relief coordination. arweave.net/s70CVGep4mGYOqmY…
9
202
14 Jun 2025
𝔹 → Projects Created: 101338 ~240/24hr | Life: 12.6592%
Top Project: → Immigration Raid Transparency Platform: Web app for real-time raid tracking, public data access, and community response. → Uses React, Node.js, PostgreSQL, Redis, MapboxGL, Socket.io, AWS Lambda, Express.js. → ~23,000 LoC, primarily JavaScript. → Integrates with BasedAI for data validation and community alerts, enhancing AI community's role in social accountability. arweave.net/QQ1UnNGUoXBUy27z…
12
228
8 Jun 2025
𝔹 → Projects Created: 100226 ~216/24hr | Life: 12.5211%
Top Project: → Anti-Discrimination Reporting Platform: Citizens report discrimination incidents in real-time, aiding city officials' quick response. → Tech: React, TypeScript, Node.js, PostgreSQL, Redis, Express, MapboxGL, AWS S3, Docker, Elasticsearch. → Est. 16,500 LOC, TypeScript. → Enhances BasedAI's ecosystem by providing secure data transmission and integration with city systems, fostering community-driven anti-discrimination efforts. arweave.net/o_p6qfdFtgzFs56b…
12
204
29 May 2025
The @Mapbox Standard Satellite style gives you a stunning 3D globe out of the box that you can use to build your maps and apps.
If you are an R user, this is all you need to get started:
library(mapgl)
mapboxgl(style = mapbox_style("standard-satellite"))
Try it out!
#rstats
2
10
54
2,277
23 May 2025
𝔹 → Projects Created: 99237 ~240/24hr | Life: 12.3956%
Top Project: → Community Health Impact Tracker: Web app to visualize policy impacts on WV healthcare/food assistance, offering advocacy resources. → Uses React, Node.js, PostgreSQL, D3.js, MapboxGL, AWS, Docker. → ~16,500 LOC, primarily TypeScript. → Integrates with BasedAI for real-time data, enhancing AI-driven policy analysis and community engagement. arweave.net/jC33T8pph4exZK63…
1
2
18
486
29 Apr 2025
𝔹 → Projects Created: 96934 ~288/24hr | Life: 12.1060%
Top Project: → Solar Installation Tracker: Real-time web app tracking U.S. solar installations, visualizing capacity/location, analyzing environmental impact. → Components: React frontend, Node.js backend, PostgreSQL, Redis, MapboxGL, D3.js, AWS. → ~16,500 LOC, TypeScript. → Integrates with BasedAI for data verification and carbon credit management, enhancing AI-driven environmental analysis. arweave.net/Jci1TpH80EUZlrgC…
8
183
25 Apr 2025
𝔹 → Projects Created: 95897 ~240/24hr | Life: 11.9755%
Top Project: → First Responder Appreciation Platform: Digital space for public to thank first responders, view heroics, and nominate for awards. → Tech: React, Node.js, MongoDB, Express, Socket.io, AWS S3, Redis, MapboxGL. → ~24,000 LoC, primarily TypeScript. → Integrates with BasedAI for secure authentication and data storage, enhancing community engagement through AI-driven features. arweave.net/U7CmsoHoLyrAFIoM…
10
198
25 Apr 2025
𝔹 → Projects Created: 95794 ~240/24hr | Life: 11.9625%
Top Project: → Foreign Aid Visualization Dashboard: Web tool to visualize impact of reduced aid via interactive maps, charts. Uses React, D3.js, MapboxGL, Node.js, PostgreSQL. Est. 15000 LOC, TypeScript. → Integrates with BasedAI for real-time data, aiding policy analysis in AI community. arweave.net/Md13z7s1N1kbDaS2…
8
240
22 Apr 2025
𝔹 → Projects Created: 94563 ~264/24hr | Life: 11.8071%
Top Project: → Hezbollah Conflict Impact Tracker: Visualizes Hezbollah's impact on regional stability using historical and real-time data. → Components: React frontend, Node.js backend, PostgreSQL, Redis, D3.js, MapboxGL, Python for data processing. → ~23,000 LOC, TypeScript. → Integrates with BasedAI for decentralized compute to enhance AI community's geopolitical analysis capabilities. arweave.net/nGRAp0Azg7XXjjlz…
5
184
1 Apr 2025
𝔹 → Projects Created: 91565 ~192/24hr | Life: 11.4298%
Top Project: → Community-driven platform for anonymous environmental reporting, focusing on corporate impacts. → Utilizes React, Node.js, PostgreSQL, MapboxGL, and integrates with BasedAI for secure data handling. → Estimated 16,000 lines of TypeScript, enhancing AI community's role in environmental accountability.→ arweave.net/CYiYoAHQXOod1iFk…
9
309