
Jan 11
🏜️ Stats on the Portland Trail Blazers (19-20) and how we can win
🔧 Net Rating -2.4 (22nd)
🔧 Offensive Rating 114.9 (23rd)
🔧 Defensive Rating 117.3 (19th)
🔧 True Shooting 56.7% (24th)
🔧 Effective FG 52.5% (27th)
🔧 Assist Rate 61.1% (18th)
🔧 Turnover Rate 16.6% (30th)
🔧 Rebound Rate 50.5% (10th)
🔧 Def Rebound Rate 71.0% (29th)
🔧 Off Rebound Rate 30.8% (3rd)
🔧 Steal Rate 7.9% (22nd)
🔧 Block Rate 5.3% (16th)
🔧 Free Throw Rate 30.0 (4th)
🔧 3P Attempt Rate 45.8% (5th)
🗣️ The Knicks should attack Portland by pushing the pace against their 117.3 defensive rating (19th) and 16.6% turnover rate (30th), space the floor to exploit 56.7% TS (24th) and 52.5% eFG (27th), and crash the offensive glass versus their 30.8% ORR (3rd)
📊 How teams guard Portland top 3 Off threats
🔧 Deni Avdija: 661 (shot attempts)
🏜️ Helper 20.3% | Non-Contested 19.4% | POA 18.9% | Wing 13.3% | Mobile Big 10.9% | Chaser 9.8% | Anchor 4.4% | Low 3.0%
📉 Deni Avdija weaknesses (databallr.com/dashboard)
📉 Defensive DPM -0.5 (32nd percentile) — negative overall defensive impact
📉 Defensive FG Attempts Allowed 18 (24th percentile opponents shoot often vs him)
📉 Shots Allowed at the Rim 6.8 (24th percentile frequent rim attacks allowed)
📉 Rim FG% Differential -3.7% (40th percentile opponents finish better than expected)
📉 Stop Rate 1.7% (7th percentile rarely ends possessions)
📉 Steals 1.1 (20th percentile low ball disruption)
📉 Blocks 0.8 (27th percentile limited rim protection)
📉 Forced Turnovers vs Fouls -0.7 (17th percentile fouls more than he forces TOs)
📉 Scoring Turnover Rate 9.3% (28th percentile loses efficiency when pressured)
📉 Two-Point FG% 53.4% (35th percentile below-average finishing inside)
📉 Assist-Adjusted eFG 61.0 (22nd percentile passes don’t lead to efficient shots)
📉 Passes per Minute 2.3 (37th percentile limited playmaking volume)
📉 Defensive Rebound Rate 15.8% (68th percentile solid but not enough to offset defense)
🔧 Shaedon Sharpe: 632
🏜️ POA 21.0% | Non-Contested 18.8% | Helper 16.5% | Mobile Big 12.7% | Wing 11.6% | Chaser 10.4% | Anchor 5.4% | Low 3.6%
🔧 Toumani Camara: 428
🏜️ Helper 28.7% | POA 16.1% | Wing 14.5% | Non-Contested 11.4% | Mobile Big 11.2% | Chaser 9.8% | Low 4.2% | Anchor 4.0%
🗣️ Teams help off Deni Avdija 39.7% of the time (20.3% Helper, 19.4% Non-Contested), reflecting low on-ball pressure. The numbers justify it: -0.5 D-DPM (32%), -0.3 DRAPM, 18 DFGA, 6.8 rim attempts allowed, and a -3.7% rim diff, with a 1.7% Stop rate. He doesn’t create disruption (1.1 STL, 0.8 BLK) and under pressure his offense dips (53.4% 2P, 9.3% sTOV, 61.0 ASTEFG). Game plan: help off, attack him at the rim, and force him to defend actions.
#newyorkforever #snyk #ripcity #NBATwitter #NBAAnalytics #FilmRoom #nba #nyc #NY #NYKx #hoop #Analytics #ShotQuality #OnBallDefense #MatchupData #BasketballIQ #HoopsTwitter #DataBallr #AdvancedStats
1
3
987
26 Dec 2025
🧮 Who’s Guarding Who? 🏀📏 – Break down each player’s contested shots by position in the 1st 30 games (nbavisuals.com/team_breakdow…)
🗽 Knicks 21-9
📏 % shows which position is guarding each player 🏀 (Min 100 contest)
🗽 Jalen Brunson (554 contested shots)
G: 48.4% | F: 29.6% | C: 11.2% | Non-Contested: 10.8%
🗽 Karl-Anthony Towns (413)
C: 38.7% | F: 29.5% | G: 13.3% | Non-Contested: 18.4%
🗽 Mikal Bridges (373)
G: 40.8% | F: 36.2% | C: 10.2% | Non-Contested: 12.9%
🗽 Jordan Clarkson (244)
G: 50.8% | F: 30.7% | C: 5.7% | Non-Contested: 12.7%
🗽 Josh Hart (250)
F: 38.8% | G: 28.4% | C: 16.8% | Non-Contested: 16.0%
🗽 OG Anunoby (227)
F: 40.1% | G: 31.7% | C: 16.7% | Non-Contested: 11.5%
🗽 Miles McBride (181)
G: 57.5% | F: 22.7% | C: 11.0% | Non-Contested: 8.8%
🗽 Tyler Kolek (108)
G: 53.7% | F: 21.3% | C: 12.0% | Non-Contested: 13.0%
🗒️ Looking at contested shots, guards are the main defenders on Jalen Brunson 48.4% (F 29.6%, C 11.2%), Tyler Kolek 53.7% (F 21.3%, C 12.0%), and Miles McBride 57.5% (F 22.7%, C 11.0%). Forwards lead on Josh Hart 38.8% (G 28.4%, C 16.8%) and OG Anunoby 40.1% (G 31.7%, C 16.7%). Karl-Anthony Towns is mostly contested by centers 38.7% (F 29.5%, G 13.3%), Mikal Bridges by guards 40.8% (F 36.2%, Non 12.9%), and Jordan Clarkson by guards 50.8% (F 30.7%, Non 12.7%). Secondary defenders from different positions show cross-matching to exploit mismatches and disrupt spacing.
Here’s Mike Brown Post Game interview his exchange with Kolek last game which he loved⏬⏬⏬⏬⏬⏬⏬
#NBA #NBAShots #NBAnalytics #NBAStats #Knicks #NYK #SNYK #NYKx #NewYorkKnicks #NewYorkForever #ShotMap #PlayerTracking #BasketballAnalytics #NBAInsights #ContestedShots #MatchupData #KnicksAnalytics
1
3
11
1,782

28 May 2025
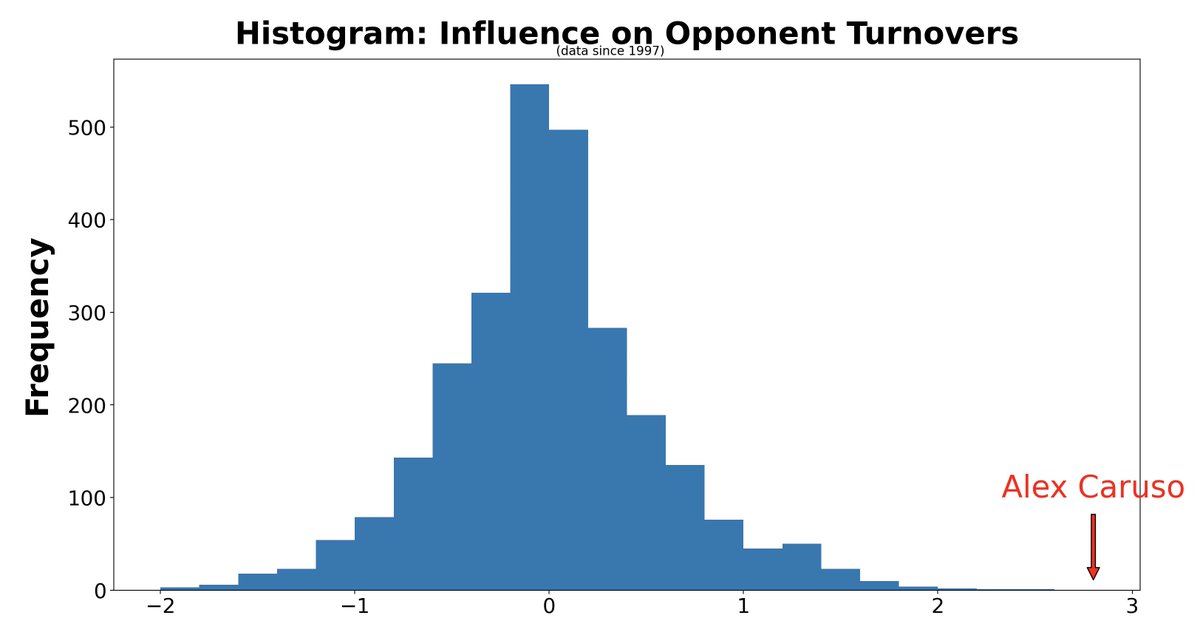
In a 29-year sample of matchupdata, Caruso is head-and-shoulders above everyone else when it comes to forcing opponent turnovers
Where does he rank, overall, among the best defenders since 1997?
roycewebb.com/p/alex-caruso-…
4
4
21
2,638
2 Feb 2024
This led to the following alphas:
Players Off: 2000
Players Def: 8000
Coaches Off: 8000
Coaches Def: 2000
Data: 1997-2024 matchupdata
Possession outcome adjusted for age and rubber-band-effect
3
6
2,222
9 May 2020
What I calculated for these seasons was using simulated matchupdata based off of game MP and average playing time distribution according to score etc
This is using actual matchupdata I believe, but slightly different algorithms, generally
2
16 Jan 2016
@_rahul24 I think you can buy "matchupdata" here nbastuffer.com/ but I can't say anything about the quality
8 Sep 2014
@bbstats That's not actually RPM. Since we have no PBP for that year it's mostly SPM with a dash of RAPM from "fake" matchupdata
1
1