
jack-anorak--chris boulos retweeted

Jun 12
One of the things I'm most looking forward to in the new protocol is our new MetaRouter
It'll allow anyone to perform one-click zaps and LP bridging. Better UX is coming all!
And as with all our products, this will be fully onchain and trustless — too many choose the easy route and rely on offchain infrastructure to deliver you features like these
3
2
30
1,066

Jun 8
McKinsey projects that agentic commerce where AI agents autonomously shop, negotiate, and transact on behalf of consumers and businesses will orchestrate $3 trillion to $5 trillion in global transaction volume by 2030, with $1 trillion isolated to U.S. B2C retail alone. (Source: MetaRouter/McKinsey Analysis)
$eth $bmnr $sbet
1
16

May 7
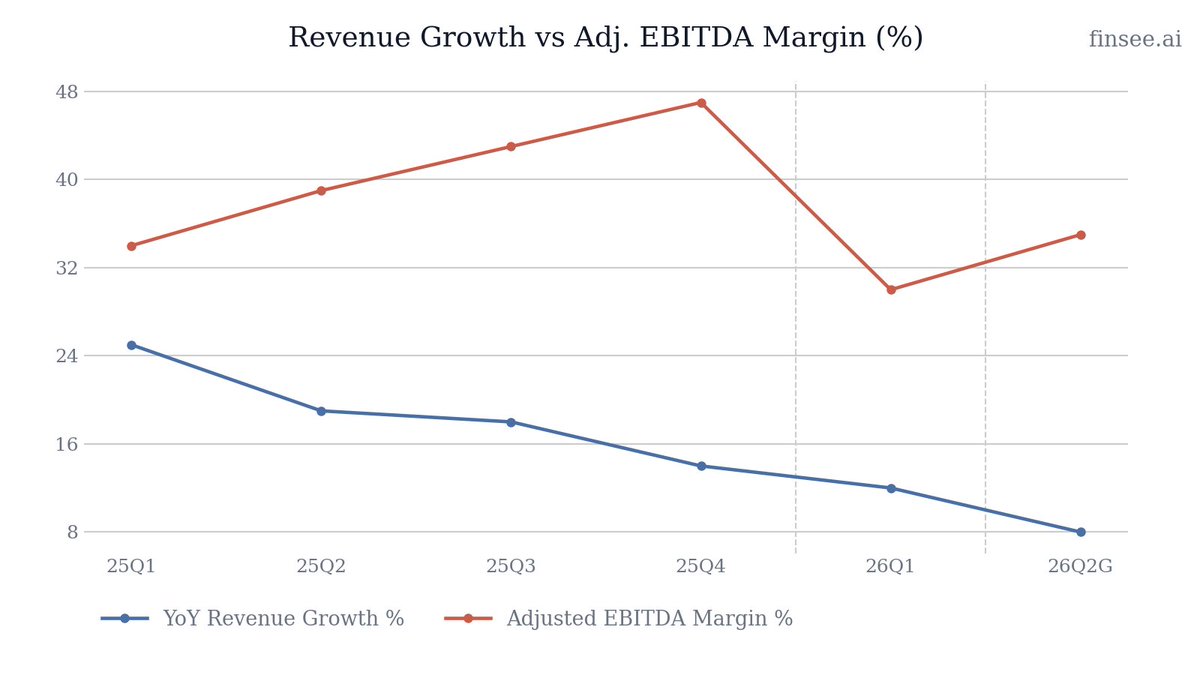
$TTD Q1 2026 earnings: Growth Decelerates as AI Narrative Outpaces Financial Reality
The Trade Desk delivered a sobering Q1. While management praised strategic upgrades and AI innovations, the numbers paint a picture of a business rapidly cooling off. Revenue grew 12% YoY to $689 million, marking the fifth consecutive quarter of top-line deceleration. More concerning is the Q2 guidance: 'at least $750 million' implies a drop to just 8% YoY growth. Profitability is also reversing: Adjusted EBITDA margin shrank to 30% from 34%, and a spike in the tax rate drove Net Income down 21% YoY. The gap between the company's visionary AI rhetoric and its decelerating financial engine is becoming impossible to ignore.
Full article with charts - link in bio
🐂 𝐁𝐮𝐥𝐥 𝐂𝐚𝐬𝐞
• 𝐒𝐭𝐢𝐜𝐤𝐲 𝐄𝐜𝐨𝐬𝐲𝐬𝐭𝐞𝐦 — Customer retention remained over 95% for over a decade. Advertisers aren't leaving; they are simply slowing their spend growth in a challenging macro environment.
• 𝐔𝐧𝐥𝐨𝐜𝐤𝐢𝐧𝐠 𝐍𝐞𝐰 𝐁𝐮𝐝𝐠𝐞𝐭𝐬 — Integrations with LinkedIn for B2B Connected TV (CTV) activation and Dollar General for retail media show TTD is successfully expanding its addressable market beyond traditional consumer brands.
🐻 𝐁𝐞𝐚𝐫 𝐂𝐚𝐬𝐞
• 𝐒𝐮𝐬𝐭𝐚𝐢𝐧𝐞𝐝 𝐃𝐞𝐜𝐞𝐥𝐞𝐫𝐚𝐭𝐢𝐨𝐧 — Growth has stepped down sequentially for five straight quarters (25% to 8% implied). The hyper-growth narrative is breaking as the company approaches single-digit expansion.
• 𝐌𝐚𝐫𝐠𝐢𝐧 𝐂𝐨𝐦𝐩𝐫𝐞𝐬𝐬𝐢𝐨𝐧 — Adjusted EBITDA and Net Income margins are both contracting. Operating expenses, particularly direct platform costs, are rising faster than revenue, destroying operating leverage.
⚖️ 𝐕𝐞𝐫𝐝𝐢𝐜𝐭: 🔴
Bearish. The persistent deceleration in revenue growth combined with shrinking margins fundamentally challenges The Trade Desk's premium valuation. AI product launches are encouraging but are not currently translating into top-line acceleration.
𝐊𝐞𝐲 𝐓𝐡𝐞𝐦𝐞𝐬
🔴🔴 𝐓𝐨𝐩-𝐋𝐢𝐧𝐞 𝐆𝐫𝐨𝐰𝐭𝐡 𝐢𝐬 𝐃𝐞𝐜𝐞𝐥𝐞𝐫𝐚𝐭𝐢𝐧𝐠 𝐑𝐚𝐩𝐢𝐝𝐥𝐲 [NEW]
The most critical metric for TTD—revenue growth—is failing to hold up. After printing 25% growth a year ago, the rate has decelerated in every subsequent quarter: 19% -> 18% -> 14% -> 12% today. The Q2 guidance implies a further drop to roughly 8%. Management previously cited macro headwinds in CPG and Auto verticals, but a drop to single digits suggests deeper structural friction or market saturation.
🔴 𝐂𝐨𝐬𝐭 𝐨𝐟 𝐑𝐞𝐯𝐞𝐧𝐮𝐞 𝐢𝐬 𝐎𝐮𝐭𝐩𝐚𝐜𝐢𝐧𝐠 𝐒𝐚𝐥𝐞𝐬 [NEW]
Platform operations (Cost of Revenue) surged 27% YoY to $182M. Because this grew more than twice as fast as revenue ( 12%), gross margins are compressing. TTD is paying significantly more to operate its platform per dollar of revenue generated, which inherently limits bottom-line expansion.
🟢 𝐀𝐠𝐞𝐧𝐭𝐢𝐜 𝐀𝐈 𝐑𝐨𝐥𝐥𝐨𝐮𝐭 𝐆𝐚𝐢𝐧𝐢𝐧𝐠 𝐓𝐫𝐚𝐜𝐭𝐢𝐨𝐧
The rollout of 'Koa Agents' marks a shift toward agentic AI capabilities for media planning and optimization. Stagwell signing on as the first partner validates the demand for automated, objective tools that reduce the manual workload for agency buyers.
🟢 𝐂𝐫𝐚𝐜𝐤𝐢𝐧𝐠 𝐭𝐡𝐞 𝐁𝟐𝐁 𝐚𝐧𝐝 𝐋𝐢𝐯𝐞 𝐒𝐩𝐨𝐫𝐭𝐬 𝐌𝐚𝐫𝐤𝐞𝐭𝐬 [NEW]
TTD secured two major strategic wins: LinkedIn selected TTD as its first DSP partner for B2B data activation on Connected TV, and Paramount announced live, in-game programmatic buying for marquee sporting events. These are premium, high-CPM environments that competitors struggle to access objectively.
⚪ 𝐔𝐧𝐢𝐟𝐢𝐞𝐝 𝐈𝐃 𝟐.𝟎 (𝐔𝐈𝐃𝟐) 𝐀𝐝𝐨𝐩𝐭𝐢𝐨𝐧 𝐑𝐞𝐚𝐜𝐡𝐢𝐧𝐠 𝐂𝐫𝐢𝐭𝐢𝐜𝐚𝐥 𝐌𝐚𝐬𝐬
The industry's shift away from third-party cookies continues to benefit TTD. The integration of MetaRouter to synchronize UID2 and conversion events in real-time strengthens the connection between consented identity and activation, preserving ad relevance.
🔴 𝐁𝐞𝐥𝐨𝐰-𝐭𝐡𝐞-𝐋𝐢𝐧𝐞 𝐇𝐞𝐚𝐝𝐰𝐢𝐧𝐝𝐬 𝐂𝐫𝐮𝐬𝐡 𝐍𝐞𝐭 𝐈𝐧𝐜𝐨𝐦𝐞 [NEW]
Despite a 22% increase in Operating Income, GAAP Net Income reversed, falling 21% YoY to $40M. This was driven by two major non-operating items: Interest income dropped by $9M as cash yields normalized, and the provision for income taxes spiked 55% to $39M. The effective tax rate nearly reached 50% in the quarter.
𝐎𝐭𝐡𝐞𝐫 𝐊𝐏𝐈𝐬
𝐒𝐭𝐨𝐜𝐤-𝐁𝐚𝐬𝐞𝐝 𝐂𝐨𝐦𝐩𝐞𝐧𝐬𝐚𝐭𝐢𝐨𝐧 (𝟐𝟔𝐐𝟏): $109.0 million
SBC remains a massive expense, consuming 15.8% of total revenue. While it appears to have declined from $128.3M last year, the entirety of the drop is due to a scheduled reduction in the CEO's long-term performance grant (down from $24M to $5M). Core employee SBC actually increased.
𝐂𝐚𝐬𝐡 𝐔𝐬𝐞𝐝 𝐢𝐧 𝐒𝐡𝐚𝐫𝐞 𝐑𝐞𝐩𝐮𝐫𝐜𝐡𝐚𝐬𝐞𝐬 (𝟐𝟔𝐐𝟏): $164 million
The company continues to use cash to offset heavy dilution from SBC. They have $327 million remaining on their authorization. However, with free cash flow generation historically tight relative to SBC levels, the ability to meaningfully shrink the float remains constrained.
𝐆𝐮𝐢𝐝𝐚𝐧𝐜𝐞
𝐐𝟐 𝟐𝟎𝟐𝟔 𝐑𝐞𝐯𝐞𝐧𝐮𝐞: At least $750 million
Decelerating. The implied YoY growth rate is just 8.1% (compared to $694M in 25Q2). This is a severe step down from the 12% growth achieved in 26Q1 and suggests the macro weakness in verticals like CPG and Auto is intensifying, or competitive pressures are mounting.
𝐐𝟐 𝟐𝟎𝟐𝟔 𝐀𝐝𝐣𝐮𝐬𝐭𝐞𝐝 𝐄𝐁𝐈𝐓𝐃𝐀: Approximately $260 million
Reversing. This figure is lower than the $271 million generated in the same quarter last year, implying a YoY contraction of roughly 4%. The implied EBITDA margin of 34.7% marks a nearly 450-basis-point compression versus 25Q2's 39.0% margin. The company is sacrificing profitability to chase slowing growth.
𝐊𝐞𝐲 𝐐𝐮𝐞𝐬𝐭𝐢𝐨𝐧𝐬
𝐂𝐨𝐬𝐭 𝐨𝐟 𝐑𝐞𝐯𝐞𝐧𝐮𝐞 𝐄𝐱𝐩𝐚𝐧𝐬𝐢𝐨𝐧
Platform operations expense grew 27% YoY, significantly outpacing the 12% revenue growth. What specific infrastructure or data costs are driving this margin compression, and when will we see operating leverage return?
𝐒𝐢𝐧𝐠𝐥𝐞-𝐃𝐢𝐠𝐢𝐭 𝐆𝐫𝐨𝐰𝐭𝐡 𝐇𝐨𝐫𝐢𝐳𝐨𝐧
Q2 guidance implies growth slowing to 8%. How much of this is driven by the previously mentioned macro weakness in CPG/Auto versus structural market saturation or increased competitive discounting from walled gardens?
𝐓𝐚𝐱 𝐑𝐚𝐭𝐞 𝐍𝐨𝐫𝐦𝐚𝐥𝐢𝐳𝐚𝐭𝐢𝐨𝐧
The provision for income taxes jumped 55% despite lower net income, resulting in an effective tax rate near 50%. What drove this spike, and what is the expected normalized tax rate for the remainder of FY26?
2
1,711

Apr 20
0. Cross-chain swaps
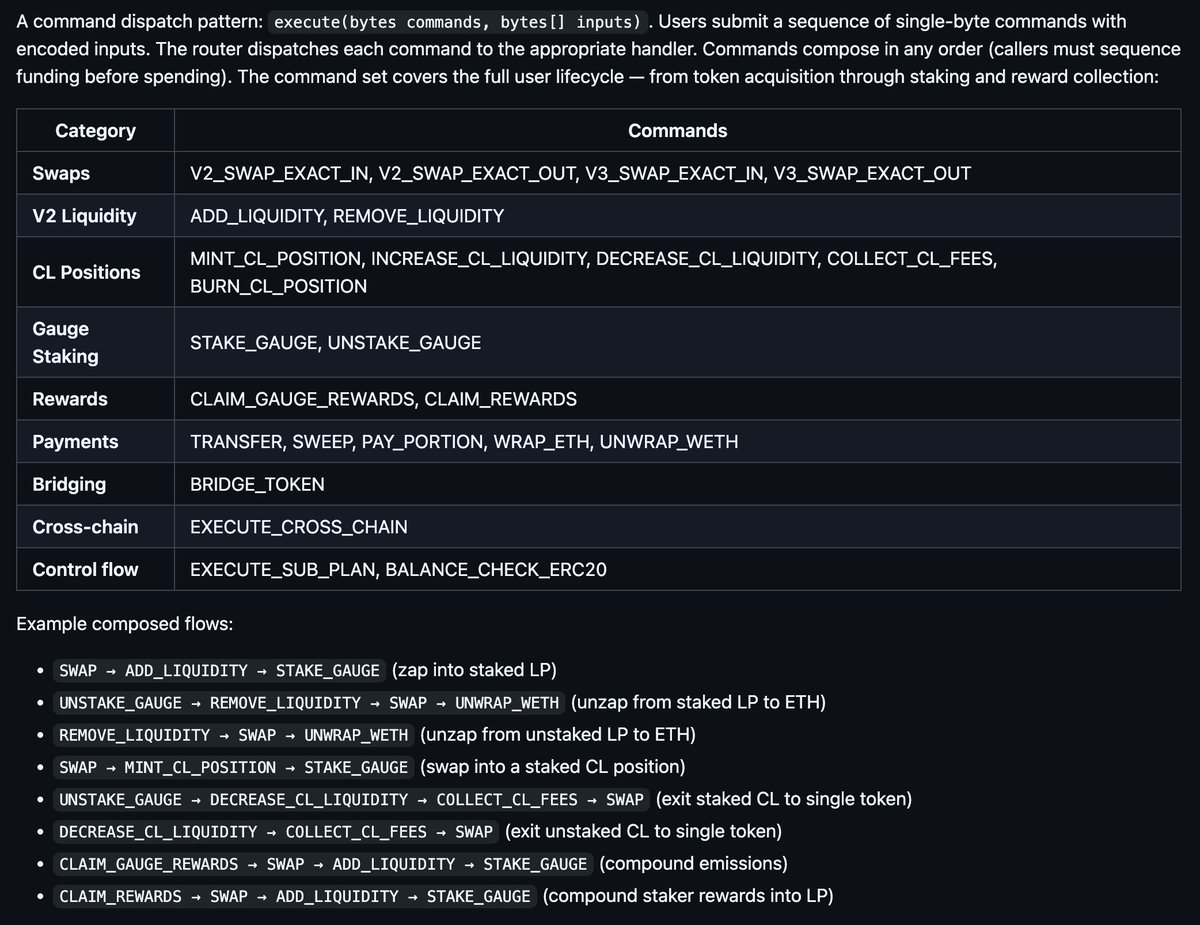
While the 6 synchronization cases handle the Aerodrome sensitive internal math, what happens when a user wants to bridge, swap across the supported chains? To protect the protocol from chaotic, high-frequency DeFi traffic, MetaDEX 3.0 isolates user actions into a completely separate execution layer:
A. The MetaRouter & HypERC20
When you execute a cross-chain Zap, you are not interacting with the Voter or LeafVoter; you are using the MetaRouter. It utilizes the HypERC20 standard to securely transport physical liquid assets (like native $AERO or Warp-Routed USDC) across chains. No more clunky, fragmented wrapped tokens.
B. Hyperlane ICA (Ghost Wallets)
Once the assets cross the bridge, Hyperlane ICAs take over. Your wallet on Base acts as a remote "ghost wallet" on the destination chain. It receives the tokens and executes a massive checklist—swap, add liquidity, stake in a gauge, and sweep dust back to you—all from a single click on Base.
C. The Execution Firewall
Why build two entirely separate cross-chain systems? Unbreakable security. By physically isolating the MetaRouter from the Protocol State Layer, Aerodrome ensures that no matter how complex a user's cross-chain swap sequence is, it can never accidentally interfere with or manipulate the core tokenomics and emission math of the DEX.
1
2
98

2 Dec 2025
It's here! The full, ungated 127-page "Martech for 2026" report.
No form to fill. No "leave a comment" arm twisting. You can download the full PDF directly here. If you WANT to like, repost, or leave a comment, it would be greatly appreciated — but not required.
content.martechday.com/marte…
There are 7 major subjects we cover to prepare you for 2026:
1. The hype-free reality of SaaS & AI in martech
2. 3 types of AI agents in marketing (only one is disruptive)
3. Context engineering in marketing & data sources in use
4. A spectrum of deterministic & non-deterministic automation
5. Practical application of "vibe coding" in marketing
6. "The Factory" vs. "The Laboratory" in martech management
7. Value engineering > GTM engineering in Marketing Ops 3.0
It includes all the latest data from our AI & Data in Marketing survey conducted a couple of months ago. No techno-jargon. Just plain language explanations and helpful visual illustrations.
For a report of this depth and rigor, we could easily charge $1,000 or more. Instead, we worked with 7 sponsors to support the months of work we spent on this to be able to share it with you at no cost.
Our sponsors had no input or review of our editorial content — they just saw the report for the first time yesterday. Instead, we conducted a series of interviews with leaders from each of them to dig into their perspective on these subjects, which we included as separate chapters in the report:
GrowthLoop: Mind the Gap: Why AI Success Starts with Data
Hightouch: AI Agents and the Future of Marketing Workflows
Intuit Mailchimp: AI and the Mid-Market Marketing Revolution
MetaRouter: AI and the First-Mile in Digital Experiences
Progress: The Human Dimensions of AI in Martech
SAS: With AI, More Is Not Better — Better Is Better
Treasure Data: The Future of AI and CDPs in Marketing
Frans Riemersma and I learned a ton working on this. We hope it's genuinely useful for you, and we'd love to hear any feedback you have for us.
#martech #marketing #AI
6
8
626
1 Dec 2025
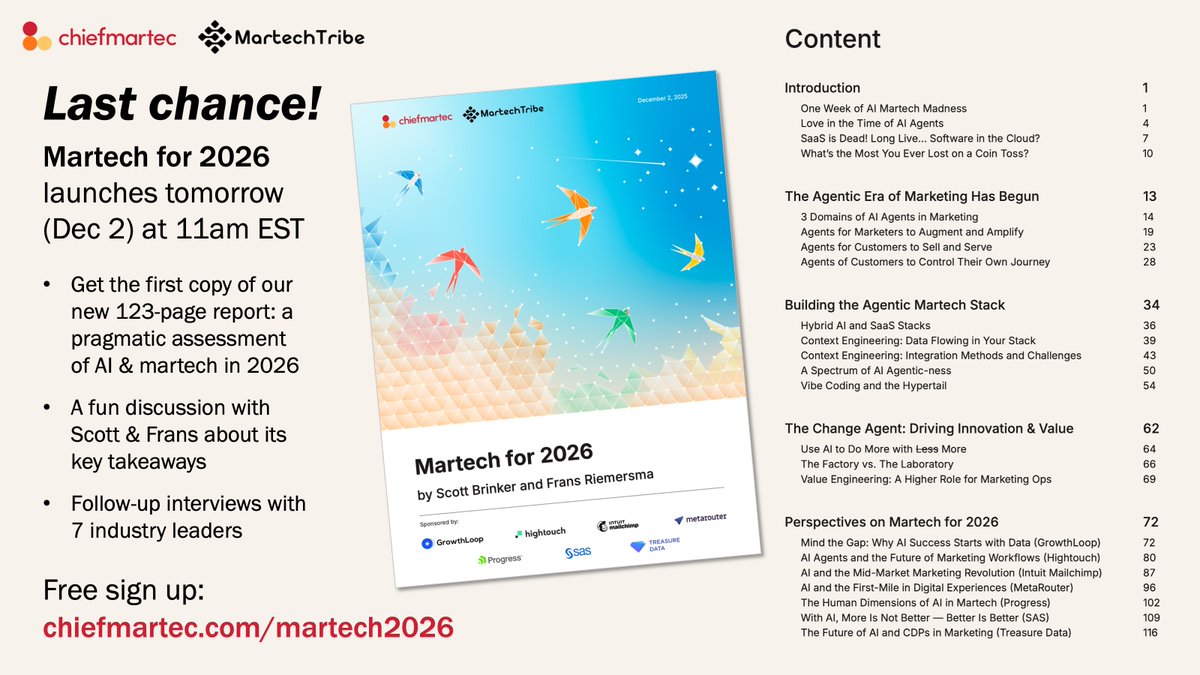
After months of research and interviews, tomorrow (Dec 2) is the big release of our new 123-page MARTECH FOR 2026 report. 🚀
There's still time to sign up to get priority access to the report at 11am EST and have the option to tune into a lively discussion with Frans and me discussing a our most interesting findings. 🤔
(If you sign up before our launch, you can also catch our presentation on-demand anytime in December.)
Later in the afternoon, we'll have follow-up interviews with executives and experts from our 7 sponsors — GrowthLoop, Hightouch, Intuit Mailchimp, MetaRouter, Progress, SAS, and Treasure Data — to get their take on these trends and hear what they expect the New Year will bring. No sales pitches. Just real conversations.
(Their support has made it possible for us to distribute all of this for free to you.) 🙏
It's never been a more exciting time to be in #marketing and #martech. Come join us tomorrow and let's start our 2026 adventures together! 🙌
chiefmartec.com/martech2026
1
3
438
28 Oct 2025
Our epic new "Martech for 2026" report is almost ready! 🥁
To be the first to get a copy, sign up for the free online seminar that me and Frans Riemersma will host on Tuesday, December 2:
martechday.registration.gold…
You can catch us live or on-demand. Either way, you'll have access to our full 100 page report the moment it ships.
In a jam-packed, hour-long presentation, we'll walk through our latest #AI and #martech research to distill the key trends, technologies, and operational frameworks that we believe are most relevant for marketers headed into 2026.
No fluff. No hype. No far-off futuristic fulminations.
Just the real deal of what's happening in marketing tech stacks and the martech industry as we prepare for the New Year. We'll do an especially deep dive on 3 kinds of AI agents that are reshaping marketing and digital customer experience:
➡️ Agents marketers use behind-the-scenes for production & analysis
➡️ Agents marketers deploy to engage directly with customers
➡️ Agents that customers are using independently to shape their buyer's journey
How are these agents being implemented? We'll share the full results from our AI & Data in Marketing survey (thank you to all who participated!). You'll learn which agent use cases are scaling and which ones are emerging. You'll learn what data is being piped into them for "context engineering" and the latest stats on MCP adoption.
Want the real scoop on what AI agents are doing to martech SaaS? We've got the ground truth on that too — and we honestly found it rather surprising.
There's so much more that we'll cover in our hour-long presentation and the accompanying report. I hope you'll join us! 🙌
Shout-out to our sponsors GrowthLoop, Hightouch, Intuit Mailchimp, MetaRouter, Progress, SAS, and Treasure Data — each of whom we'll interview for their POV after our keynote presentation. No sales pitches. Candid discussion with their product and marketing leaders on how AI is changing their world.
Sign up now to receive the access link for the event and report and have a reminder automatically on your calendar.
7
366

This week in #MarTech:
@semrush expands its C-suite
@cloudinary tackles “AI-slop” with scalable image tech
@MetaRouter & @VantageAppMkt unlock retail media data
@doubleverify reshapes leadership
@klaviyo launches AI-first CRM agents
#AIInnovation #RetailMedia #MarketingTech
2
62
@MetaRouter and Vantage partner to unlock first-party data value for retail media, enabling enhanced customer targeting and revenue optimization
Details: talkcmo.com/news/metarouter-…
#RetailMedia #FirstPartyData #MetaRouter #Vantage #DataActivation #Retail #CustomerData
2
16
9 Sep 2025
Hey, #martech and #AI friends, here's a big question for you:
How is "context engineering" — the data and prompts being dynamically fed into AI apps, agents, and agentic workflows — actually working in marketing today? ✨
Please help me and Frans Riemersma answer that in this survey. Will share the aggregate results and our analysis for free with everyone as part of our upcoming Martech for 2026 report. 🙏
surveymonkey.com/r/context-e…
For your participation, you will receive:
1. Our deepest gratitude and the gratitude of your peers.
2. The OPTION of a named credit in our report. (You can choose to remain completely anonymous if you prefer, which is the default.)
3. The OPTION to be in a drawing for a 30-minute private consulting session or public interview with me and Frans. (We'll select one participant at random for this.)
Take a look at the survey questions, and we think you'll agree, it would be SUPER INTERESTING to see these results. If you agree, please weigh in with your answers. Karmically, you will attract others to respond too. (Especially if you nudge karma by commenting and reposting this. 😀 )
Thank you for contributing to the #martech community! ❤️
(Tagging GrowthLoop, Hightouch, Intuit Mailchimp, MetaRouter, Progress, SAS, and Treasure Data, who are our wonderful sponsors for the Martech for 2026 report.)

1
3
511

31 Aug 2025
how does it work under the hood?
there are 3 key pieces:
• MetaRouter → enables one-click, gasless native swaps.
• Algebra Integral Pools → custom AMM tech for higher capital efficiency.
• ve(3,3) emissions → governance-controlled liquidity incentives.
1
3
27

29 Aug 2025
How to use Beam, easy steps
➜ Go to app.beamdex.xyz
➜ Connect a wallet: use Metamask for EVM chains or Phantom for Solana. Keep $ZETA on ZetaChain for gas.
➜ Swap: pick tokens, let MetaRouter find the route, sign, and confirm. One click, cross-chain settlement.
1
8
193
29 Aug 2025
➠ MetaRouter: Beam’s routing engine picks the cheapest, lowest-slippage path by combining internal pools and external routes into a single swap.
Let's now look at Beam features…
1
8
91

19 Aug 2025
What impressed me most was how smooth swaps felt.
I hit swap → Beamdex’s MetaRouter kicked in.
It’s like a GPS for trades: it finds the fastest & cheapest route across chains, then delivers your tokens in one go.
No extra steps. Just click and it’s done.
1
18
87

6 Aug 2025
📣 New Blog Post! Read the full article: hubs.li/Q03By4Kl0
#DataInfrastructure #PrivacyFirst #ServerSideTracking #DataQuality #CDI #MetaRouter
2
2
44

30 Jul 2025
Key Components at a Glance:
1. Sentinel AI: Dynamically adjusts fees based on market volatility to prevent liquidation and maintain stability.
2. MetaRouter: Optimizes execution by routing trades across chains and liquidity sources. @liqfinity 👇👇👇👇
1
2
58

28 Jun 2025
@Calderaxyz Metalayer introduces the MetaRouter Widget, a React component that simplifies cross-chain token bridging, enabling seamless any-to-any swaps with composable routes.
#ADDAxEST

1
5
5
21