
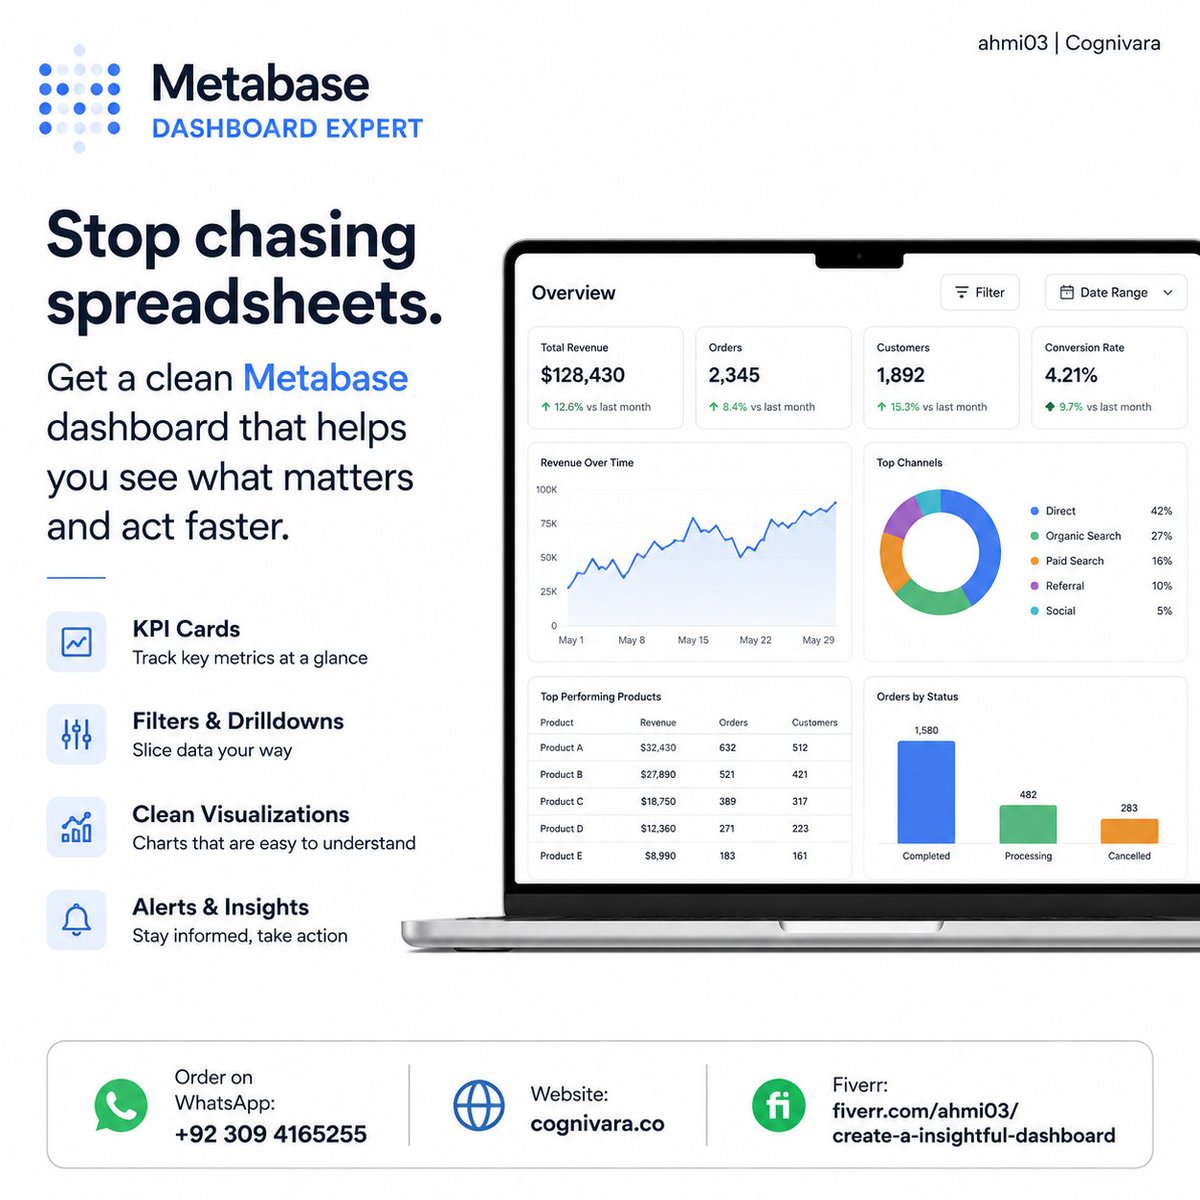
Stop chasing spreadsheets. Get a clean Metabase dashboard with KPI cards, filters, charts, and faster business visibility. #BI
Order on
WA: 92 309 4165255
cognivara.co
Fiverr: fiverr.com/ahmi03/create-a-i…
27

Back in 2017, when I was an analyst, I remember spending almost two full days building one beautiful chart.
It showed accumulated revenue for the current month, a projection until month-end, and the previous month for comparison — basically, whether we were growing fast enough, shown in the nicest way possible.
It took two days because I had to learn JS, since standard tools didn’t support it.
Yesterday, I built exactly the same thing with Codex and Metabase.
It took 10 minutes.
Pure relief after that old JS struggle.
Btw, @metabase, I’m not sure why dashboard creation isn’t included in the MCP. From my perspective, it’s even more important than querying data, because building dashboards is usually the most annoying part.
14


Updated Post: 7 Steps to Easily Configure OpenLiteSpeed as a Reverse Proxy for Metabase
#Cloud #DedicatedHosting #Guides #VPS
blog.radwebhosting.com/confi…
ALT How to Configure OpenLiteSpeed as a Reverse Proxy for Metabase
4


Tom retweeted

I am dying to work at Metabase 🙂😎. I know I'll learn a lot that I don't yet know.
Awesome product 👍🏼 So many verticals.
2
1
136

“A mineração do futuro nasce em Itabira”, afirma presidente do Metabase durante apresentação da Usina Modelo Conceição II itabiraonline.com.br/2026/06…
2

الـ Stack الكامل اللي أوصيكم فيه :
✓ SQL أساس كل شيء، لا يمكن تجاوزه أبداً
✓ Python Polars .. للتحليل السريع والتحويلات
✓ Power BI أو Metabase .. للتقارير التنفيذية
✓ Git .. لأن تحليلك كود، والكود يحتاج version control
✓ ChatGPT / Claude .. لتسريع العمل بـ ٣٠٠٪
1
49
الأدوات التي يتجاهلها الجميع لكنها تغير مسار العمل :
-DuckDB و SQL على ملفات CSV بسرعة جنونية، بدون قاعدة بيانات
-Polars أسرع من Pandas بـ ١٠-٥٠ مرة، كل اللي استخدمه انبهر فيه
- Metabase BI مجاني يبهر المدراء بدون Tableau اللي يساوي آلاف
-Observable تصويرات تفاعلية بدون خادم
1
1
56

💼 Developer Advocate at Metabase
📍 Remote (World Wide / US)
💰 $135,000 - $190,000 per year
Apply: skillcareerhub.com/jobs/be2c…
#Jobs #Hiring #JobSearch
6
312

Jun 11
As a former data analyst, there is no way I could have explored a dataset, identified trends, built a dashboard, and delivered a TLDR in 5 minutes.
@claudeai Fable 5 just did using the @metabase MCP server and layoffs.fyi data.
2
2
441

📊 Set up Metabase on Windows with Docker for stunning data visualizations! 🚀
buff.ly/AY0PbLe
#Metabase #DataVisualization #BusinessIntelligence #DataAnalysis #100DaysOfCode

14

Jun 11
帮客户部署开源项目,也能轻松过万。
很多人以为靠开源赚钱,必须自己开发 SaaS。
但其实还有一种更现实的方式:代部署。
开源项目本身免费,但部署、配置、上线、备份、维护、业务落地,都不免费。
很多客户不是不知道这些工具,而是不会部署、不会配置服务器、不会绑定域名、不会配置数据库和 HTTPS。
你要做的,就是帮他们把开源项目跑起来,配置好,交付一个能直接用的系统。
我整理了 8 个适合做代部署服务的开源项目:
1. n8n
GitHub:github.com/n8n-io/n8n
部署文档:docs.n8n.io/hosting/installa…
n8n 是一个自动化工作流工具,可以连接表单、邮件、CRM、数据库、Slack、Telegram 等工具。
赚钱方式:帮客户部署 n8n,再帮他搭自动化流程。
比如:
客户提交表单后自动进 CRM,付款后自动发邮件,新线索自动通知销售。
客户买的不是 n8n。
客户买的是“少做重复工作”。
2. Twenty
GitHub:github.com/twentyhq/twenty
部署文档:docs.twenty.com/developers/s…
Twenty 是一个开源 CRM,可以理解为 Salesforce 的开源替代品。
赚钱方式:帮小团队部署自己的 CRM,再根据业务配置字段、销售流程、客户管理页面。
适合客户:
房产中介、招聘公司、咨询公司、B2B 销售团队。
很多小团队不需要复杂系统。
他们只想要一个“刚好适合自己业务流程”的 CRM。
3. Plane
GitHub:github.com/makeplane/plane
部署文档:developers.plane.so/self-hos…
Plane 是一个开源项目管理工具,可以替代 Jira、Linear、ClickUp。
赚钱方式:帮团队部署私有项目管理系统,配置成员、项目、权限、通知和备份。
适合客户:
外包团队、软件公司、远程团队、对数据隐私敏感的公司。
他们要的不是项目管理工具。
而是一个团队可以直接协作的系统。
4. Dub
GitHub:github.com/dubinc/dub
部署文档:dub.co/docs/self-hosting
Dub 是一个开源短链和链接归因平台。
赚钱方式:帮创作者、独立站、newsletter、affiliate 团队部署自己的链接追踪系统。
客户真正需要的不是短链接。
而是知道:
哪个链接带来了点击,哪个链接带来了转化,哪个渠道真的在赚钱。
离钱越近,越容易收费。
5. Medusa
GitHub:github.com/medusajs/medusa
部署文档:docs.medusajs.com/learn/depl…
Medusa 是一个开源电商基础设施。
赚钱方式:帮品牌方部署电商后端、管理后台、商品系统、订单系统、支付和物流配置。
适合做:
B2B 商城、订阅制商店、多供应商 marketplace、品牌独立站后台。
不要想着做下一个 Shopify。
更现实的是:帮某个小众行业部署一个刚好够用的电商系统。
6. Metabase
GitHub:github.com/metabase/metabase
部署文档:metabase.com/docs/latest/ins…
Metabase 是一个开源 BI 和数据看板工具。
赚钱方式:帮公司部署 Metabase,连接数据库,然后做销售看板、收入看板、用户增长看板、广告投放看板。
很多公司有数据,但没人帮他们看懂数据。
所以你卖的不是部署。
而是“让老板每天打开一个页面,就知道业务怎么样”。
7. Supabase
GitHub:github.com/supabase/supabase
部署文档:supabase.com/docs/guides/sel…
Supabase 是一个开源 Firebase 替代品,提供数据库、认证、存储、API 等能力。
赚钱方式:帮客户配置 Supabase,设计数据库表,设置 Auth、Storage、RLS 权限和 API。
适合客户:
独立开发者、小型 SaaS、内部工具团队、AI 应用开发者。
很多人会写前端,但卡在后端和数据库。
这就是服务机会。
8. Dify
GitHub:github.com/langgenius/dify
部署文档:docs.dify.ai/en/self-host/qu…
Dify 是一个开源 LLM 应用开发平台,可以搭 AI 客服、AI 知识库、RAG 应用、Agent 和工作流。
赚钱方式:帮企业私有化部署 Dify,然后配置模型 API、知识库、工作流、域名、HTTPS 和后台账号。
最容易卖的不是:
“我帮你部署 Dify。”
而是:
“我帮你搭一个 AI 客服。”
“我帮你搭一个企业知识库。”
“我帮你搭一个销售自动回复助手。”
客户买的不是开源项目。
客户买的是一个能直接用的业务结果。
总结一下:
开源项目本身免费。
但部署、配置、上线、备份、维护、业务落地不免费。
很多人不会做 SaaS,也不需要一开始就做 SaaS。
你可以先从代部署服务开始:
帮客户把工具跑起来,配置好,交付一个能用的系统。

14
24
2,993
