🎯 Full Video: youtu.be/8x6cD3-joc4
Most traders use VWAP wrong
They stop at Daily VWAP and wonder why consistency never comes
Here’s the reality
Markets don’t move on one timeframe
Institutions don’t think intraday
Money flows across layers
If you’re only watching one VWAP you are trading half the picture
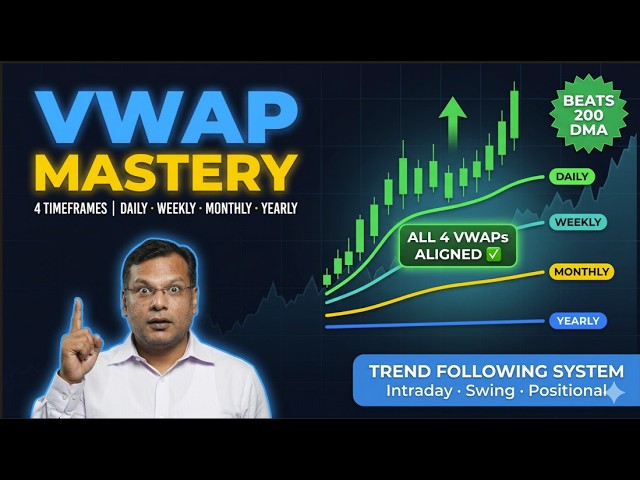
There are 4 VWAPs that actually matter
Daily VWAP intraday structure
Weekly VWAP swing direction
Monthly VWAP positional bias
Yearly VWAP long term trend
Individually they help, together they change everything
When VWAPs start aligning price is no longer random
It becomes structured
Directional
Institutionally driven
If price is above all VWAPs buyers control every timeframe
If price is below all VWAPs sellers dominate completely
No confusion
No overthinking
No prediction
Just alignment
And alignment is where real trends begin
The biggest mistake traders make is trading in mixed zones
Where VWAPs are fighting each other
That is where losses come from
Not strategy
Not indicator
Just poor context
The real edge is simple
Wait
Observe
Act only when structure is clear
This is how professionals approach markets
Not by guessing but by aligning with flow
If you understand this deeply your trading changes permanently
Watch the full breakdown now
#VWAP #VWAPStrategy #VWAPTrading #MultiTimeframeTrading #TrendFollowing #IntradayTrading #SwingTrading #PositionalTrading #StockMarketIndia #TechnicalAnalysis #PriceAction #TradingStrategy #AlgoTrading #InstitutionalTrading #SmartMoney #TradingView #MarketStructure
3
565
✅ Full Video: youtu.be/11zVb6um9Q0
Most traders lose money with Bollinger Bands because they trade band touches in sideways markets ❌
Professionals don’t. They wait for trend alignment structure confirmation.
In this reel, you’ll learn a multi-timeframe Bollinger Bands Price Action intraday framework used by professional traders: 1H direction → 15M setup → 5M execution 📈
This approach filters noise, avoids chop, and trades only when volatility expansion aligns with higher-timeframe bias.
You’ll see how Bollinger Band breakouts work only when supported by price action, giving you cleaner entries, tighter risk, and better consistency.
A FREE TradingView Pine Script is included so you can apply the system instantly.
Works across stocks, indices, crypto, forex, and commodities.
What you’ll learn: • Why Bollinger Bands fail in sideways markets
• How multi-timeframe alignment boosts accuracy
• 1H trend bias, 15M confirmation, 5M execution
• How to avoid fake breakouts and band chop
• Entry, stop-loss & profit-booking logic
• Practical intraday risk management
This is not indicator hopping.
This is professional intraday execution with structure and clarity.
LIKE if you trade Bollinger Bands
COMMENT: 5M or 15M — which do you prefer?
SHARE with traders stuck in Bollinger Band chop
#BollingerBands #IntradayTrading #MultiTimeframeTrading #PriceAction
#DayTrading #VolatilityTrading #BreakoutTrading #TradingView
#PineScript #ProfessionalTrading #TechnicalAnalysis #ProTrader
11
43
3,046

6 Sep 2025
🚨 The Wedge Pattern – Smart Money’s Favorite Trap.
🔗youtu.be/7kB4C-AgIAA
The wedge pattern is not just another chart setup — it’s one of the most powerful climax patterns in trading. Often marking major tops & bottoms, wedges act as smart money traps, creating explosive reversals when traded with the right confirmation tools.
In this new video, Bharat Jhunjhunwala breaks down how to master wedge trading using RSI Multi-Timeframe Analysis for high-probability setups across stocks, forex, crypto & commodities.
✅ Spot Rising vs Falling Wedges with precision
✅ Understand why wedges trap retail traders
✅ Use RSI divergence & range shifts for perfect timing
✅ Align daily, weekly & intraday charts for confluence
✅ Exact entry, stop & exit rules for wedge trades
✅ Real-world charts: Nifty, Bank Nifty, Bitcoin, Gold, Silver
📈 2025 Market Edge:
Wedge = exhaustion → explosive reversals
RSI MTF = confluence → safer trades
Smart money = traps liquidity → sharp reversals
This is not theory — it’s a practical wedge trading system you can apply right now.
👉 Like if you’ve ever been caught in a wedge trap
👉 Comment your experience trading wedges
👉 Share with traders who want to catch tops & bottoms with accuracy
#WedgePattern #SmartMoneyTrap #RSI #MultiTimeframeTrading #ChartPatterns #TechnicalAnalysis #SwingTrading #DayTrading #StockTrading #ForexTrading #CryptoTrading #TradingStrategy #ReversalPatterns #TradingSetups #BharatJhunjhunwala #TradingEducation #MarketPsychology

4
636

17 Jun 2025
📘 Advanced Strategies – Lesson 6: Multi-Timeframe Confluence – How to Use Higher Timeframes to Trade Smarter
By: XXCrypto Derivatives Rebate Academy
Ever entered a trade because the daily MACD flashed bullish, only to get trapped when the market suddenly reversed?
Or went short on what looked like a clear breakdown—only for price to bounce hard at a support level you missed?
Here’s the truth:
You’re trading with a single-timeframe lens, while the market moves in multi-timeframe structures.
In this lesson, we’ll teach you how to align monthly, weekly, and daily charts to filter noise, identify strong trends, and time your entries with precision.
“Use the telescope to find direction. Use the magnifying glass to find the entry.”
1. 🎯 What Is Multi-Timeframe Confluence?
Multi-timeframe confluence means aligning signals across different timeframes to increase confidence in your trades.
✅ Why it matters:
Single timeframe setups are often fakeouts
Large trends are driven by higher timeframes
Entry points are hidden in lower timeframes
This approach lets you ride trends, not fight them—with surgical precision.
2. 🔍 The 3-Tier Timeframe Structure
📅 Monthly Chart → Trend Direction
Defines macro trend (bullish / bearish / ranging)
Key indicators:
EMA60 sloping up price above Bollinger mid-band → Bull trend
EMA60 flat/down price below mid-band → Bear trend
📆 Weekly Chart → Swing Rhythm
Reveals the trend phase—acceleration, consolidation, or reversal
Signals to watch:
MACD bullish crossover above zero → Strong uptrend
RSI > 50 with volume expansion → Institutional buying
📈 Daily / 4H Chart → Entry & Exit
Pinpoints exact entry, stop loss, and take profit levels
Tactics:
Fibonacci 61.8% retracement bullish candle pattern (e.g. morning star, engulfing)
MA crossovers with volume confirmation = true breakout
3. 🧠 Strategy Flow: The Confluence Chain
cssCopyEdit[ Monthly → Trend confirmed ]
↓
[ Weekly → Swing trigger or pullback ]
↓
[ Daily → Entry signal & structure ]
✅ All aligned = High-conviction setup → Consider full position
✅ Mixed signals = Trade cautiously or reduce size
❌ Conflicting signals = Sit out and wait
4. 🧪 Live Example: BTC in Early 2025
Let’s say you’re analyzing BTC and spot a potential rally:
🔍 Monthly
EMA60 pointing up
Two consecutive bullish candles
MACD crosses up above zero
→ Confirmed bull market structure
🔍 Weekly
Bounce off Bollinger mid-band
Volume spike RSI climbs to 60
→ Swing reversal signal confirmed
🔍 Daily
Price finds support at 61.8% Fib retracement ($35,500)
Bullish engulfing candle volume confirmation
→ Precision long entry setup
📈 Entry: $35,500
📉 Stop: $34,200
🎯 Target: $39,800
5. ⚠️ Common Mistakes in Multi-Timeframe Trading
❌ Ignoring higher timeframes and only trading 4H/1H signals
❌ Trading when timeframes conflict → Get whipsawed
❌ Micromanaging trades on tiny timeframes → Emotional decisions
✅ Better mindset:
Trend = Monthly
Swing = Weekly
Execution = Daily
→ Align all 3 before pulling the trigger
6. ✅ Risk Management Tips & Bonus Moves
Only go full size on clear confluence setups
Factor in funding rates, macro data (e.g. FOMC, CPI) before entries
Maintain a chart journal tracking all 3 timeframes—your “trend notebook”
🔚 Final Word: Direction Beats Effort
✔️ Monthly = Telescope → see the macro view
✔️ Weekly = Map → understand trend rhythm
✔️ Daily = Magnifying glass → execute with precision
“Trade with the trend—or get wiped out by it.”
#MultiTimeframeTrading #ConfluenceStrategy #TrendAnalysis #FuturesTips #TradingSystem #XXCrypto

5
1
546

6 Sep 2023
Master multi-timeframe trading! ⏲️ Learn how to use multiple timeframes for better trading decisions and improved profitability, on #EspressoBootcamp. #multitimeframetrading #tradingstrategies #investing
myespresso.com/bootcamp/modu…
@espressoinvest
2
890

6 Jun 2020
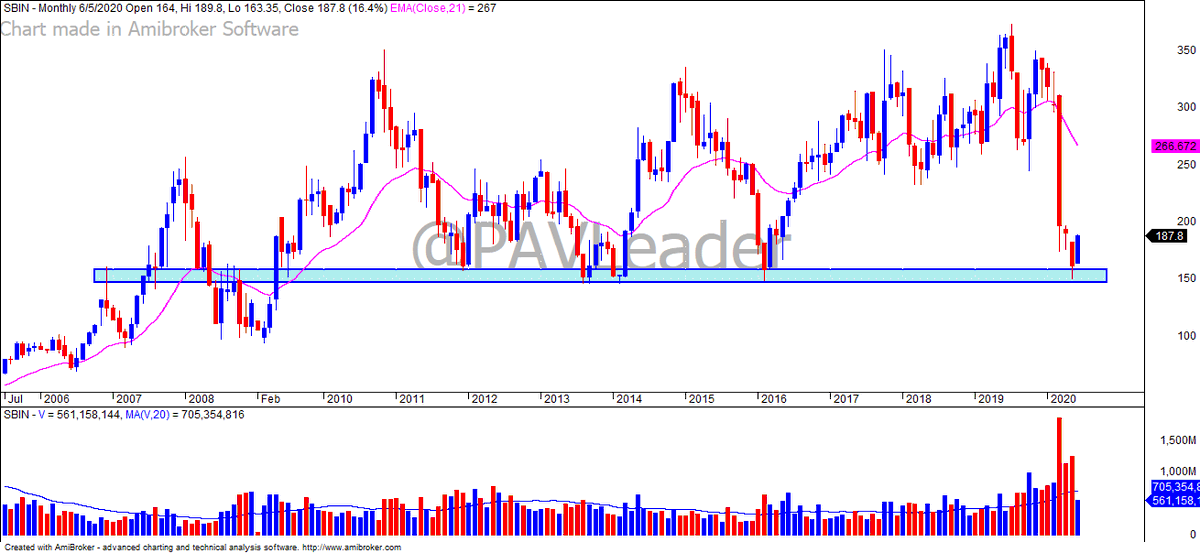
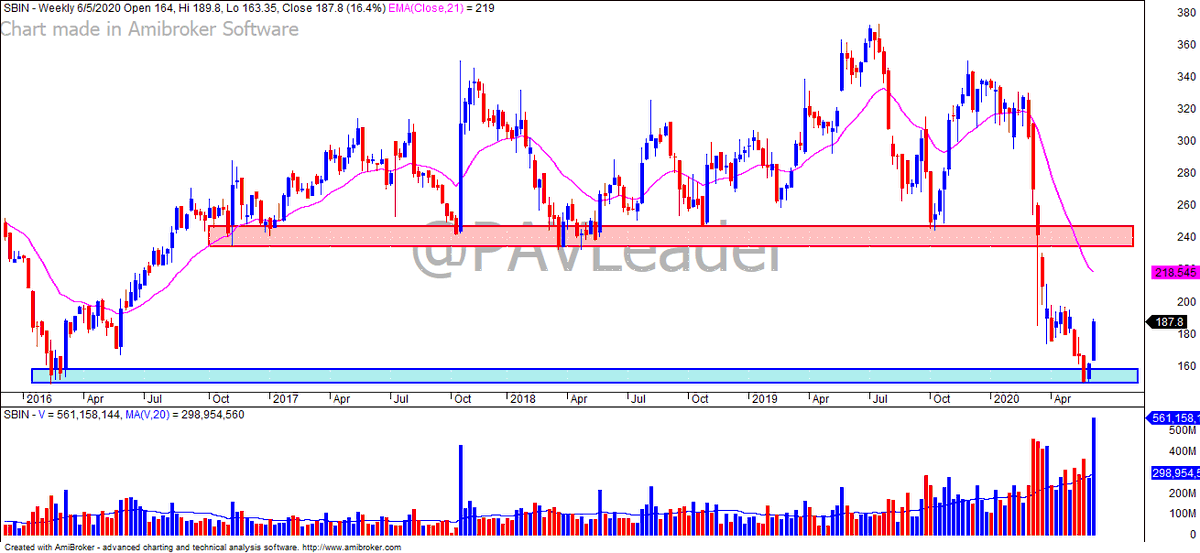
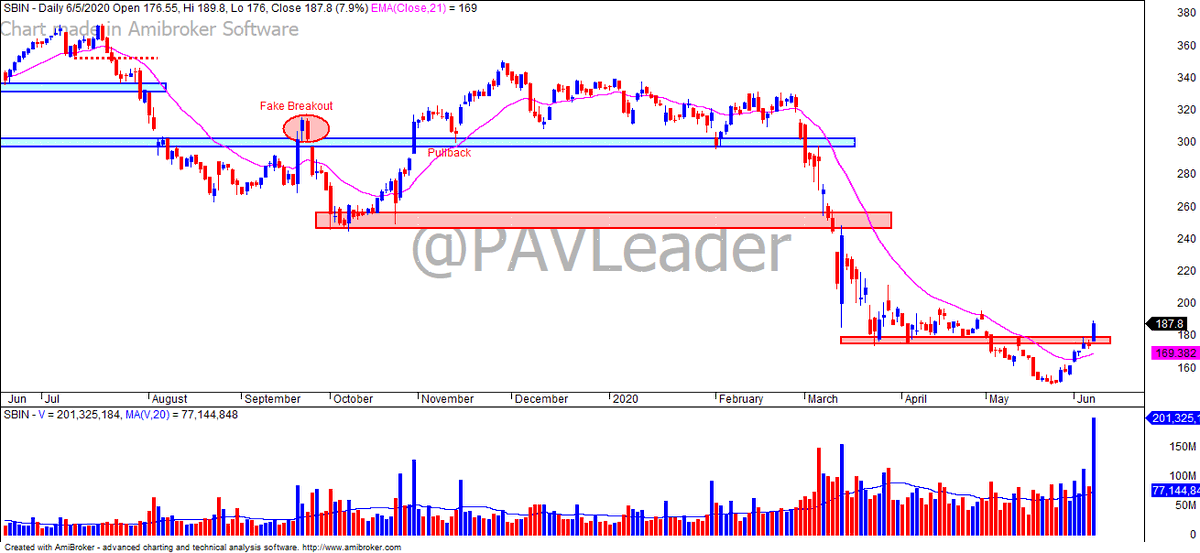
#SBIN Monthly, Weekly & Daily #PriceAction
Keep your charts as simple, clean as you can.
#LearnWithPAL #MultiTimeframeTrading
32
52
580
28 May 2020
A pullback on higher timeframe can be a trend on lower timeframe. Marking supply/demand zones on higher times (shd be visible on lower TF as well) can help you time your entries better when trend reversals happen on lower TF.
#MultiTimeFrameTrading
8
36
301

30 Dec 2019
#dollarindex 💲 Re-visiting a post from 30 sep 2019 where the #DXY hit some overhead resistance on weekly. Chart played out perfectly.
Here is the orignial post 👇
tradingview.com/chart/DXY/gz…
#multitimeframetrading
2
1