

Jun 13
Moleみたいにシステム監視・メンテ系のOSSはここでカテゴリ別に整理してます。リアルタイム監視の定番netdataもまとめてるので、自前で監視基盤を組みたい人はどうぞ。
opensourcelab.jp/tools/netda…
23

Jun 11
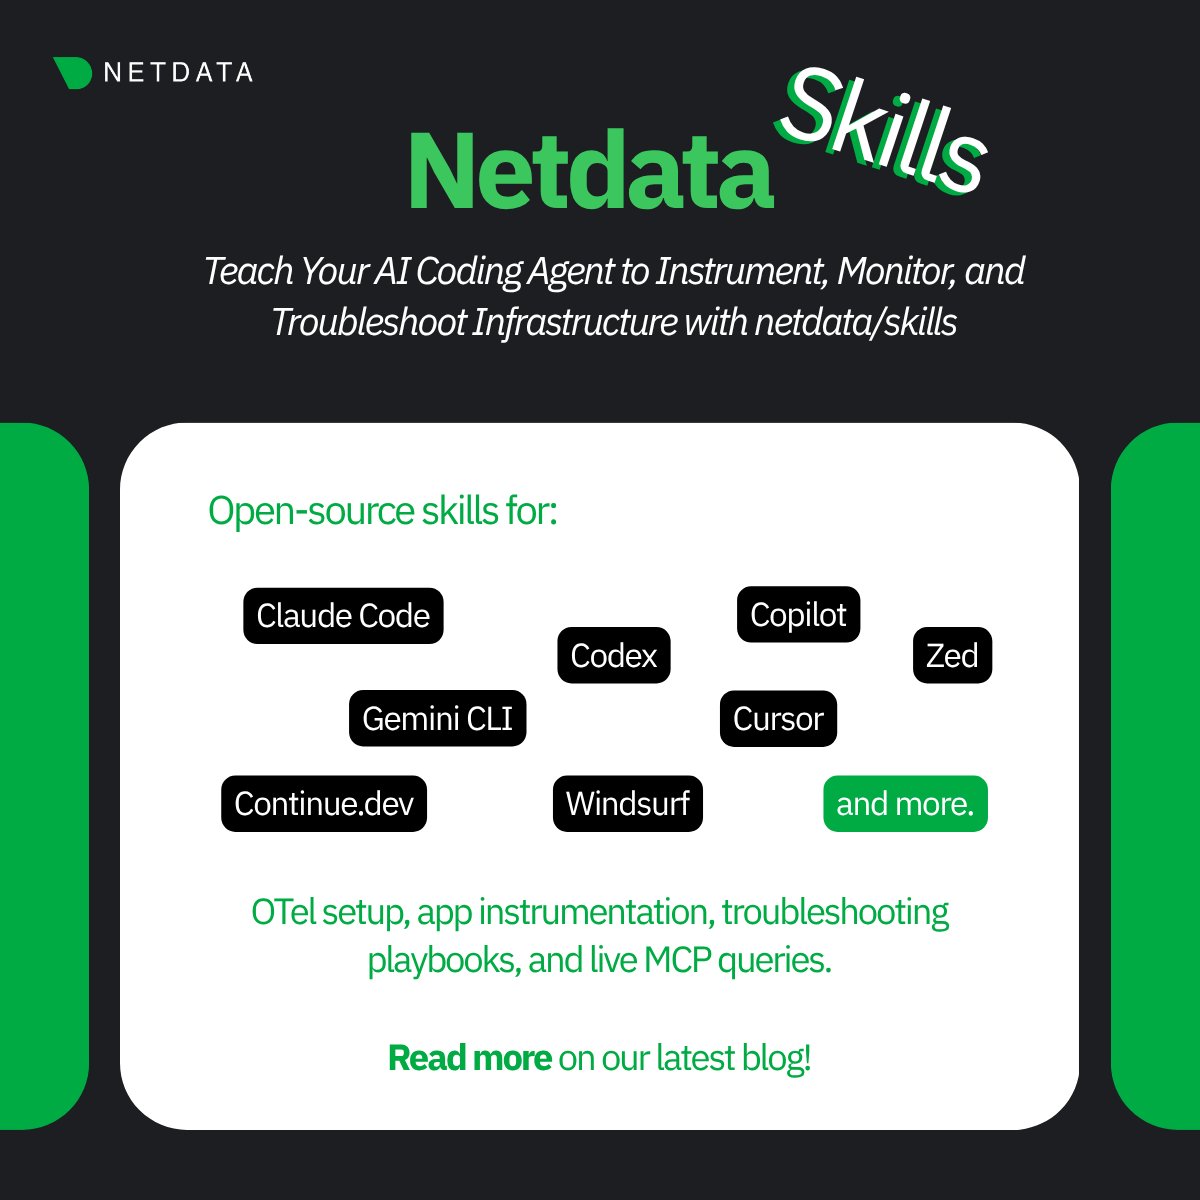
netdata/skills: 50 open-source skills for AI coding agents (Claude Code, Copilot, Cursor, Gemini CLI, and more). OTel setup, instrumentation, troubleshooting playbooks, live MCP queries. tinyurl.com/bddkxaes
1
84

Ultimate Guide to #VPS #Security Hardening
This article provides a guide to VPS security hardening.
Securing a Virtual Private Server ...
Keep reading 👉 blog.radwebhosting.com/vps-s… #grafana #ufw #netdata #logwatch #prometheus #ossec #rockylinux #wazuh #firewalld #vpsguide
80

Jun 10
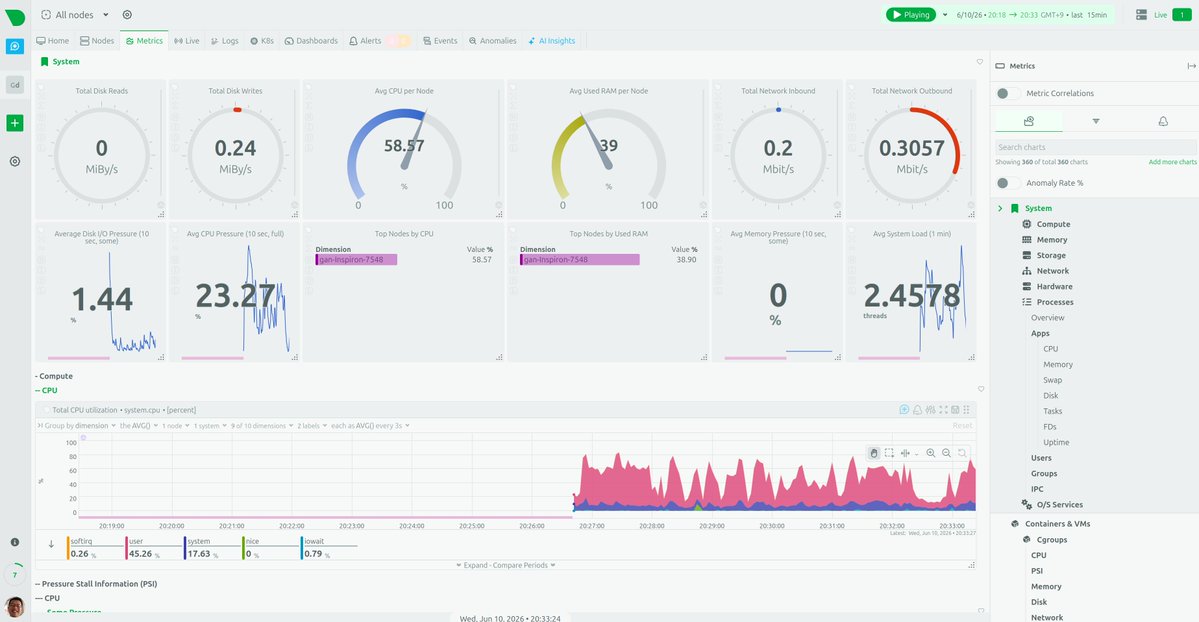
OpenTelemetry Collector Netdata as your OTLP backend. Per-second charts, ML anomaly detection, AI troubleshooting. No per-metric pricing. tinyurl.com/4fj8ef7t
64

半蔵 retweeted

Jun 9
Monitor your server infrastructure like a pro in real-time!
Learn how to install Netdata on Ubuntu 24.04 LTS to view thousands of system metrics instantly. Complete setup in under 90 seconds.
🔗 Watch here: youtube.com/watch?v=_NmhRLjK…
#Netdata #SysAdmin #DevOps #LinuxServer #CloudComputing #TechTips
3
4
38

Jun 10
Netdata just hit 79 K stars on GitHub, and it's quietly making most paid observability tools look like a joke.
It's a C-based, self-hosted engine that gives you real-time monitoring, and now it adds AI-powered full-stack observability. No wrapper, no SaaS upsell. Anomaly detection, root-cause analysis, and MCP support are baked right into the dashboard, and it's all free.
What really matters is that Netdata can crunch millions of metrics per second on a single Raspberry Pi. The AI doesn't just fire off alerts; it explains *why* something broke, correlating data across your entire stack in real time. Because it's self-hosted, your data never leaves your own infrastructure.
I've seen monitoring solutions balloon into 50-agent deployments with per-host billing that can rival your cloud compute bill. Netdata flips that on its head: one agent, no sampling, no data-egress fees. Thanks to MCP integration, you can query your whole environment in plain language and get answers instantly.
That's open-source at scale, built by people who actually run production systems. The 79 K stars say the community agrees.
github.com/netdata/netdata
35
Jun 9
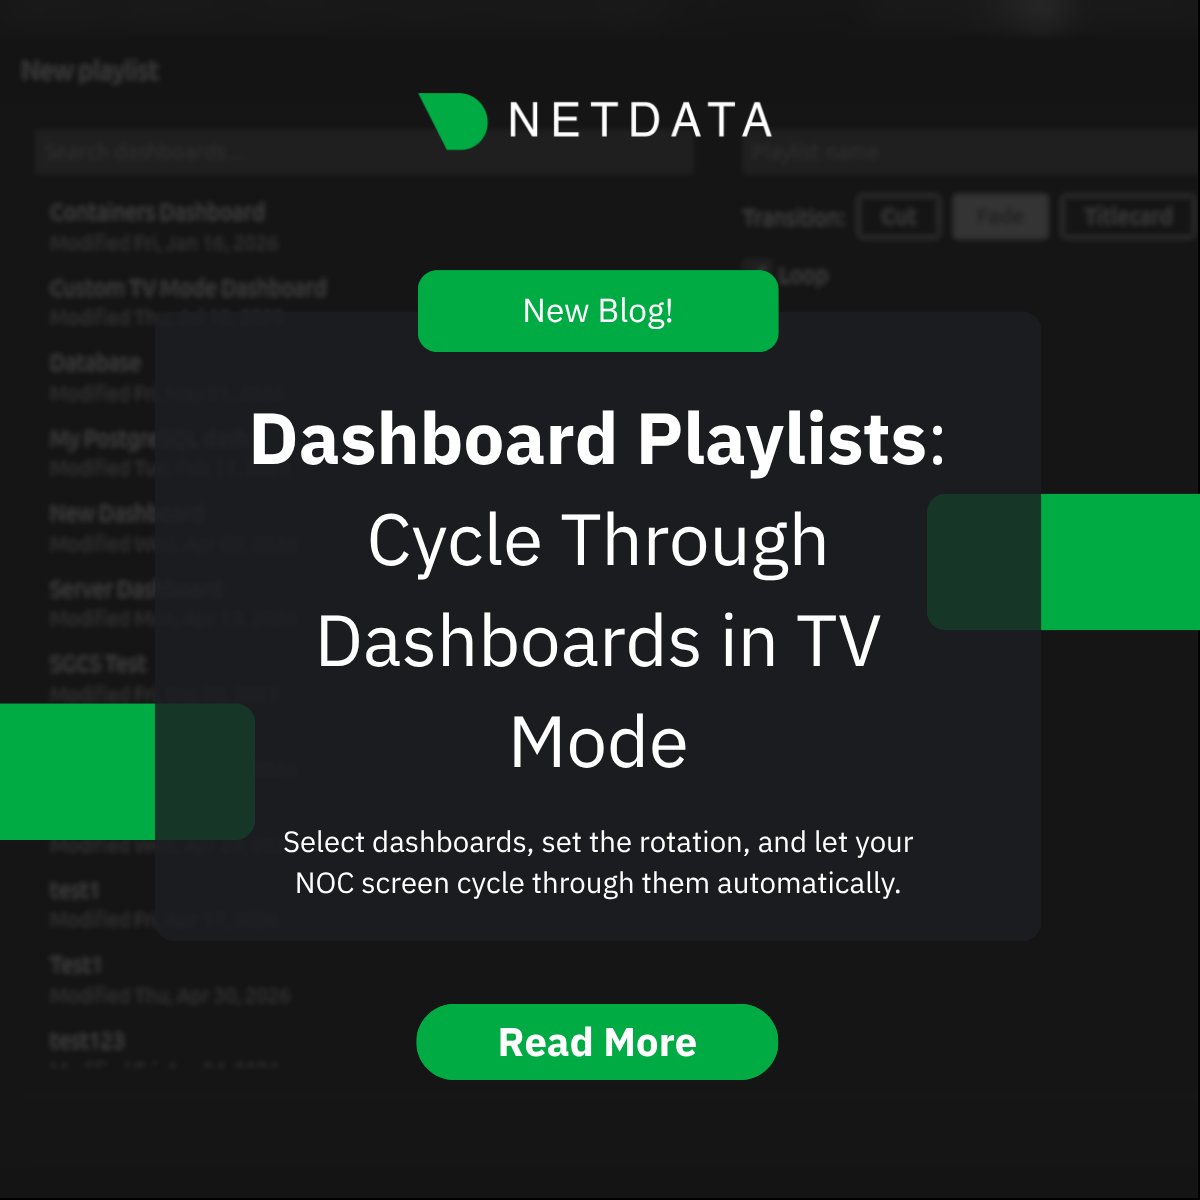
TV Mode playlists in Netdata: pick your dashboards, set the rotation interval, let the NOC screen handle the rest. Read more: tinyurl.com/ye26j4uz
62
Denis Rasulev retweeted

Jun 9
Why I left Netdata, ditched Grafana Prometheus, and settled on Beszel, plus other options worth knowing about.
denshub.com/en/self-hosted-m…
1
1
13
Updated Post: 🚀 How to Install and Run Netdata on AlmaLinux VPS (5 Minute Quick-Start Guide)
#Cloud #Guides #VPS
blog.radwebhosting.com/insta…

ALT 🚀 How to Install and Run Netdata on AlmaLinux VPS
57


Jun 7
Eskiden dedicated sunucu kiralamak, bakımı güvenliği v.s okadar zordu ki.
Dün Hetznerden AX102 aldım aylık 149 USD ye, tüm siteleri taşıdım, güvenliğini yaptım, yedeklemeleri hallettim, 4 usd ye storage box aldım anlık oraya da yedekliyor. Cloudflare'i de bağladım tamamen güvenli oldu. Netdata ile sunucuyu anlık izliyorum.
Saldırı dahi olsa yedekler storageboxta hazır, DBler veriler v.s
İyi ki AI var :)
158


May 29
最近发现了个超牛逼的项目,叫做 netdata。这玩意儿能给你带来AI加持的全栈可观测性,哪怕是小团队也能轻松驾驭。
之前咱们遇到的问题啥的,比如监控难、数据看不懂,这玩意儿都能解决。直接上项目,亮点我给你划一下:。
超快!性能爆表,响应速度快得飞起。
AI赋能,智能报警,有问题它先告诉你。
全栈覆盖,从数据库到应用,一网打尽。
来,给你举个栗子,比如你想看看数据库的运行状态,直接敲个命令 netdata,立刻就能看到详细的图表和数据。
这玩意儿太实用了,我都开始用它来监控自己的服务器了。链接给你,吧,真香警告!
github.com/netdata/netdata
7
8
727
May 27
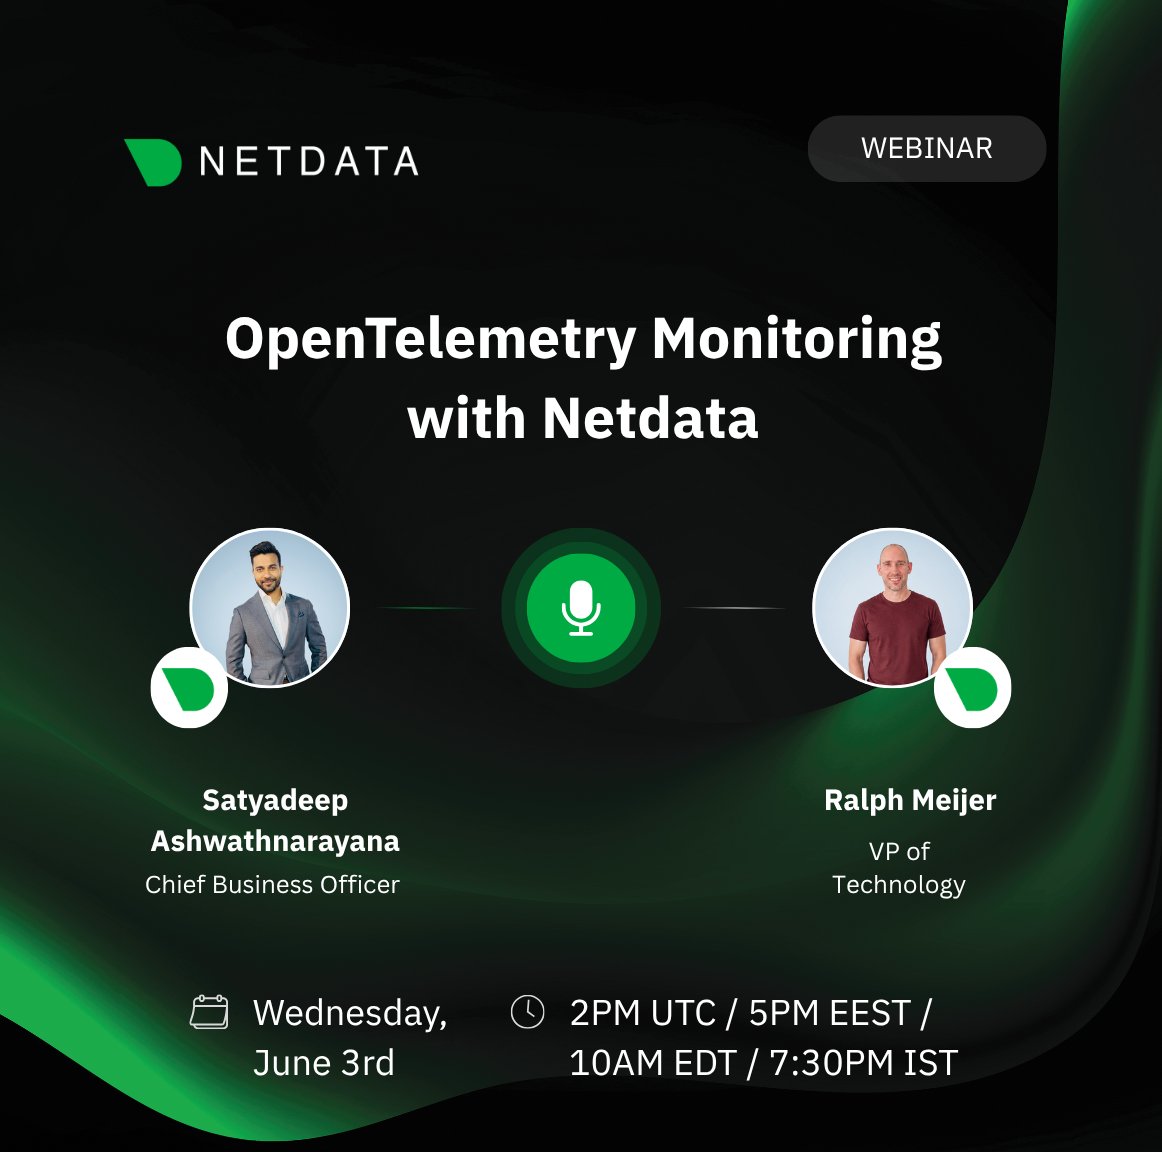
Your OTel pipelines. Netdata dashboards. Same interface as everything else in your infra.
What you'll see:
✅ OTLP metrics logs ingestion ✅ Unified views with agent-collected data ✅ Attribute mapping downstream forwarding ✅ Traces roadmap
Register: tinyurl.com/ypzpm3b4
1
4
92

May 25
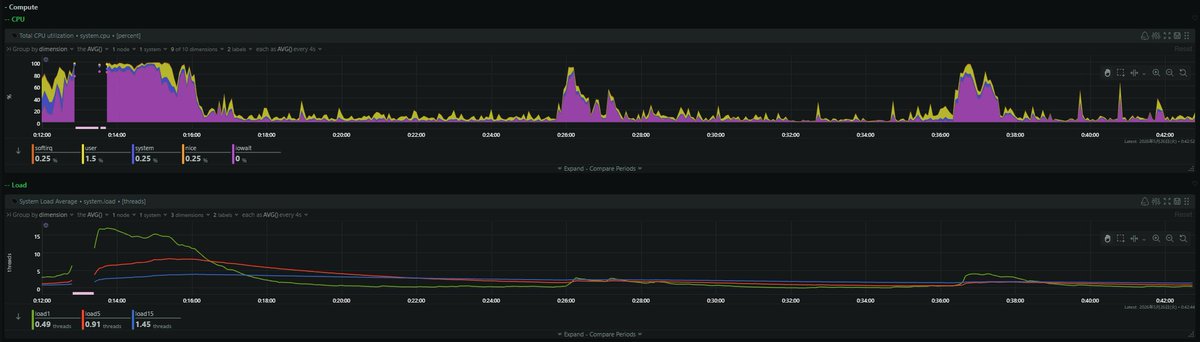
実家のNASの監視画面(Netdata)。
つい最近、NASへのアクセス集中でハングアップした事件があったのだけれど、恐らく原因を特定できたので現在静観中。
考察内容は、別マシン上のDockerのボリュームとしてNFS共有をマウントしているのだけれど、自分がDocker Desktopの管理画面でボリュームの内容を参照しようとしたことをトリガーにHDD内の全てのファイル一覧を取得するリクエストが送信され、後続のリクエストを捌き切れなくなってハングアップした、と予想している。
1
2
197