
Jun 13
What Is Open Interest? OI Build-Up, Long Build-Up, Short Build-Up Explained
Read More: niftytrader.in/markets/open-…
#NiftyTrader #OpenInterest #OIBuildUp #LongBuildUp #ShortBuildUp #OptionChain #TechnicalAnalysis #FuturesAndOptions #IndianStocks #TradingStrategy #FIIFlows

25
millionaire mind retweeted

Jun 13
Option Chain Se Support & Resistance Kaise Pata Kare? | Beginner Trading Guide
#OptionChain #SupportResistance #Trading #StockMarket #OptionTrading #IntradayTrading #PiyushFB #Finance #ShareMarket #TradingEducation
1
1
5

Jun 12
9/
📌 Into the close:
✅ PCR at 1.75 (day high)
✅ IV cooled
✅ ATM calls unwound
✅ Futures OI remained positive
✅ Spot closed near session highs
The #optionchain ended the day far stronger than it started.
1
47
Jun 12
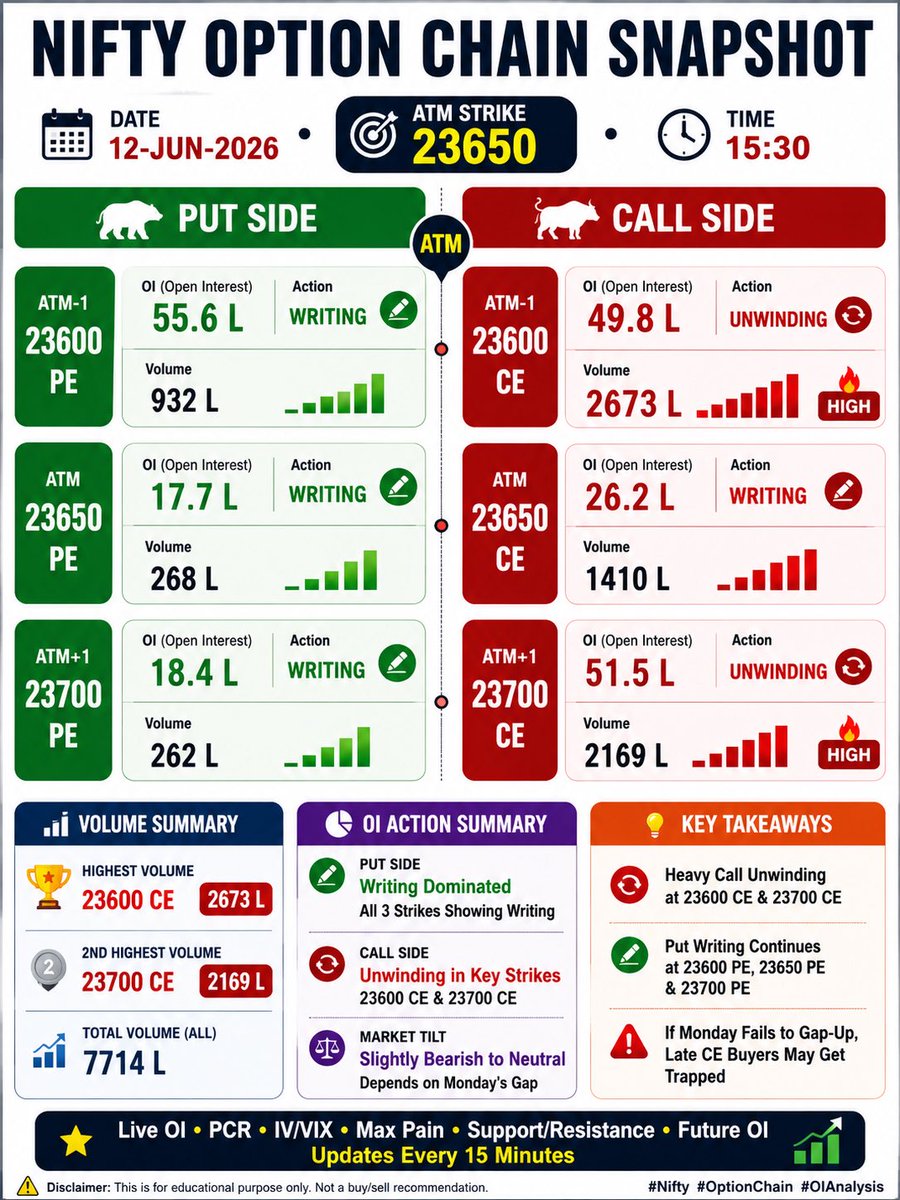
By EOD - 12th June
23600 CE saw massive volume of 2673 lakh while 49.8 lakh OI got unwound.
Looks like a lot of shorts exited and fresh traders chased the move.
If Monday doesn’t open with a decent gap-up, many late CE buyers could get trapped badly. 📊
#Nifty #OptionChain
2
10
932
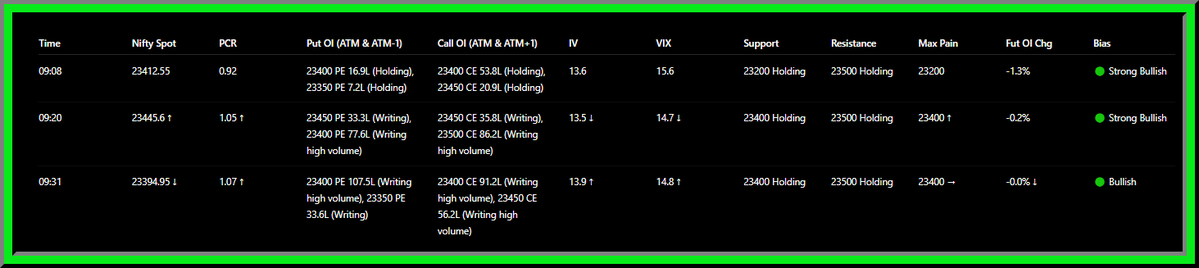
Jun 12
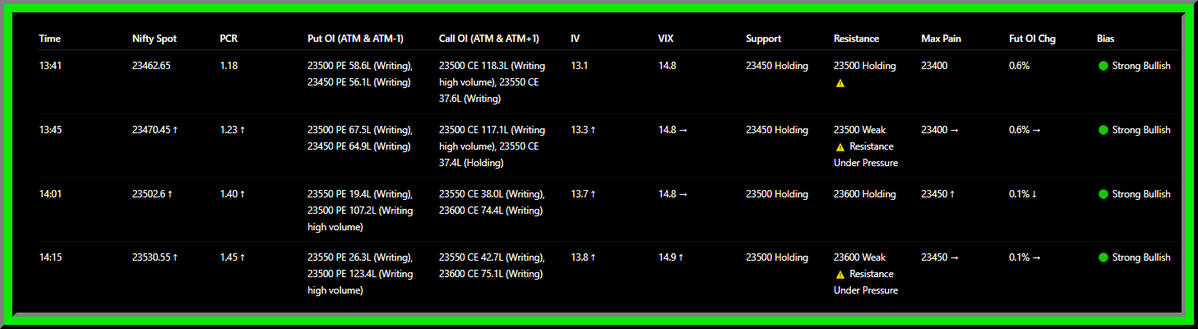
#Nifty Option Chain LIVE
🟢 Strong Bullish
Time: 14:15
Nifty Spot: 23530.55
Support: 23500 Holding ✅
Resistance: 23600 Weak ⚠
PCR: 1.45 ↑
VIX: 14.9 ↑
Max Pain: 23450 📌
Fut OI Chg: 0.1%
#OptionChain #OptionsBuy
1
4
321
Jun 12
Nifty Option Chain LIVE
🟢 Strong Bullish
Time: 12:00
Nifty Spot: 23375.25
Support: 23400 Holding ✅
Resistance: 23400 Weak ⚠ Resistance Under Pressure
PCR: 0.96
VIX: 14.8
Max Pain: 23350 📌
Fut OI Chg: 0.3%
#NiftyOptions #OptionChain #MaxPain #Nifty50 #IntradayTrading
1
2
320
Jun 12
Nifty Option Chain LIVE
🟢 Bullish
Time: 11:45
Nifty Spot: 23371.25
Support: 23350 Holding ✅
Resistance: 23400 Weak ⚠ Caution
PCR: 0.92
VIX: 14.9
Max Pain: 23350 📌
Fut OI Chg: 0.2%
#NiftyOptions #OptionChain #MaxPain #Nifty50 #IntradayTrading
1
321
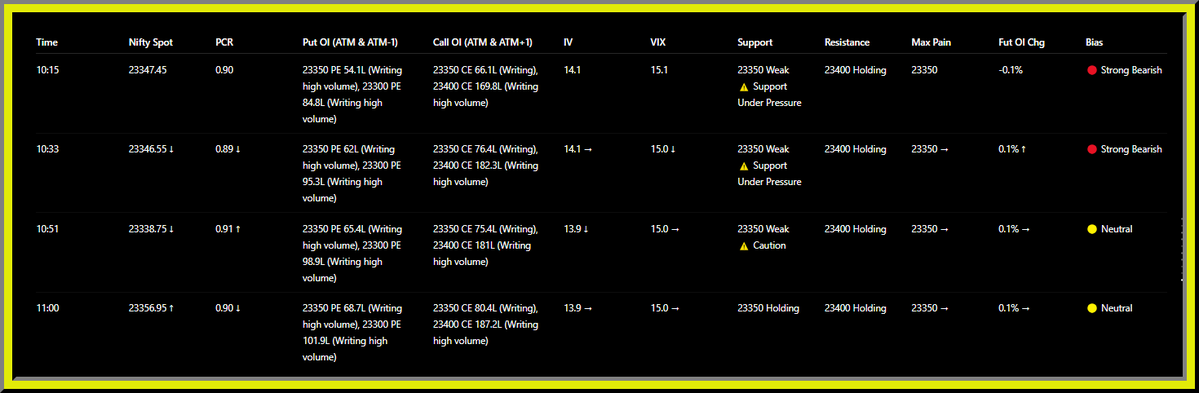
Jun 12
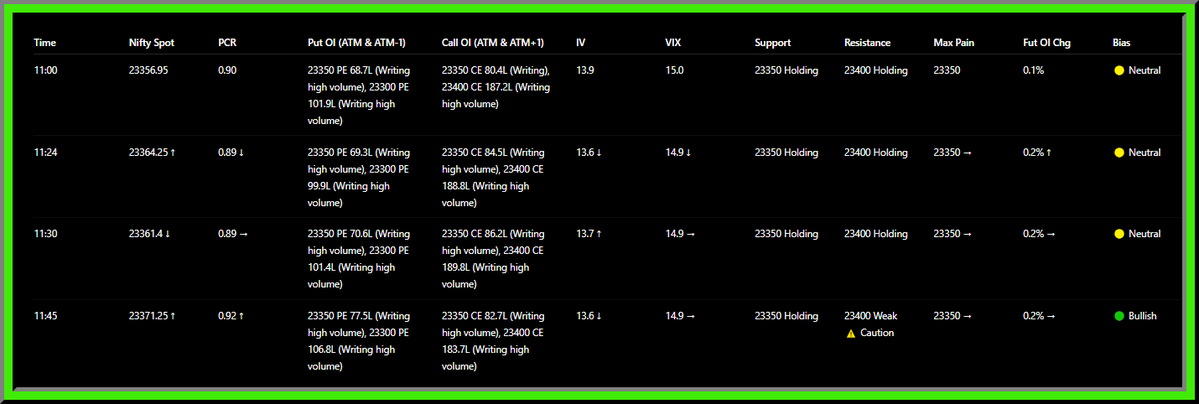
Nifty Option Chain LIVE
🟡 Neutral
Time: 11:00
Nifty Spot: 23356.95
Support: 23350 Holding
Resistance: 23400 Holding
PCR: 0.90
VIX: 15.0
Max Pain: 23350 📌
Fut OI Chg: 0.1%
#NiftyOptions #OptionChain #MaxPain #Nifty50 #IntradayTrading
5
318
Jun 12
#Nifty Option Chain LIVE
🟢 Bullish
Time: 09:31
Nifty Spot: 23394.95
Support: 23400 Holding
Resistance: 23500 Holding
PCR: 1.07
VIX: 14.8
Max Pain: 23400
Fut OI Chg: -0.0%
#OptionChain #PCR #NiftyAnalysis
4
268

#Nifty Update: Why My Bullish Bias Remains Intact
Most traders are focused on the recent decline.
I am focused on what happened at support.
📌 Daily RSI formed a PD (Positive Divergence) on 30th March.
📌 The current pullback has stalled precisely inside the Golden Pocket (61.8%-65%) Fib retracement zone.
📌 Hourly and 2-Hour charts are now showing fresh PD structures and range-shift attempts higher.
This doesn't guarantee a rally.
But it does suggest downside momentum is weakening while risk-reward is improving.
Now combine that with what matters most:
The Heavyweights.
✅ #HDFCBANK has already formed Daily & Weekly PD with LP structure on 2 Day timeframe.
✅ #RELIANCE is showing Daily & Weekly PD near important support.
✅ #INFY has formed Daily & Weekly PD with LP structure and is attempting a larger reversal.
A sustainable Nifty rally requires heavyweight participation.
That participation is gradually emerging.
June Option Chain Observations
June option data continues to support a bullish structural setup.
📌 Massive Call OI at 24,000 acts as a directional magnet rather than a ceiling at this stage.
📌 Aggressive Put writing between 23,000-23,500 highlights institutional willingness to defend lower levels.
📌 PCR near 1.05 suggests participants are positioning for a breakout rather than preparing for a breakdown.
📌 Implied Volatility remains relatively subdued and stable across major strikes, indicating option writers are comfortable carrying short volatility exposure and are not pricing in panic or disorderly downside risk.
Taken together, the options market is currently pointing toward an orderly grind higher rather than a high-probability bearish expansion.
As always, option data should be used as supporting evidence—not as a standalone signal—but when it aligns with price structure, intermarket analysis, and heavyweight stock participation, it becomes difficult to ignore.
Intermarket View
🇮🇳 #USDINR
One of the most important charts right now.
Today's close is likely to confirm a Daily ND (Negative Divergence).
If confirmed, it would support the broader bullish case for Indian equities.
🛢 #CrudeOil
Crude continues to display NR (Hidden Bearish Divergence) characteristics near resistance.
A softer crude environment remains supportive for India Inc., margins, inflation and market sentiment.
💴 #USDJPY
Perhaps the most under-followed macro chart among retail participants.
A successful breakout in USDJPY often reflects improving global liquidity and risk appetite, creating a favourable backdrop for equities worldwide.
My Working Thesis
I remain bullish for the remainder of June — until price proves otherwise.
Not because of opinions.
Not because of predictions.
Not because of narratives.
Because:
✔ Daily PD remains active.
✔ Golden Pocket Fib support has held.
✔ H1 & H2 are attempting range shift higher.
✔ HDFCBANK, RELIANCE & INFY are showing Daily and Weekly PD LP structures.
✔ Option positioning remains constructive.
✔ USDINR is close to confirming ND.
✔ Crude Oil remains constrained near resistance.
The path of least resistance appears higher.
If price confirms, I continue targeting a move toward the upper range and eventually the 24k zone.
If price invalidates, I will change my view immediately.
Agility over ego.
Price over opinion.
#Nifty #Nifty50 #BankNifty #HDFCBANK #RELIANCE #INFY #NiftyIT #USDINR #CrudeOil #USDJPY #OptionChain #PriceAction #TechnicalAnalysis #TradingView #IndianStockMarket #SwingTrading #Investing
@Chart_Wallah108
@yashraj_rana
@TA_Purvesh
@Value_of_Growth
@Thekalal
@PipCzar
@khanfaizantrd
@TrendSpider
@TradingView
@TradingCafeIndia
@MRaviTrader
@suru27
Educational purpose only. Not SEBI registered. Please do your own research before investing or trading.

2
1
203

Jun 11
☔ Before you step into the market, check the conditions.
Just like you wouldn't walk into a storm unprepared, trading without understanding market positioning can leave you caught off guard.
📊 Use the Option Chain on Flattrade to:
✔️ Track Open Interest (OI) across strikes
✔️ Identify key support and resistance levels
✔️ Analyze market sentiment faster
✔️ Make more informed trading decisions
See more. Plan better. Trade smarter.
#Flattrade #MarketBites #OptionChain #OptionsTrading #NiftyOptions #StockMarketIndia #TradingTools #OpenInterest #MarketAnalysis #TraderLife #FuturesAndOptions #InvestingIndia #StockMarketLearning #TradingEducation #SmartTrading #FinancialMarkets #LearnTheMarket #IndianStockMarket #RetailTrader #TradeWithConfidence #zerobrokerage

62
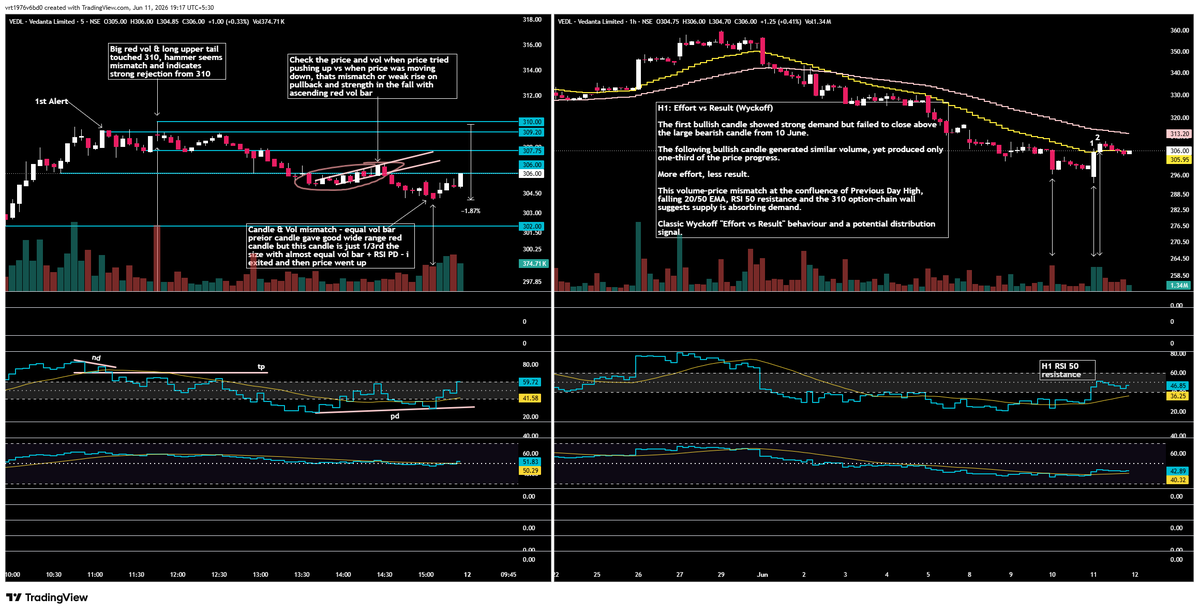
#VEDL #VSA #OptionChain
This morning, near the day high, I posted that #VEDL's 3% move looked more like a trap than genuine strength.
The stock eventually fell from ₹310 to ₹304.
Here's the complete breakdown of WHY — using Option Chain, VSA, Wyckoff and Intermarket Analysis.
This is not a trade call thread.
This is a lesson in how multiple independent pieces of evidence can point to the same conclusion. 🧵
━━━━━━━━━━━━━━━
🔴 SIGNAL 1 — THE 310 CALL WALL
When a stock is up 3%, the smart question isn't:
"How high can it go?"
It's:
"What are option writers doing?"
At 11 AM, the 310 CE saw 477 COI added in a single session — the largest fresh call writing on the entire chain.
CMP was around ₹308.
Writers were building a ceiling barely ₹2 above the market price.
As the day progressed, 310 CE OI kept increasing while price repeatedly failed at the same level.
The market kept trying.
The writers kept selling.
The wall held.
━━━━━━━━━━━━━━━
🔴 SIGNAL 2 — POSITIONING WAS NOT CHASING UPSIDE
The 300 CE attracted the highest call-side volume despite being below CMP.
Combined with aggressive writing at 310 CE, this suggested market participants were far more interested in capping upside than pricing a sustained breakout above resistance.
The option chain wasn't predicting.
It was confirming what price was already struggling to achieve.
━━━━━━━━━━━━━━━
🔴 SIGNAL 3 — IV SKEW FAVOURED THE DOWNSIDE
ATM Put IV: 46.82%
ATM Call IV: 39.65%
Spread: 7.17%
Many traders look at IV.
Few look at IV relative to the opposite side.
Throughout the session, Put IV remained materially higher than Call IV.
That told us market participants were willing to pay more for downside protection than upside exposure.
During a 3% rally, that's not a sign of confidence.
It's a sign of caution.
━━━━━━━━━━━━━━━
🔴 SIGNAL 4 — RELATIVE WEAKNESS WAS HIDING IN PLAIN SIGHT
This was arguably the most important signal of the day.
When I posted in the morning:
• Nifty was red
• VEDL was up nearly 3%
Looks bullish, right?
But then Nifty recovered almost 200 points from the lows and turned green.
VEDL?
Still trapped below ₹310.
For nearly two hours it failed to gain any meaningful ground despite receiving help from the broader market.
A genuinely strong stock usually accelerates when the market supports it.
VEDL didn't.
Markets often reveal weakness through non-participation.
When a stock cannot rise during favourable conditions, ask yourself:
What happens when conditions turn unfavourable?
The answer arrived after 1:30 PM.
━━━━━━━━━━━━━━━
🔴 SIGNAL 5 — THE BUYING CLIMAX AT 310
As price touched ₹310, it printed a long upper-wick candle on the highest volume bar of the session.
In VSA:
• High volume
• Upper wick
• Failure to close near highs
• No bullish follow-through
This is classic Buying Climax behaviour.
A large amount of effort was expended.
Very little progress was achieved.
The candle effectively drew the 310 option wall directly on the chart.
━━━━━━━━━━━━━━━
🔴 SIGNAL 6 — WYCKOFF'S "EFFORT vs RESULT"
This was visible on the 1-hour chart long before the breakdown.
The first bullish candle looked impressive and engulfed multiple prior candles.
Yet it failed to close above the large bearish candle from 10 June.
Then came another bullish candle.
Volume remained elevated.
But price progress collapsed to a fraction of the prior move.
More effort.
Less result.
In Wyckoff methodology, this often suggests supply is absorbing demand rather than genuine accumulation taking place.
Most traders see green candles.
Professionals compare effort to result.
━━━━━━━━━━━━━━━
🔴 SIGNAL 7 — RSI 50 RESISTANCE ON H1
The hourly trend remained bearish:
• Lower highs
• Lower lows
• Falling 20 EMA
• Falling 50 EMA
Today's bounce pushed RSI almost exactly into the 50 zone.
In a downtrend, RSI 50 often behaves as resistance rather than support.
The rally wasn't occurring from a position of strength.
It was rallying directly into higher-timeframe resistance.
━━━━━━━━━━━━━━━
🔴 SIGNAL 8 — THE BREAKDOWN CONFIRMATION
After failing near ₹310, price started grinding higher inside a small rising structure.
Many traders interpreted this as healthy consolidation.
Volume told a different story.
During the rise:
• Price advanced slowly
• Volume remained unimpressive
• Momentum weakened
During the breakdown:
• Support cracked
• Red volume expanded
• Selling accelerated
This is one of the most important VSA lessons:
Strong stocks rally on expanding volume and decline on contracting volume.
Weak stocks do the opposite.
Today's rally became weaker.
Today's decline became stronger.
Volume was confirming sellers, not buyers.
━━━━━━━━━━━━━━━
📌 THE REAL EDGE
No single indicator predicted today's move.
Not RSI.
Not Option Chain.
Not VSA.
Not IV.
The edge came from multiple independent factors pointing in the same direction:
✓ Weak Metals vs stronger Nifty
✓ Failure to benefit from a 200-point Nifty recovery
✓ Persistent 310 CE call wall
✓ Put IV consistently higher than Call IV
✓ Buying Climax at resistance
✓ Wyckoff Effort vs Result mismatch
✓ RSI 50 resistance on H1
✓ Weak pullback structure
✓ Expanding red volume during breakdown
When independent evidence starts telling the same story, conviction increases.
━━━━━━━━━━━━━━━
📌 THE BIG LESSON
Most traders ask:
"What indicator should I use?"
A better question is:
"What story are price, volume, relative strength, option positioning and market context collectively trying to tell me?"
The market speaks long before it moves.
The challenge is learning how to listen.
━━━━━━━━━━━━━━━
📌 One Final Thought
A popular saying on trading social media is:
"Only God or a liar can call tops and bottoms."
It sounds wise.
Until you start studying markets deeply enough.
The market leaves footprints long before a move is obvious. Option chains, volume, volatility, relative strength, market structure, sector rotation, intermarket relationships — individually they are noisy, but together they often tell a remarkably coherent story.
Most people inherit frameworks.
A few spend years testing them.
Most follow maps.
A few draw new ones.
If you scroll through my timeline, you'll notice something interesting.
Many of these posts were written before the move happened, not after.
Not because I can predict the future.
Not because I'm smarter than the market.
But because I believe accepted wisdom should be challenged, tested and improved.
Sometimes the market proves me wrong.
Sometimes it validates the work.
Either way, the objective is the same:
To think independently.
To follow evidence rather than consensus.
And to keep refining the process.
The market rewards curiosity far more than conformity.
#VEDL #PriceAction #VSA #OptionChain #TradingPsychology
#Nifty #VEDL #OptionsTrading #PriceAction #VSA #SwingTrading #MarketStructure #RSI #USDINR #IndianStockMarket #Nifty50 #BankNifty #TechnicalAnalysis #Trading #Investing #DowTheory #CrudeOil
@Chart_Wallah108 @yashraj_rana @TA_Purvesh @Value_of_Growth @Thekalal @PipCzar @khanfaizantrd @TradingView @TrendSpider @TradingCafeIndia @MRaviTrader @suru27
1
180

Jun 11
zerodha.com/?c=TW7401&s=CONS…
Zerodha Kite Web
TradingView-powered charts
Real-time Nifty Option Chain with OI data
Market Watch for stocks & F&O
Buy/Sell, GTT, Alerts & Basket Orders
Live RSI, Volume & Technical Analysis tools
#Zerodha #Nifty50 #OptionChain #Trading #StockMarket

177
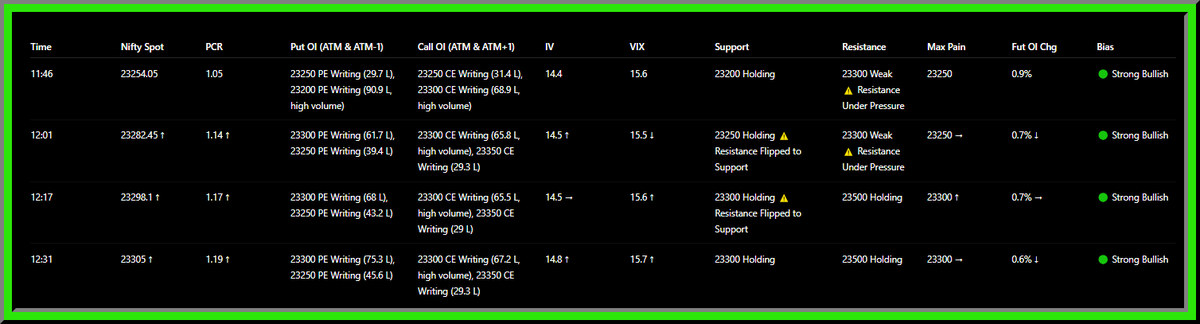
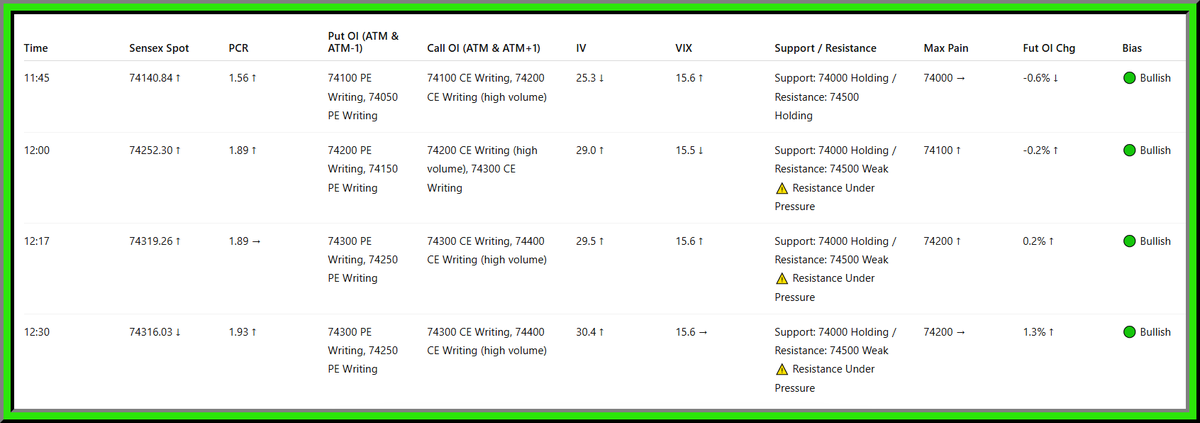
Nagi retweeted
Jun 11
Live Nifty Option Chain
🟢 Strong Bullish
Live Sensex Option Chain
🟢 Bullish
Time: 12:31
#Nifty #Sensex #OptionChain
1
2
361
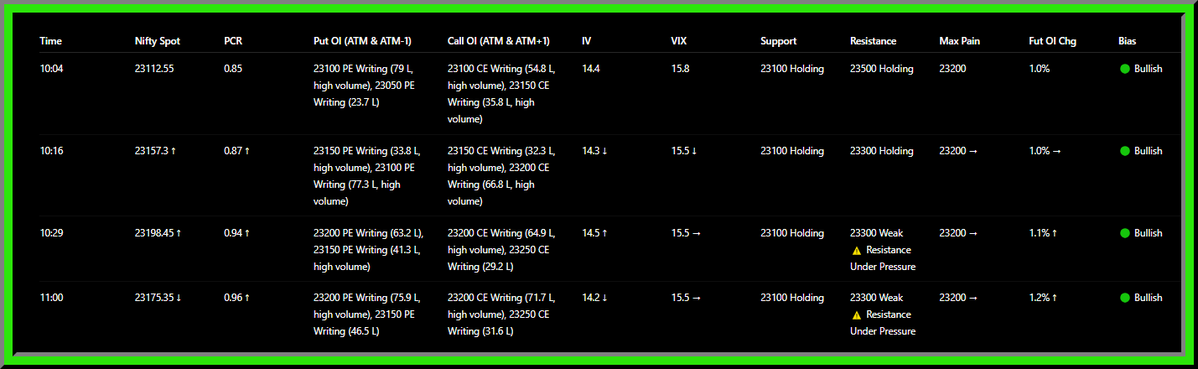
Jun 11
#Nifty Option Chain LIVE
🟢 Bullish
Time: 11:00
Nifty Spot: 23175.35
Support: 23100 Holding
Resistance: 23300 Weak ⚠ Resistance Under Pressure
Risk: 23200 CE writing remains heavy despite rising PCR
PCR: 0.96
VIX: 15.5
Max Pain: 23200
Fut OI Chg: 1.2%
#Nifty50 #OptionChain
1
320
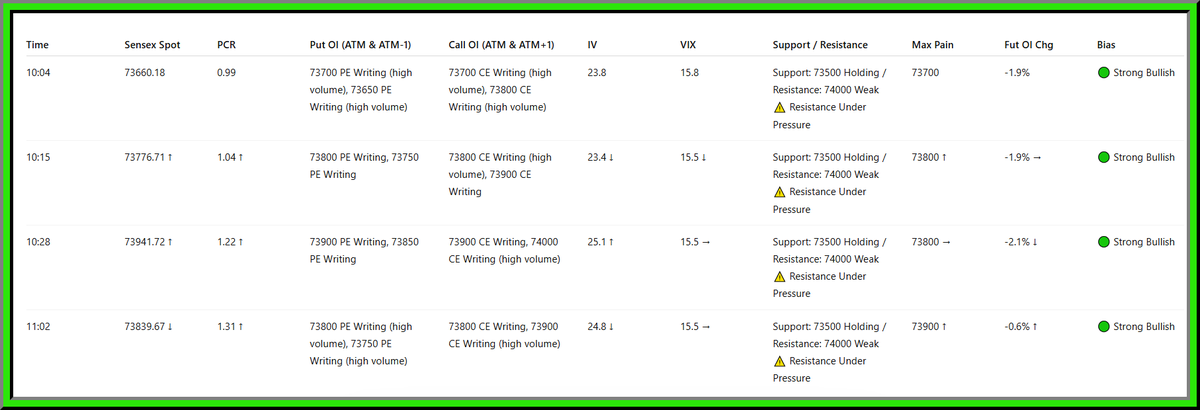
Jun 11
Live Sensex Option Chain
🟢 Strong Bullish
Time: 11:02
Sensex Spot: 73839.67
Support: 73500
Resistance: 74000
Risk: Failure to clear 74000 may trigger profit booking
PCR: 1.31
VIX: 15.5
Max Pain: 73900
Fut OI Chg: -0.6%
#Sensex #OptionChain
1
2
344
Jun 11
#Nifty Option Chain LIVE - 11th June 2026
🟢 Bullish
Time: 10:16
Nifty Spot: 23157.3
Support: 23100 Holding
Resistance: 23300 Holding
Risk: Strong call writing remains active at 23200-23300
PCR: 0.87
VIX: 15.5
Max Pain: 23200
Fut OI Chg: 1.0%
#PCR #OptionChain
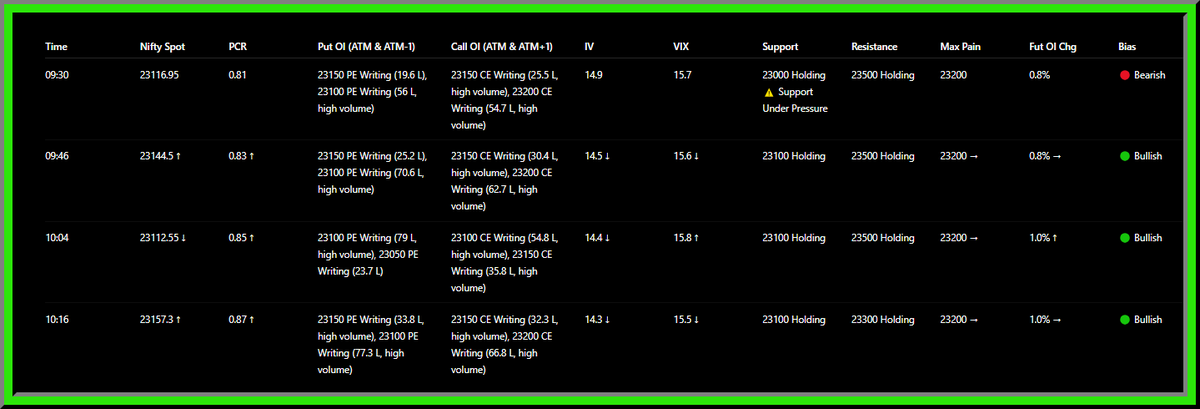
2
314
Jun 11
Live Sensex Option Chain - 11th June 2026
🟢 Strong Bullish
Time: 10:15
Sensex Spot: 73776.71
Support: 73500
Resistance: 74000
Risk: Heavy 74000 CE wall still needs absorption
PCR: 1.04
VIX: 15.5
Max Pain: 73800
Fut OI Chg: -1.9%
#Sensex #OptionChain

2
290
Jun 10
🔔 Closing Structure
➡ Close: 23214.95
➡ PCR: 0.82
➡ Max Pain: 23300
➡ Support: 23200
➡ Resistance: 23300
A bullish morning turned into a bearish close. The failure of 23400 was the day's defining signal.
#Nifty #OptionChain
1
108