
On May 30, the BTC/USDT spot pair displayed notable activity in its order book, as reflected in the Cumulative Volume Delta (CVD) and Volume Heatmap charts. #BITCOIN #BTC/USDT #CVD #orderbookanalysis #VolumeHeatmap
bitcoinworld.co.in/btc-usdt-…

57
On May 27, 2024, at 00:00 UTC, the spot cumulative volume delta (CVD) chart for the BTC/USDT trading pair presents a detailed view of order book dynamics. #Bitcointrading #BTC/USDT #CVDindicator #orderbookanalysis #TechnicalAnalysis
bitcoinworld.co.in/spot-cvd-…

20
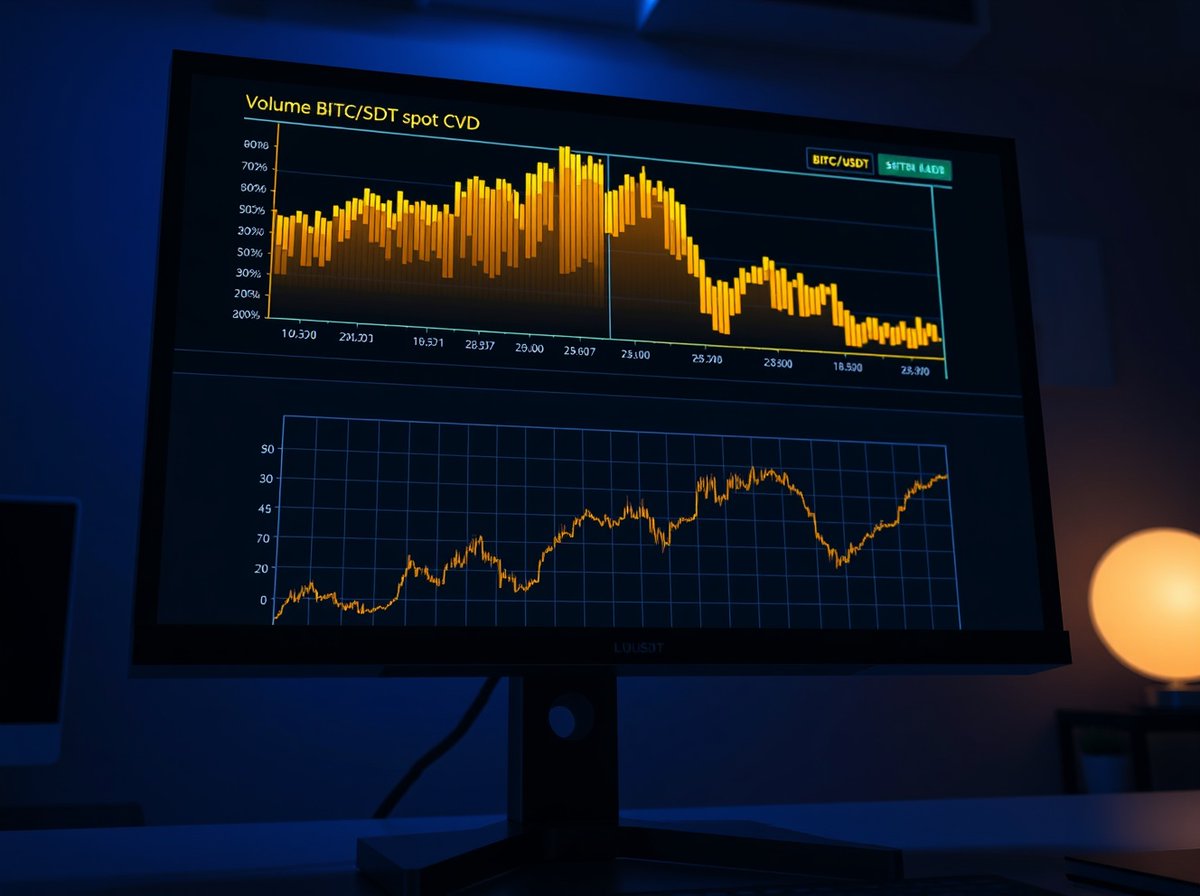
On May 22, 2025, at 5:00 a.m. UTC, the BTC/USDT spot Cumulative Volume Delta (CVD) chart provided a detailed view of order book activity for the leading cryptocurrency pair. #BITCOIN #BTC/USDT #CVD #orderbookanalysis #tradingindicators
bitcoinworld.co.in/btc-usdt-…

55
On May 19, the BTC/USDT spot market exhibited notable trading activity, as reflected in the Cumulative Volume Delta (CVD) and volume heatmap data. #BITCOIN #BTC/USDT #CVD #OrderBookAnalysis #VolumeHeatmap
bitcoinworld.co.in/btc-usdt-…

46
On May 12 at 6:00 a.m. UTC, the BTC/USDT spot Cumulative Volume Delta (CVD) chart presented a detailed snapshot of order book dynamics. #$BTC #BITCOIN #CVD #OrderBookAnalysis #VolumeHeatmap
bitcoinworld.co.in/btc-spot-…

33
For traders monitoring Bitcoin's spot market, the BTC/USDT Cumulative Volume Delta (CVD) chart offers a detailed look into real-time order flow. #Bitcointrading #BTC/USDT #CryptoIndicators #cumulativevolumedelta #OrderBookAnalysis
bitcoinworld.co.in/btc-usdt-…

1
37
At 5:30 a.m. UTC, the BTC/USDT spot CVD chart provides a critical snapshot of Bitcoin's order book dynamics. Traders use this analysis to identify potential support and resistance levels. #BITCOIN #BTC/USDT #OrderBookAnalysis #SpotCVD #VolumeHeatmap
bitcoinworld.co.in/btc-usdt-…
3
49

14 Dec 2025
Fake volume trap? Escape with spoofing detection in crypto trading order books. Real volume mastery awaits! #OrderBookAnalysis #CryptoTips
14 Dec 2025

14

9 Nov 2025
#VrtrEX Daily Contract Knowledge Point (New Issue 92)
Topic: Order Book Analysis
Judging Bullish and Bearish Strength from Order Book Changes
Identifying Manipulated Orders by Major Players
#VrtrEX #OrderBookAnalysis #ContractTutorial
16

22 Sep 2025
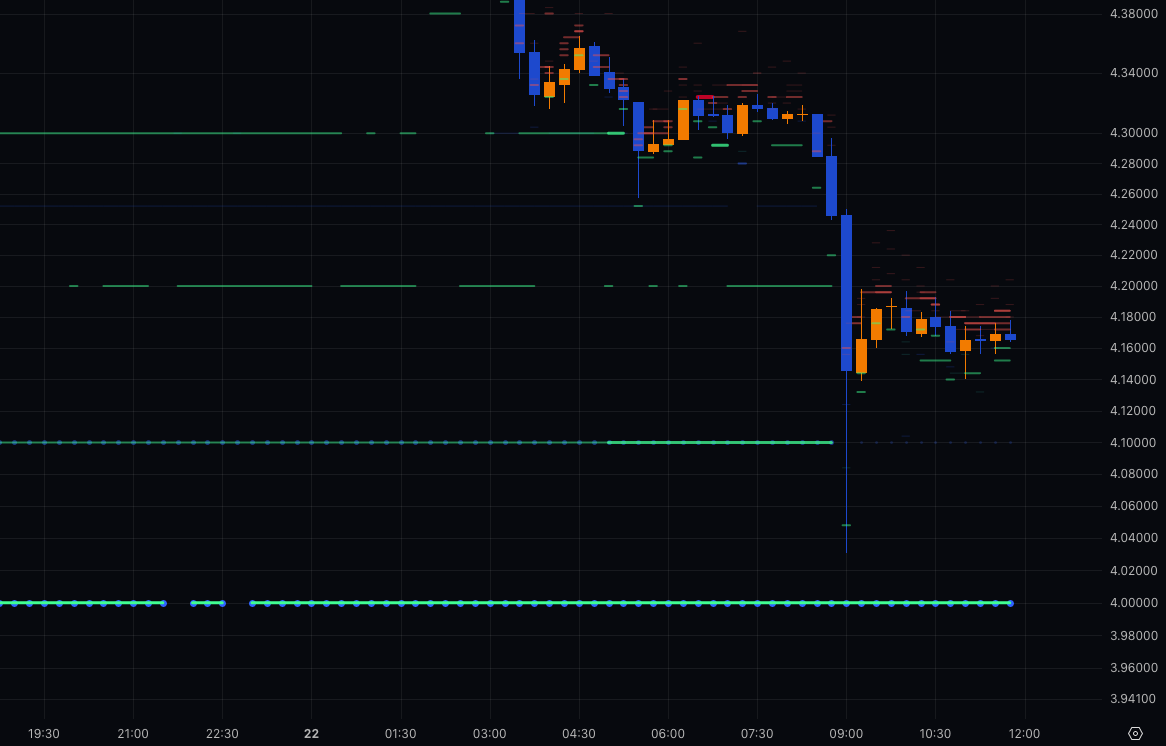
$ATOM: Still holding strong support with hefty limit orders at $4 on spot markets (green: Binance, blue: Coinbase) – price hasn't dipped that low yet! 💪📊🛡️ #ATOM #CryptoSupport #OrderBookAnalysis #SpotTrading
2
3
289

21 Sep 2025
How to Justify Fund-Based Limit for Contractors
#WorkingCapital #FundBasedLimit #ContractorFinance #OrderBookAnalysis #BankingTips #CAAnkushJain #ConstructionLoan
5

7 Sep 2025
12

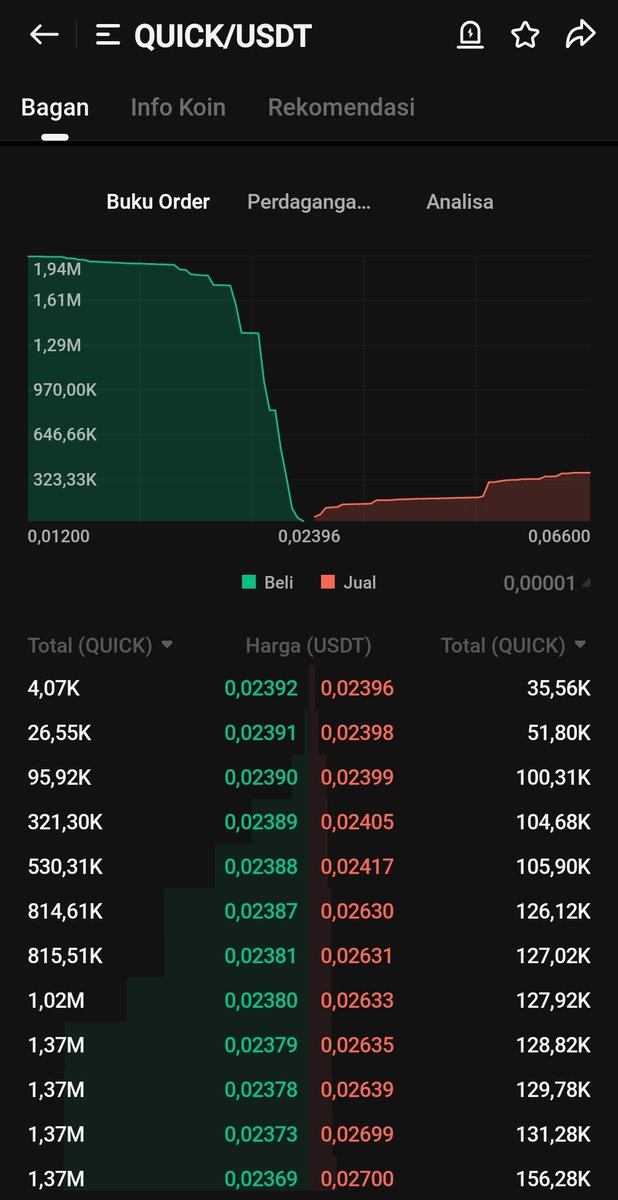
$QUICK Order Book:
Looking at the $QUICK/USDT order book, we see a classic supply and demand struggle. The substantial green buy wall clustered around the lower price points acts as a significant support level. This indicates strong demand and potential price floor. Conversely, the pronounced red sell wall at higher prices represents key resistance, suggesting considerable selling pressure in that zone.
Technically, this setup implies a potential consolidation phase within the range defined by these walls. Traders might anticipate price action bouncing between these levels. A breakout above the resistance (sell wall) could signal bullish momentum, while a breakdown below the support (buy wall) might indicate bearish continuation. Keep an eye on volume at these key levels; increased volume on a breakout would add conviction to the move. This snapshot highlights traditional technical analysis principles at play on a CEX for a DeFi native token.@QuickswapDEX
[Bullpost @rovadotxyz]
#TechnicalAnalysis #QUICK #CryptoTrading #OrderBookAnalysis #DeFi
1
2
200

9 Aug 2025
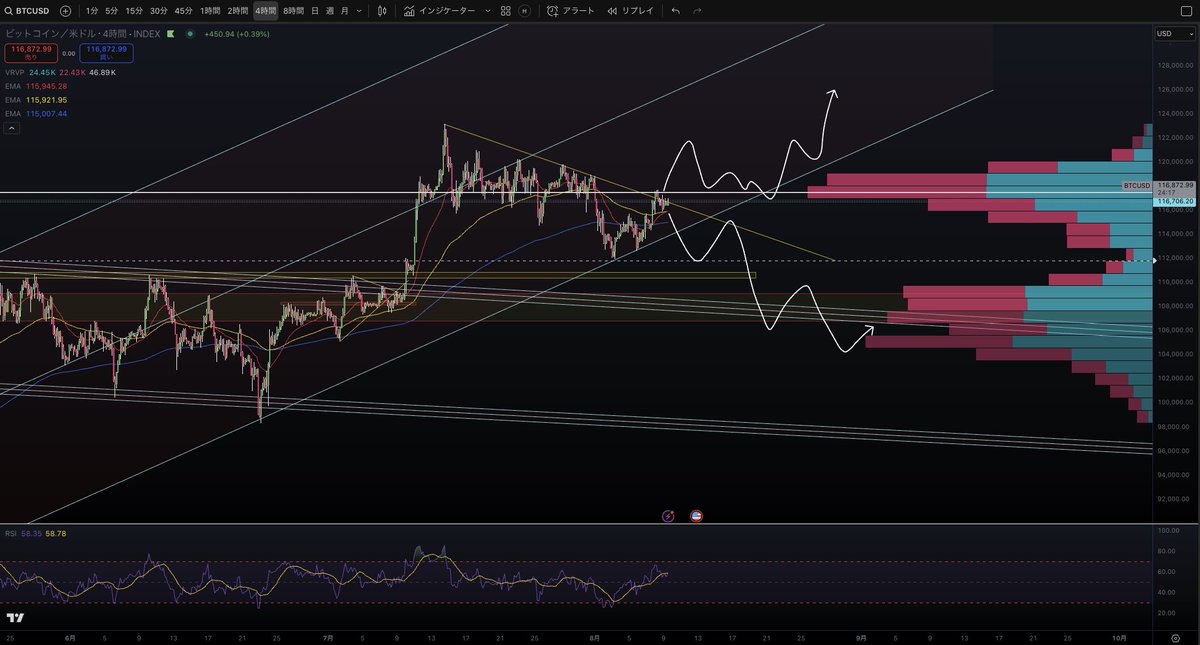
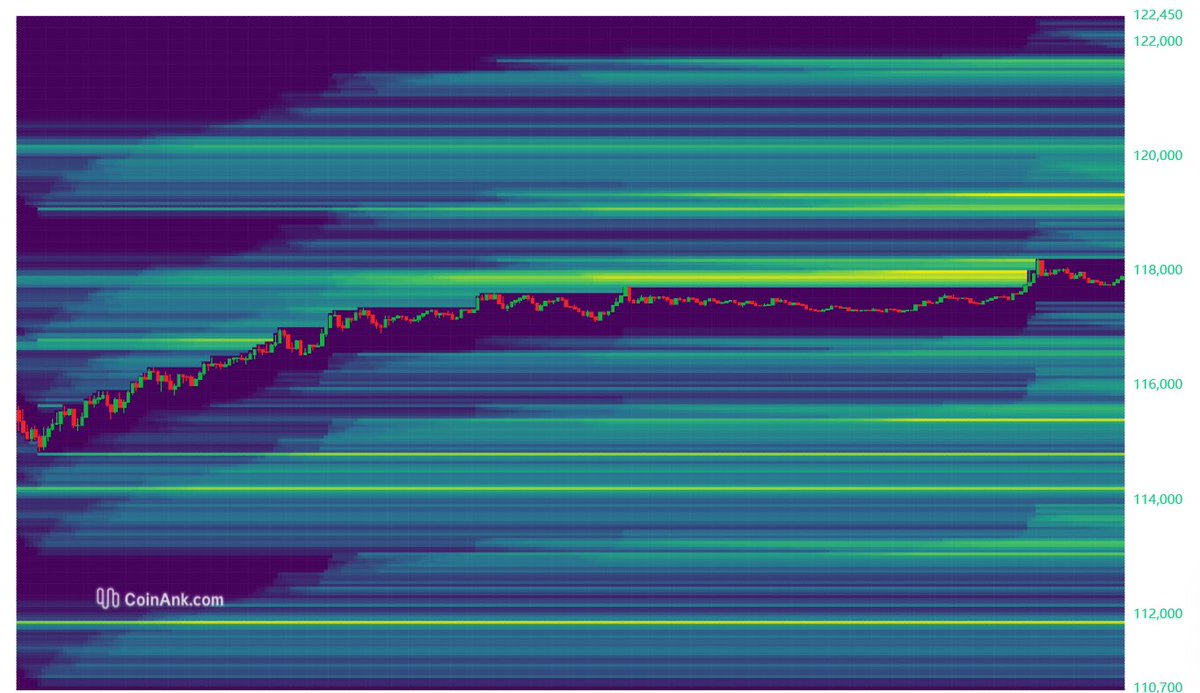
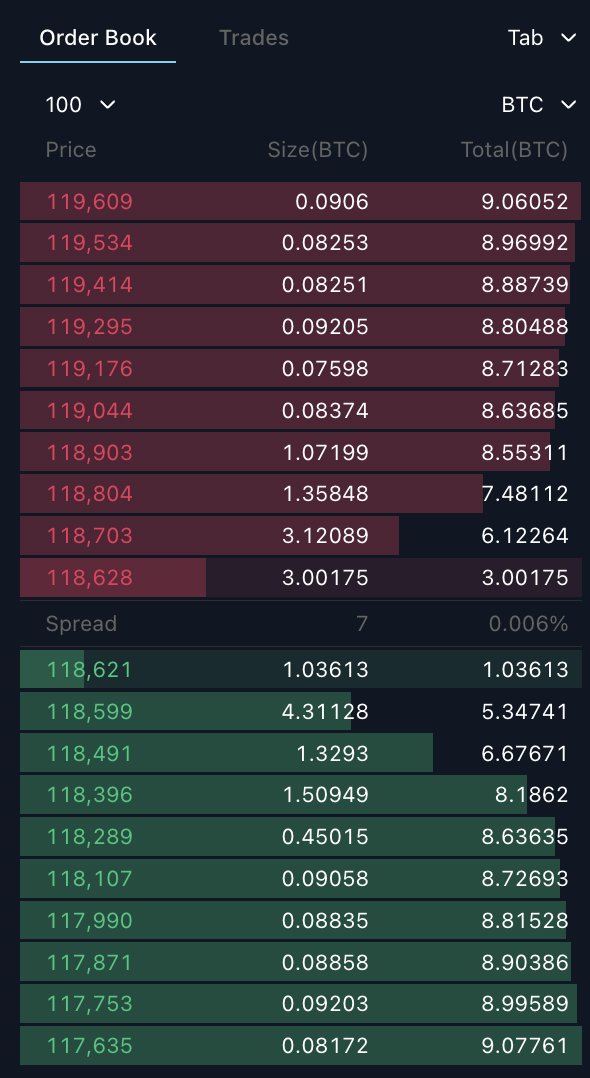
【ガチ分析BTC 分析レポート|現状と今後の展開】
現在BTCは118,000ドル台で小動き。
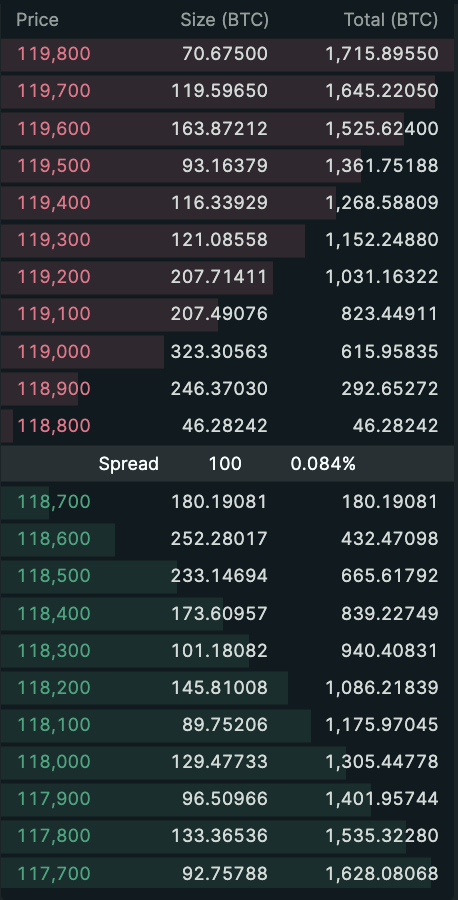
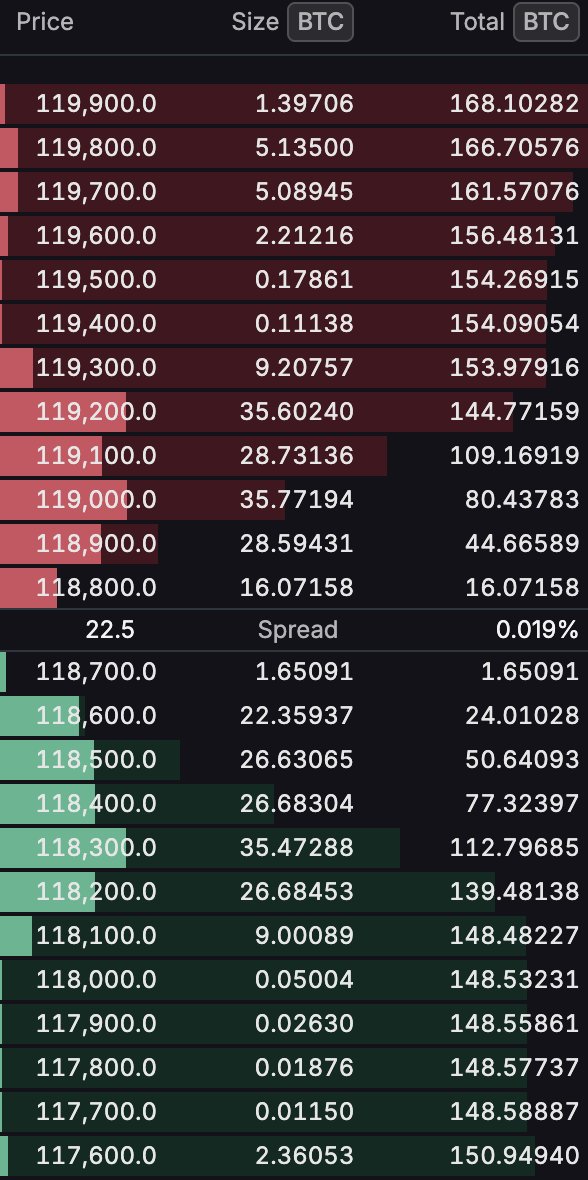
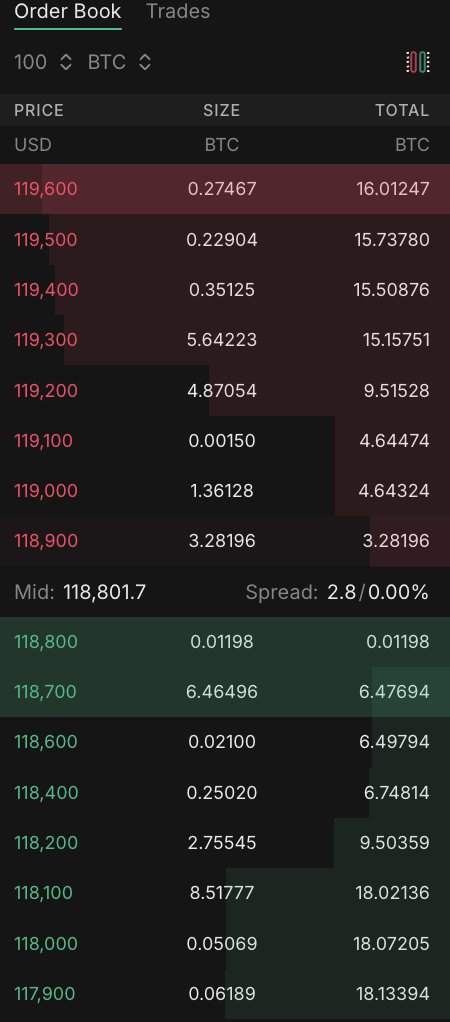
オーダーブックでは118,500〜118,800ドルに厚い売り板、下では117,200ドル付近から買い板が増加。
短期EMAが上値を抑えており、突破できなければ117,000台再訪も。
📌 現状のポイント
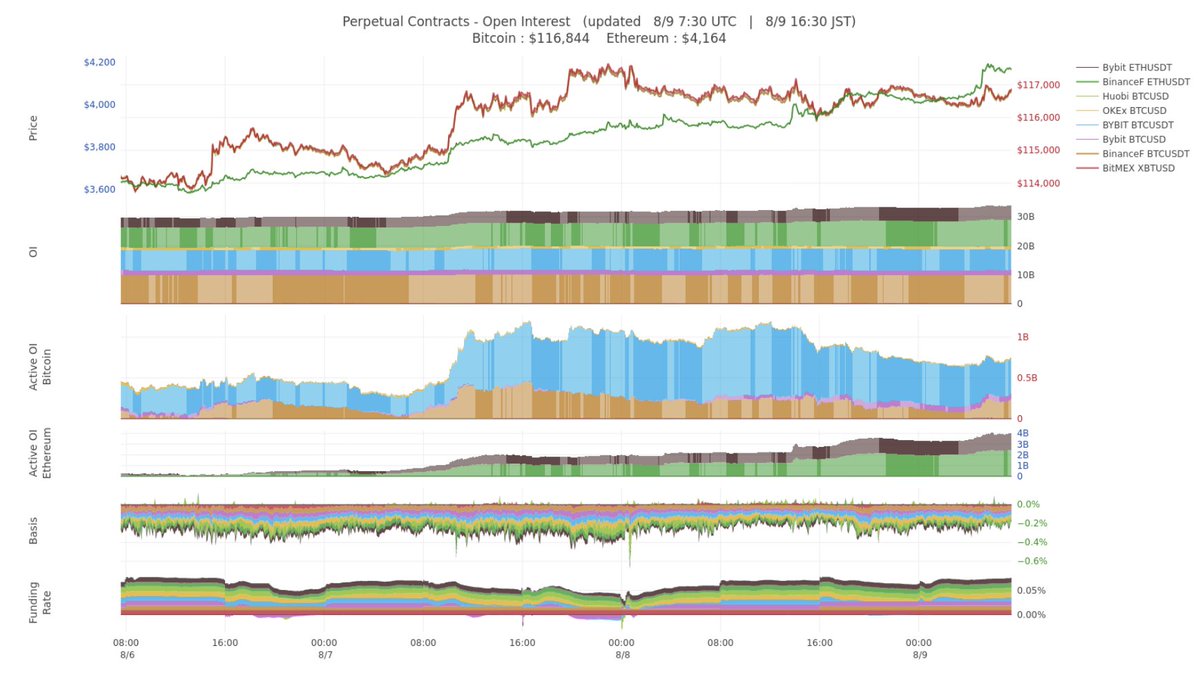
Long/Short比率は依然ロング優勢だが、Binanceでロング比率微減=利確&ポジ調整入り
RSIが短期的に下降 → モメンタム鈍化
板構造はレンジブレイク待ちの形
📊 今後の展開シナリオ
① 強気ブレイク型
118,800突破 → 119,500〜120,000ドルへ短期急伸
② ロング刈り型
上抜け失敗 → 116,500〜116,000ドルまでの急落後に反発
🎯 戦略メモ
板の吸収具合と出来高急増に注目
ブレイク後の追随 or 上値失敗からの逆張りを柔軟に
#BTC #ビットコイン #仮想通貨 #CryptoTrading #OrderbookAnalysis #ロングスクイーズ #トレード戦略 #暗号資産 #マーケット分析 #投資
5
73

26 Jul 2025
📊👀Order book heatmaps are a powerful tool for visualizing market liquidity and key support/resistance levels. This chart helps traders spot areas of high buying and selling interest, making it easier to anticipate potential price movements.
#CryptoTrading #OrderBookAnalysis
3
22

22 Jul 2025
Liquidity is indeed key, but let's break down that order book depth. Tight spreads matter more than you think. #OrderBookAnalysis
22 Jul 2025

the most important thing for an exchange is liquidity
28

16 Jul 2025
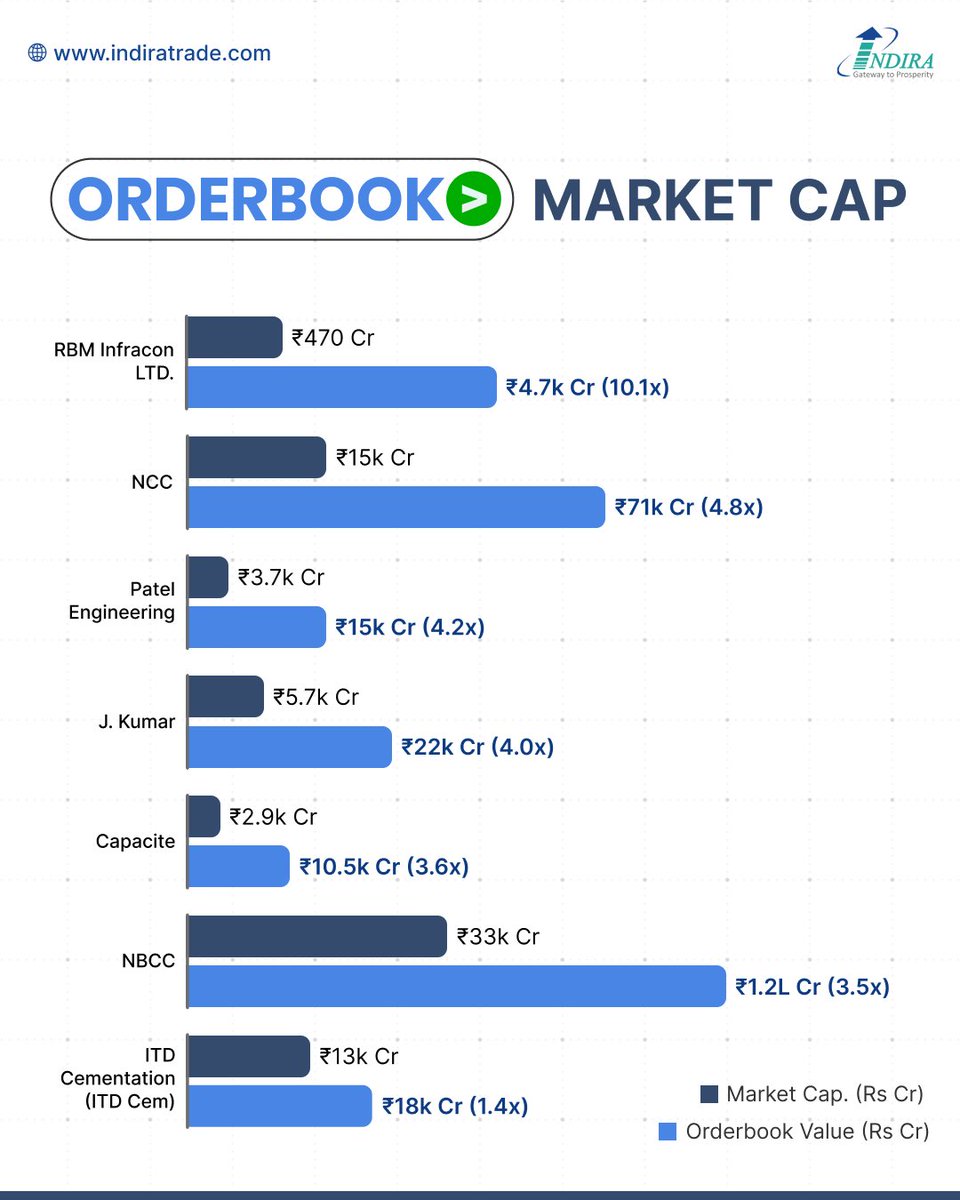
Infra Stocks with Massive Order Books!
Some infra players are sitting on order books multiple times their market cap
🔹 RBM Infracon: 10.1x
🔹 NCC: 4.8x
🔹 Patel Engineering: 4.2x
🔹 J. Kumar: 4.0x
🔹 NBCC: ₹1.2L Cr orderbook!
A high orderbook-to-market-cap ratio can be a sign of growth potential — but also calls for deeper due diligence! Which of these companies is on your watchlist?
#InfraStocks #OrderBookAnalysis #MarketCapVsOrderBook #NBCC #NCC #PatelEngineering #RBMInfracon #Capacite #ITDCementation #JKumarInfra #StockMarketIndia #GrowthStocks #IndiraTrade #EquityResearch #ConstructionSector #IndiaInfra
1
2
880

11 Jul 2025
📘 Top Stocks with Massive Order Books! 💼📊
These companies are sitting on hefty order pipelines—worth tracking for potential growth momentum!
🔹 GRSE – ₹22,680 Cr
🔹 Texmaco Rail – ₹7,115 Cr
🔹 Genus Power Infra – ₹30,110 Cr
🔹 J Kumar Infra (JKIL) – ₹20,500 Cr
🔹 Mazagon Dock – ₹34,750 Cr
🔹 VA Tech Wabag – ₹13,700 Cr
🔹 Bharat Dynamics (BDL) – ₹22,700 Cr
💥 Strong order books = strong revenue visibility.
Which one’s on your watchlist? 👀
#StockMarketIndia #GrowthStocks #OrderBookAnalysis #InvestSmart
1
340

27 Jun 2025
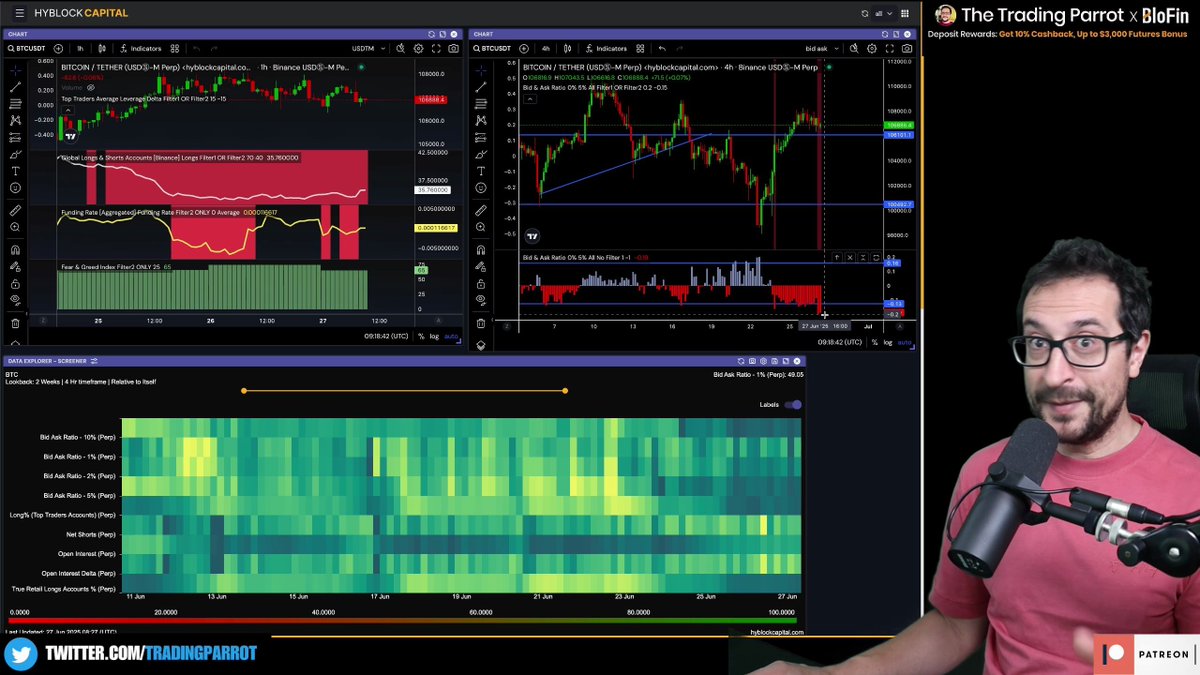
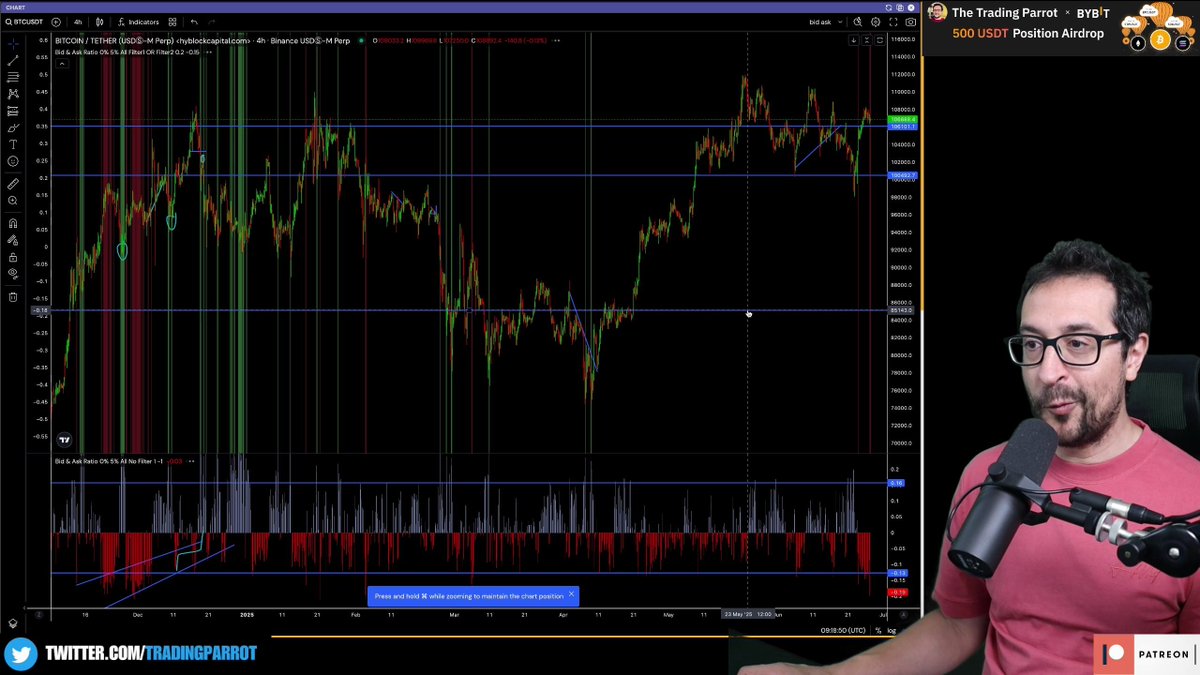
Something's OFF with Friday's order book! 📊
Massive selling pressure detected - ask ratio hitting extreme levels not seen in months!
Local top incoming or weekend rally trap? Analysis inside today's full clip
👉 youtu.be/INXYbi4RVLE?t=1023
#BTC #OrderBookAnalysis #Bitcoin #CryptoSignals #WeekendPump
1
7
617

18 May 2025
📊 LOKY PRICE PREDICTION: Technical Analysis Reveals MASSIVE Breakout Potential 🚀
1/ 🔍 TECHNICAL ALERT: Just completed a comprehensive chart analysis of Loky by Virtuals ($LOKY), and I'm seeing a TEXTBOOK bullish setup with multiple indicators confirming a potential major breakout! Here's my analysis... 🧵 #Technical #Virtuals $VIRTUAL
2/ 📈 PRICE ACTION: $LOKY is showing clear signs of accumulation with higher lows forming over the past week despite market-wide weakness! Current price ($0.00178) represents a strategic entry before the next leg up! #PriceAction
3/ 📊 KEY METRICS: • 24h Volume: $37K (increasing trend) • Buy vs Sell Ratio: 67:46 (59% buy-side dominance) • Buy Volume: $22K vs Sell Volume: $14K (strong inflow) • Makers: 63 active participants (institutional interest) • Net Buy Pressure: $8K in 24h #MarketMetrics
4/ 🔥 MOMENTUM INDICATORS: • 17.01% gain in 6h timeframe • 28.18% surge in 24h window • Both on increasing volume (volume precedes price) • Positive divergence on hourly RSI • Parabolic SAR flip to bullish on 4h chart #TechnicalIndicators
5/ 📉 HISTORICAL CONTEXT: Current price represents a 85% discount from January 2, 2025 ATH of $0.01153, creating an asymmetric risk/reward opportunity with 6.5x upside to previous highs! #AsymmetricOpportunity
6/ 🎯 KEY PRICE LEVELS: • Major Support: $0.00165 • Immediate Resistance: $0.00200 • Mid-term Target: $0.00450 (2.5x) • ATH Retest: $0.01150 (6.5x) • Psychological Barrier: $0.01000 #PriceLevels
7/ 🔄 MARKET STRUCTURE: The current phase shows textbook accumulation characteristics with decreasing sell volume and increasing buy volume - signature pattern before a significant move upward! #MarketStructure
8/ 📱 ORDER BOOK ANALYSIS: Significant buy walls established at $0.00170 and $0.00165, with surprisingly thin selling pressure above $0.00200! Clear path of least resistance is UPWARD! #OrderBookAnalysis
9/ 🌊 VOLUME PROFILE: Notable volume gap between $0.00200 and $0.00400 suggests price could move RAPIDLY through this zone once $0.00200 resistance breaks! Perfect technical setup for a quick double! #VolumeProfile
10/ ⚡ RELATIVE STRENGTH: While $VIRTUAL and the broader market pulled back 9-10% this week, $LOKY has gained 28% showing incredible relative strength and sector rotation into AI intel agents! #RelativeStrength
11/ 🧠 SENTIMENT ANALYSIS: Social volume for $LOKY has increased 215% over the past 72 hours, yet price hasn't fully reflected this increased interest - perfect opportunity before mainstream attention arrives! #SentimentAnalysis
12/ 🔍 WHALE ACTIVITY: On-chain data shows 3 wallets accumulating 12M $LOKY tokens in the past 48 hours without moving price significantly - clear sign of intelligent accumulation! #WhaleActivity
13/ 📉 FIBONACCI RETRACEMENT: Price has perfectly bounced off the 0.618 Fibonacci level ($0.00168) from the January-May move, a key technical level watched by traders! #FibonacciAnalysis
14/ 🌐 VIRTUALS ECOSYSTEM ROTATION: Capital is clearly rotating from general Virtuals ecosystem into specialized agent tokens, with AI intel agents like $LOKY seeing the strongest inflows! #SectorRotation
15/ 🎮 TRADING STRATEGY: I've established a core position at current levels with additional limit buys at $0.00170 and $0.00165 support zones. Taking partial profits at $0.00450 and holding remainder for ATH retest! #TradingStrategy
16/ 🤔 QUESTIONS: What's YOUR read on the $LOKY chart? Are you accumulating at these levels or waiting for confirmation above $0.00200? Share your thoughts below! 👇 #CryptoTA

20