¿Buscas optimizar el rendimiento de tus aplicaciones usando agentes de IA?
En este workshop aprenderás a conectar el Google Chrome DevTools MCP a un agente para automatizar la detección de problemas. Veremos cómo generar reportes automáticos con tres enfoques clave: técnicos, de cliente y de management.
👇 ¡Inscríbete aquí!
#WebPerf#Training#PerfTools#GoogleChrome#AI#MCP
El agente de IA no sabe debuggear rendimiento si tú no le das el contexto para hacerlo.
No es que sea malo. Por defecto trabaja a ciegas: sin acceso al navegador, sin trazas reales.
#WebPerf#Performance#AIAgents#ChromeDevTools#Frontend
ALT Banner promocional de un workshop titulado “Web Performance Debugging with AI Agents Chrome DevTools MCP”. La imagen muestra una interfaz futurista con gráficos de rendimiento web, líneas de tiempo y métricas como LCP, INP y CLS conectadas a bloques etiquetados “MCP”, “API” y “AI”. A la derecha aparecen fragmentos de código y elementos visuales de análisis técnico sobre un fondo oscuro con tonos azules y verdes.
I built a tool to run performance audits without touching DevTools
Paste a URL → get a structured report. Fonts, images, CSS overhead, LCP Subparts, TTFB
Pro accounts get full history to track improvements over time
perf.reviews/insights#WebPerf#CoreWebVitals#PerfTools
Many thanks to Codemotion for giving me the opportunity to continue sharing my knowledge on web performance (aka improving the UX of our products), and to do so in a workshop format where we use Chrome DevTools MCP to identify performance issues on a website with AI agents.
Here is the repository containing the self-guided workshop github.com/nucliweb/webperf-…. If you have any questions, please feel free to contact me or open an issue.
#WebPerf#PerfTools#DevTools#CodemotionMadrid
Photo by @cesalberca
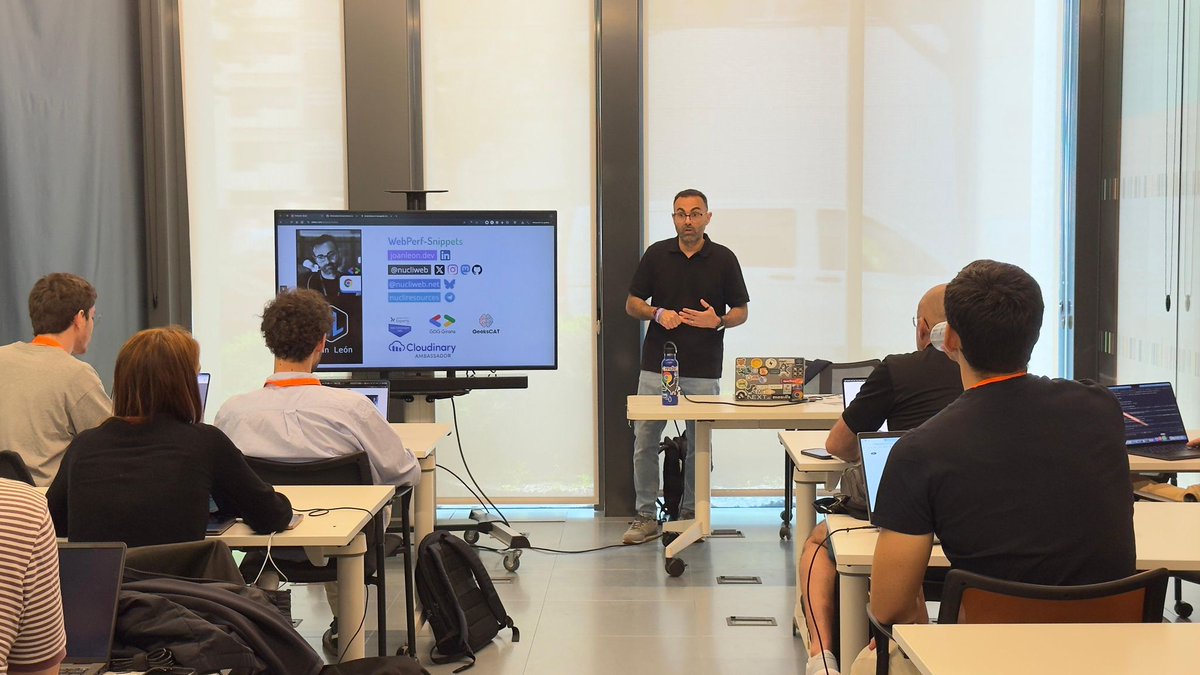
ALT Joan León stands at the front of a classroom giving a presentation to a small group of seated attendees. He gestures while speaking beside a large screen displaying slides about web performance. The audience, some using laptops, face him attentively in a modern, well-lit room with large windows.
🚀 New WebPerf Snippet published!
Detects potential performance issues with `rel="prefetch"` resource hints by analyzing quantity, size, type, and appropriateness of prefetched resources.
webperf-snippets.nucliweb.ne…#WebPerf#WebPerfSnippet#PerfTools
📣 New WebPerf Snippet
CSS Media Queries Analysis
Analyze all @media rules in CSS stylesheets to identify classes and properties targeting viewports bigger than a specified breakpoint (default: 768px). Results are grouped by inline CSS and external files, with byte size estimates for potential mobile savings.
#WebPerfSnippets#WebPerf#PerfTools
ALT A browser window showing the Renfe website on the left with a mobile-style layout, including a menu button, the Renfe logo, travel selection fields, and a Black Friday banner. On the right, Chrome DevTools is open to the Console tab, displaying a CSS Media Queries Analysis report. The report lists totals for media queries, classes, and properties, highlights estimated mobile CSS savings of 284.83 KB, and breaks down inline and external CSS statistics.
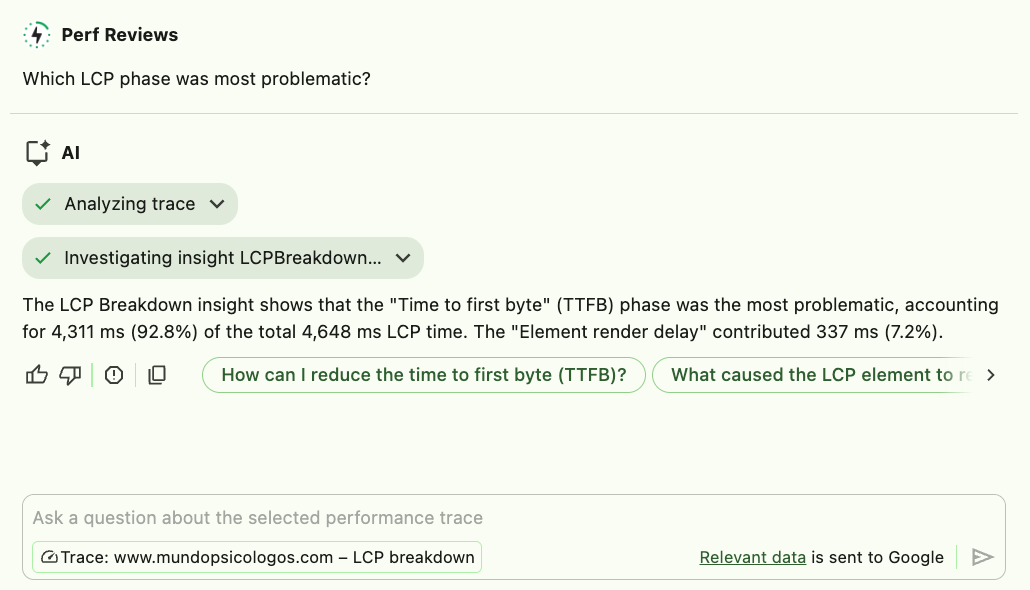
ALT A screenshot of a performance review interface titled “Perf Reviews” with the question “Which LCP phase was most problematic?” An AI assistant response shows analysis results indicating that the “Time to first byte (TTFB)” phase contributed 4,311 ms (92.8%) of the total 4,648 ms Largest Contentful Paint time, while “Element render delay” contributed 337 ms (7.2%). Below the response are action buttons such as “How can I reduce the time to first byte (TTFB)?” and “What caused the LCP element to render slowly?”
I have just updated the WebPerf Snippet "Find non Lazy Loaded Images outside of the viewport" to list images outside the viewport that do not have loading="lazy". Now it also shows us:
- Total number of images without lazy loading
- Total file size of all images
- Individual image details: URL, resolution (naturalWidth x naturalHeight), and file size
#WebPerf#WebPerfSnippets#PerfTools#Performance
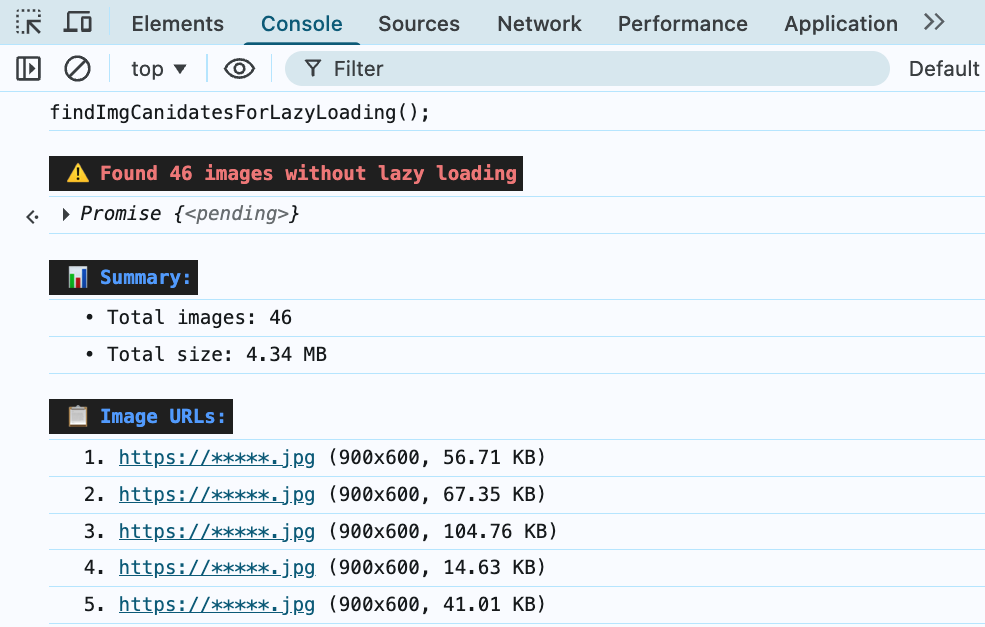
ALT Chrome DevTools Console showing lazy loading audit results: 46 images without lazy loading detected, totaling 4.34 MB, with a list displaying the first 5 images showing their resolution (900x600) and individual file sizes ranging from 14.63 KB to 104.76 KB.
ALT A collection of white rounded rectangular stickers displaying 'WebPerf Snippets' text in a gradient from blue to teal. Seven stickers are fanned out in a cascading arrangement on a dark gray textured surface, with one sticker placed separately to the right.
☀️💻 Saturday Morning Code Sessions with P-OPS Team 💻☀️
🧪 Mini-Lab: Validator Process Heat Maps
👨💻 For validators and infra ops tuning CPU balance.
🧩 A single hot thread can mask unbalanced workloads and trigger missed consensus events.
☕️ This morning we’ll visualise process-level CPU heat and pinpoint saturation early.
🔎 Step 1 — Identify top CPU consumers
𝚝𝚘𝚙 -𝚘 𝚌𝚙𝚞 -𝚊 | 𝚑𝚎𝚊𝚍 -𝟸𝟶
🔎 Step 2 — Trace per-thread usage of your validator process
𝚝𝚘𝚙 -𝙷 -𝚙 $(𝚙𝚒𝚍𝚘𝚏 -𝚜 𝚟𝚊𝚕𝚒𝚍𝚊𝚝𝚘𝚛)
🔎 Step 3 — Generate live heat map for kernel scheduling
𝚜𝚞𝚍𝚘 𝚙𝚎𝚛𝚏 𝚝𝚘𝚙 -𝚎 𝚌𝚢𝚌𝚕𝚎𝚜 -𝚐
🔎 Step 4 — Measure core distribution
𝚝𝚊𝚜𝚔𝚜𝚎𝚝 -𝚌 -𝚙 $(𝚙𝚒𝚍𝚘𝚏 -𝚜 𝚟𝚊𝚕𝚒𝚍𝚊𝚝𝚘𝚛)
🔎 Step 5 — Pin validator to specific cores if uneven
𝚝𝚊𝚜𝚔𝚜𝚎𝚝 -𝚌 0,1,2,3 $(𝚙𝚒𝚍𝚘𝚏 -𝚜 𝚟𝚊𝚕𝚒𝚍𝚊𝚝𝚘𝚛)
🧠 Mini Lesson
CPU heat balance matters — one hot thread can throttle validation performance while others idle. Equal distribution keeps latency low and block timing stable.
💡 Delegators & Newcomers
Think of it like an orchestra — one musician overplaying throws the whole rhythm off. Balanced cores = balanced consensus.
☎️ Stay Secure with P-OPS Team
🌍 pops.one
🌿 linktr.ee/p_opsteam
🐦 x.com/POpsTeam1
📡 t.me/POPS_Team_Validator
👾 discord.gg/jJ8aaMwPwa#SaturdayMorningCode#ValidatorOps#LinuxTips#POPSteam#PerfTools#CPUOptimisation#ConsensusFlow#NodeOps
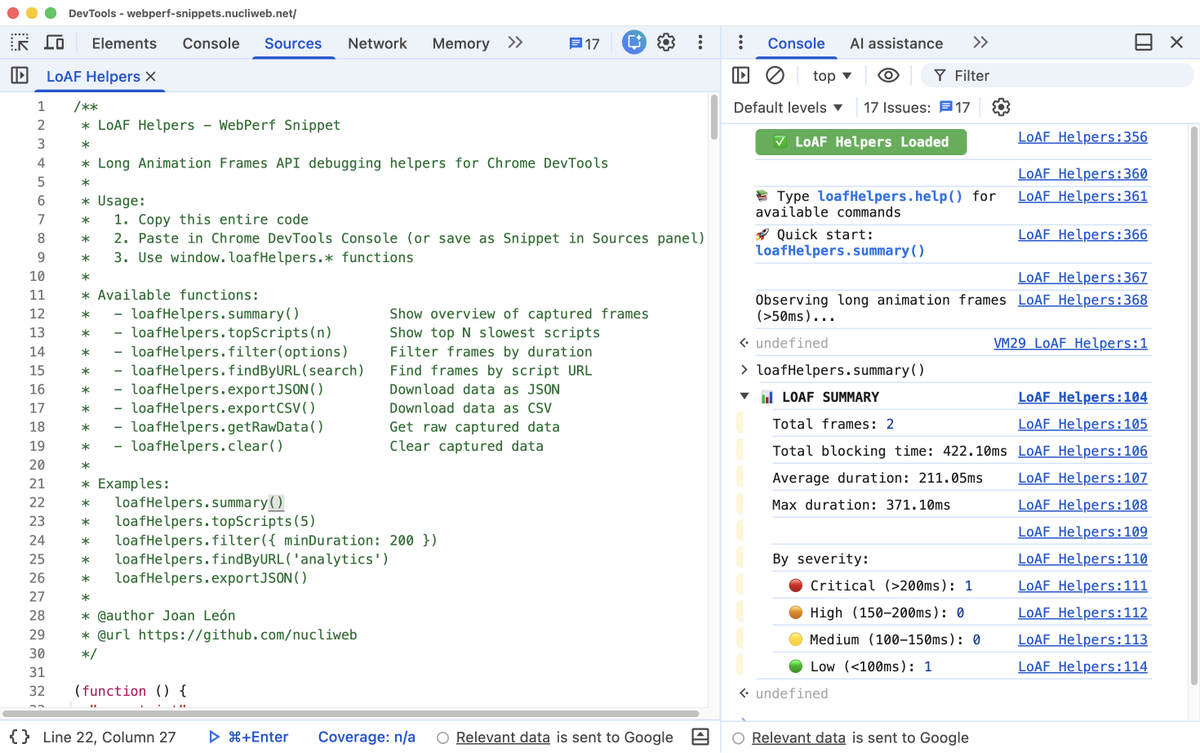
ALT Screenshot of Chrome DevTools showing a JavaScript snippet named “LoAF Helpers” in the Sources panel. The snippet provides debugging helpers for the Long Animation Frames API with usage instructions and function examples. On the right, the Console panel displays logs indicating “LoAF Helpers Loaded” and a summary report from loafHelpers.summary() showing metrics such as total frames (2), total blocking time (422.10ms), average duration (211.05ms), and frame severity levels (critical, high, medium, low).