

Cara Tambahkan Sheets Otomatis dengan PIVOTTABLE #Excel #Sheetsotomatis
2
14

Jun 12
Week 4 of EXCEL101 was the week students stopped cleaning data manually and started building systems.
Up until now, we had been working with datasets that were already structured enough to analyze.
This week introduced a different reality:
Data rarely arrives analysis-ready.
It comes from different files, different teams, different systems, and often in different formats.
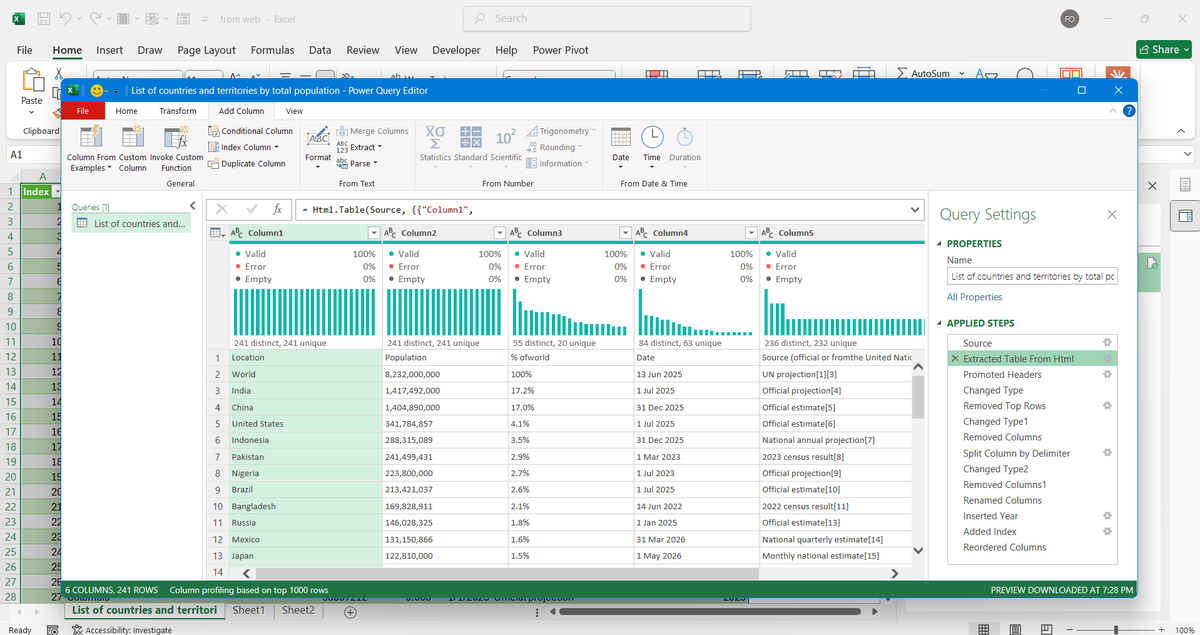
That's why we spent the week learning "Power Query" — Excel's built-in data transformation engine.
And once students saw what it could do, the conversation changed.
We started with the concept of ETL:
Extract – Bring data in from external sources.
Transform – Clean, standardize, reshape, and enrich the data.
Load – Push the refined dataset into Excel for reporting and analysis.
The most important lesson wasn't the buttons.
It was understanding that Power Query doesn't change your original data.
Every transformation becomes a recorded step.
Fix it once.
Refresh forever.
That's a completely different way of working.
For the practical session, students worked with multiple CSV files based on regional sales data.
The datasets were intentionally messy.
Different date formats.
Inconsistent name formats.
Extra spaces.
Blank rows.
The kind of problems analysts deal with every day.
Step by step, students learned how to:
* Remove blank rows
* Fix incorrect data types
* Standardize text fields
* Create calculated columns
* Generate date-based attributes
* Load clean datasets back into Excel
The highlight for many students was "Appending".
Instead of manually copying and pasting multiple reports into one sheet, they combined separate datasets into a single master table using Power Query.
More importantly, they learned the principle behind it:
Automation only works when structure is respected.
If column names, formats, and data types are inconsistent, automation breaks.
If the structure is right, the process scales.
From there, we moved into "Data Modeling concepts".
Students were introduced to Fact and Dimension tables and the idea that not all data belongs in one giant spreadsheet.
We discussed:
* Fact Tables (transactions and measurable events)
* Dimension Tables (descriptive information)
* Primary Keys
* Foreign Keys
These concepts laid the foundation for one of the most important topics of the week:
Merge.
Many students initially saw Merge as another lookup feature.
By the end of the session, they understood that it is much more than that.
Append adds rows.
Merge adds context.
Append is vertical.
Merge is relational.
We explored different join types and discussed why choosing the wrong join can change the results of an analysis without generating an error.
That insight alone was worth the session.
Then came the assignment.
Students received data from a fictional logistics company containing shipment transactions, customer information, route details, and driver records.
Their task was to:
* Clean and standardize the shipment data
* Merge multiple dimension tables into the fact table
* Create new calculated fields
* Build KPI summaries
* Develop PivotTable reports and charts
* Answer business questions using the transformed dataset
The objective wasn't simply to build reports.
It was to create a repeatable workflow that could handle changing data.
That's what analysts do.
They don't just analyze data.
They design processes that make analysis possible.
Week 4 introduced that mindset.
And with Power Query now in place, students are beginning to see Excel as more than a spreadsheet application.
They're starting to see it as a complete data transformation and reporting platform.
Next up: Power Pivot, Data Modeling, DAX, and KPI Reporting.


1
10
59
2,070
The Mayor of Okeogun retweeted

Jun 12
1.
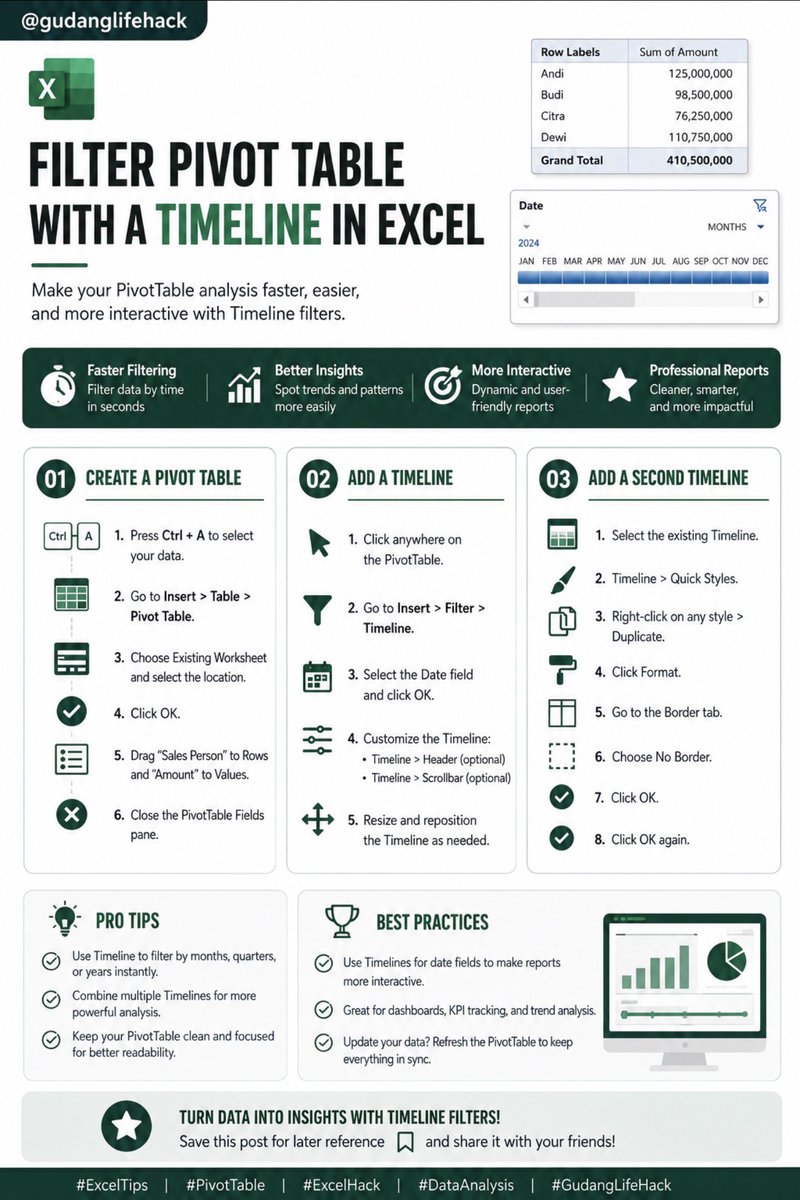
Step 1: Create a PivotTable
✅ Select your dataset (Ctrl A)
✅ Insert → Table → PivotTable
✅ Choose your worksheet
✅ Add:
• Rows → Sales Person
• Values → Amount
A well-built PivotTable is the foundation of fast reporting.
1
4
12
1,045
Jun 12
2.
Step 2: Add a Timeline
Click inside your PivotTable.
Go to:
Insert → Filter → Timeline
Select your Date field and press OK.
Now you can filter data by time without complicated dropdown menus.
1
369

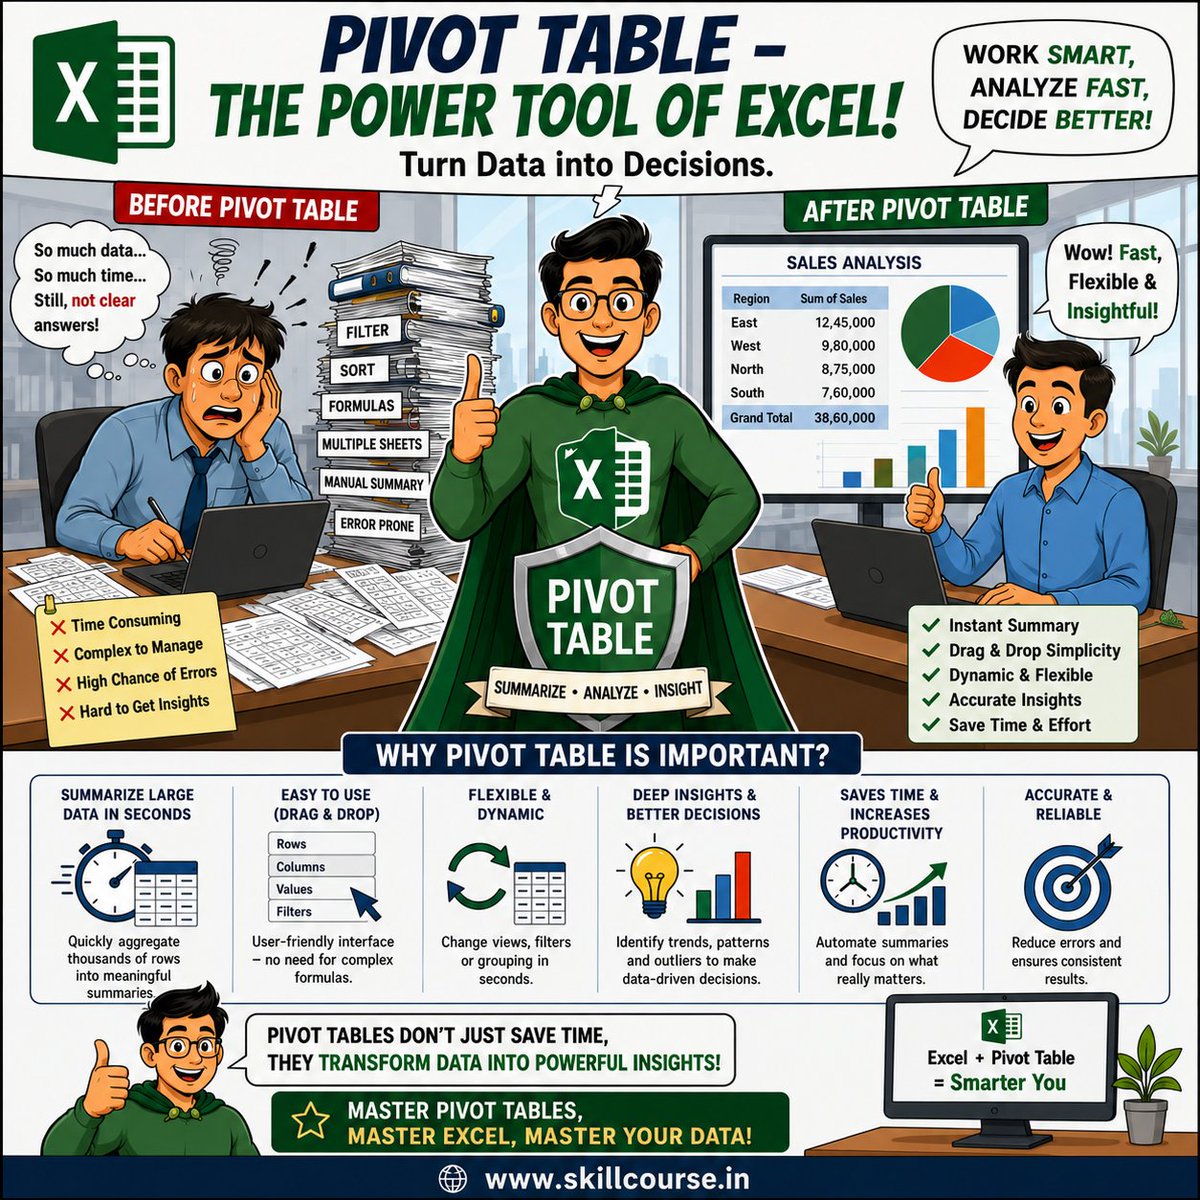
Turn Raw Data into Smart Decisions with Excel Pivot Tables!
From summarizing thousands of rows in seconds to uncovering trends, insights, and patterns, Pivot Tables make data analysis faster, easier, and more accurate.
#Excel #PivotTable #DataAnalysis #Productivity #MSExcel
1
8
Jun 10
Excel Consolidate does not automatically update when the source data changes. This is the main limitation of the feature.
Brief Explanation:
The Consolidate feature only copies and summarises data when the command is executed. After that, the result becomes static. If the source data changes, you must run Consolidate again manually. There is no Refresh button like in PivotTable or Power Query.
Recommendation for Daily Report:
For daily reports that need to be updated every day, Consolidate is not ideal.
A much better alternative is Power Query, because it can instantly refresh automatically every time the source data changes. In addition, PivotTable also supports automatic updates quickly.
Conclusion:
Use Consolidate only if the report is very simple and rarely changes. For dynamic daily report needs, Power Query is the most professional and efficient choice today.
1
3
642
Jun 9
Phase 3: The Insight Revelation (The PivotTable Story)
The final test is the most critical: turning those thousands of rows into an actionable business decision. The hiring manager asks, "Which product lines should we discontinue next quarter?"
1
27

Stop Using XLOOKUP! Build Excel Reports with Power Pivot & DAX
#Excel #PowerPivot #DAX #XLOOKUP #PivotTable #ExcelTutorial #DataModel #MicrosoftExcel #ExcelTips #BusinessAnalytics #ExcelForBeginners #Dashboard #DataAnalysis #EasyClickLearning
youtu.be/JGlrCGJh_Gs
25
remand chic retweeted

Jun 9
The only PivotTable I should be focusing on is pivoting through the door of the pub to a table full of delicious pints
1
5
37
3,404

Jun 9
10 Minuten pro Bericht durch 'PivotTable Pro' gespart - der Dank an Automation ist groß. Aber durchqueren 031 Kommentare? Niemals Zeitverschwendung. Wie much Zeit sparen Sie durch Tools?
5
Jun 9
Notable shortcuts include Alt = for AutoSum, Alt H V V for paste values only, Alt ; to select visible cells only, and Alt N V T to quickly insert a PivotTable.
1
1
644

Jun 8
mac kayanya gabisa setting pivottable data models ya? jadi gabisa pivotnya setting distinc count?
1
288