
11 Jul 2025
#LSPPDay40
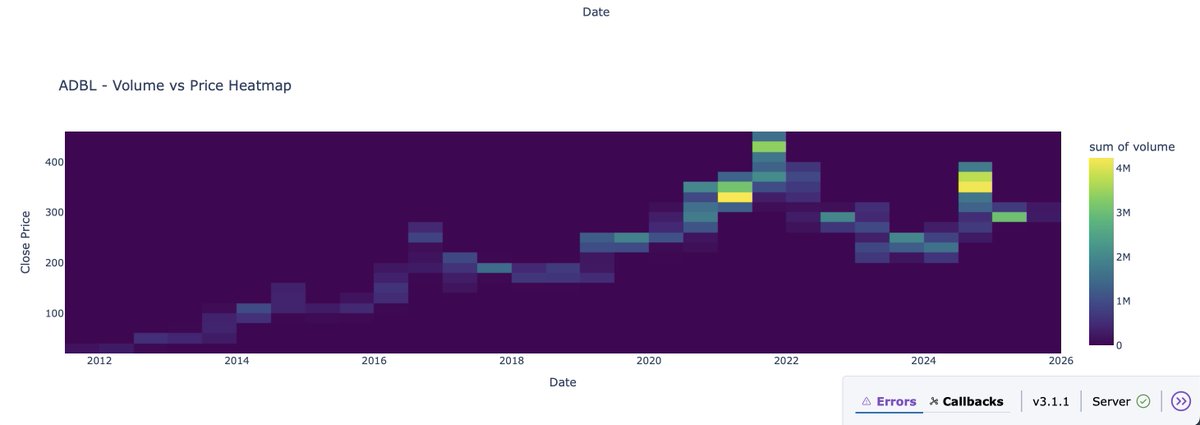
Tried out Flask and experimented with Dash on some new data
Just basic visualization using plotlyexpress.
@lftechnology
#60DaysOfLearning2025 #LearningWithLeapfrog
3
45

18 Nov 2024
Plotly便利だな。Plotly Expressなら習得コストもさほどだし。
令和時代のPython作図ライブラリのデファクトスタンダードPlotlyExpressの基本的な描き方まとめ qiita.com/hanon52_/items/d8c… #Qiita
22
282
19,602

3 Oct 2024
読んだ
令和時代のPython作図ライブラリのデファクトスタンダードPlotlyExpressの基本的な描き方まとめ qiita.com/hanon52_/items/d8c… #Qiita
1
3
169

27 Apr 2024
🎥[Stock Markets Analytics Zoomcamp] Module 2: "Working with Data in Pandas" is now published👉
youtube.com/watch?v=__vCqFea… #Stock #algorithmictrading #DataAnalysis #Python #Numpy #Pandas #Matplotlib #Seaborn #PlotlyExpress #DataManipulation #TaLib #PredictiveAnalysis #DataCleaning
2
184

18 Feb 2023
Python’s One Liner graph creation library with animations Hans Rosling Style
Read more 👉 bit.ly/3sV9foK
#AwesomeVisualizations #PlotlyExpress #Datascience #Machinelearning #Statistics #Python
2
161

25 Dec 2022
openAIすげーっす。
日本の50年から70年までの人口推移をPlotly Express使ってグラフにしてとお願いして、少しやりとりした結果
ちなみに私のスペック。python初心者、プログラミングから10年離れてます。
まじで一気にスキルアップしたわ(笑)
#OpenAI
#Playground
#plotlyExpress
1
2
180

🚨 Cheat sheet ➡️ Data Visualization with Plotly Express
#PlotlyExpress is a high-level data visualization package. Our guide teaches you code patterns for creating plots, how to harness interactive controls, and more.
Enjoy 🙏 Download here 👉 bit.ly/3VceZHd
1
5
28

5 Aug 2022
Plotly @ProjectJupyter = 💕 Curious how to create a #PlotlyExpress graph with #jupyternotebook and Dash Enterprise Workspaces? 📽️ Check out this 2-minute video from Plotly Sales Engineer, @elliot_j_g !
1
10

14 Jun 2022
data visualization. matplotlib, plotly, plotlyexpress… i just need to create some simple charts 😭
2
4
27 May 2022
Python’s One Liner graph creation library with animations Hans Rosling Style
Read more 👉 bit.ly/3sV9foK
#AwesomeVisualizations #PlotlyExpress #Datascience #Machinelearning #Statistics #Python
3
12 Mar 2022
Python’s One Liner graph creation library with animations Hans Rosling Style
Read more 👉 bit.ly/3sV9foK
#AwesomeVisualizations #PlotlyExpress #Datascience #Machinelearning #Statistics #Python

1
1
1 Mar 2022
Python’s One Liner graph creation library with animations Hans Rosling Style
Read more 👉 bit.ly/3sV9foK
#AwesomeVisualizations #PlotlyExpress #Datascience #Machinelearning #Statistics #Python

2
3
25 Feb 2022
Python’s One Liner graph creation library with animations Hans Rosling Style
Read more 👉 bit.ly/3sV9foK
#AwesomeVisualizations #PlotlyExpress #Datascience #Machinelearning #Statistics #Python
2
2


27 May 2021
500LGTM! | 令和時代のPython作図ライブラリのデファクトスタンダードPlotlyExpressの基本的な描き方まとめ by @hanon52_ bit.ly/3bWlDgx
5

I do so much visualisation work - always with #plotly and #plotlyexpress. So straight forward and well documented.
I can see I'm missing out by not using #dash as well
#plotlylove
2

20 Feb 2021
Extending @knime and #Python Integration with @plotlygraphs Express and Kaleido by @CWInsights
#KNIME #PlotlyExpress #DataAnalytics #dataviz #kaleido #plotly #pythoncode
towardsdatascience.com/exten…
4
10

15 Dec 2020
Beauutiful remake 🤩. #PlotlyExpress
15 Dec 2020

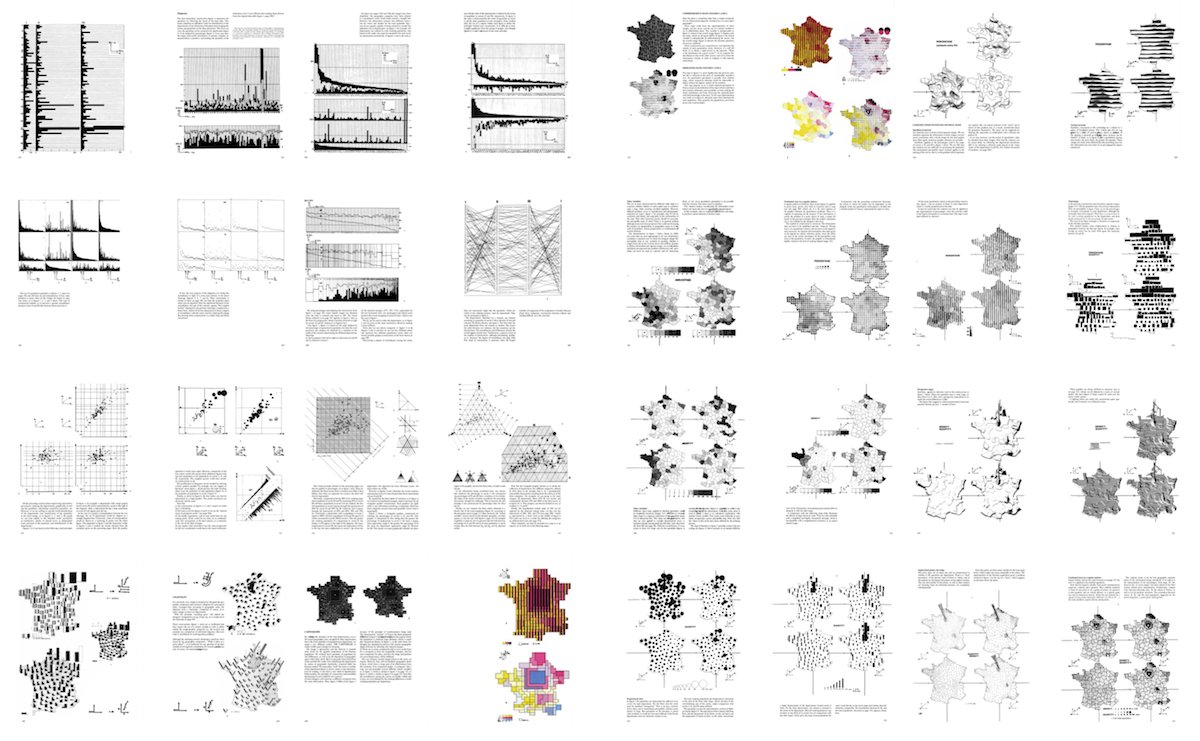
A personal project: revisiting figures from a 1967 book which has had a big influence on how I (and others!) think about data visualization, Jacques Bertin's Semiology of Graphics. nicolas.kruchten.com/semiolo…
2

9 Dec 2020
令和時代のPython作図ライブラリのデファクトスタンダードPlotlyExpressの基本的な描き方まとめ qiita.com/hanon/items/d8cbe2… #Qiita
PlotlyはSeabornでできること大体できて、インタラクティブなグラフをhtmlで吐き出せるから、そろそろ移行したいんですよね
2

4 Dec 2020
Next Weds, @CarlosFMorenoG will present on #dataviz in #Python. In this online talk he will speak about tools and approaches and how to critically assess dashboards and infographics by means of Python modules such as #Pandas and #PlotlyExpress.
Tickets: pythonaberdeen.github.io/
4
9