
Jun 13
Master ggplot2 & R for publication-ready biology visuals! 📊🧬 Join @OmicsLogic's 3-Day Hands-On Workshop on R Programming for Omics Data Analysis.
🔹Map gene expression & clinical data No prior coding required!
🚀Register: forms.gle/kARjd4o5g71T3ZrL7
#RProgramming #Bioinformatics

1
2
48
Jun 12
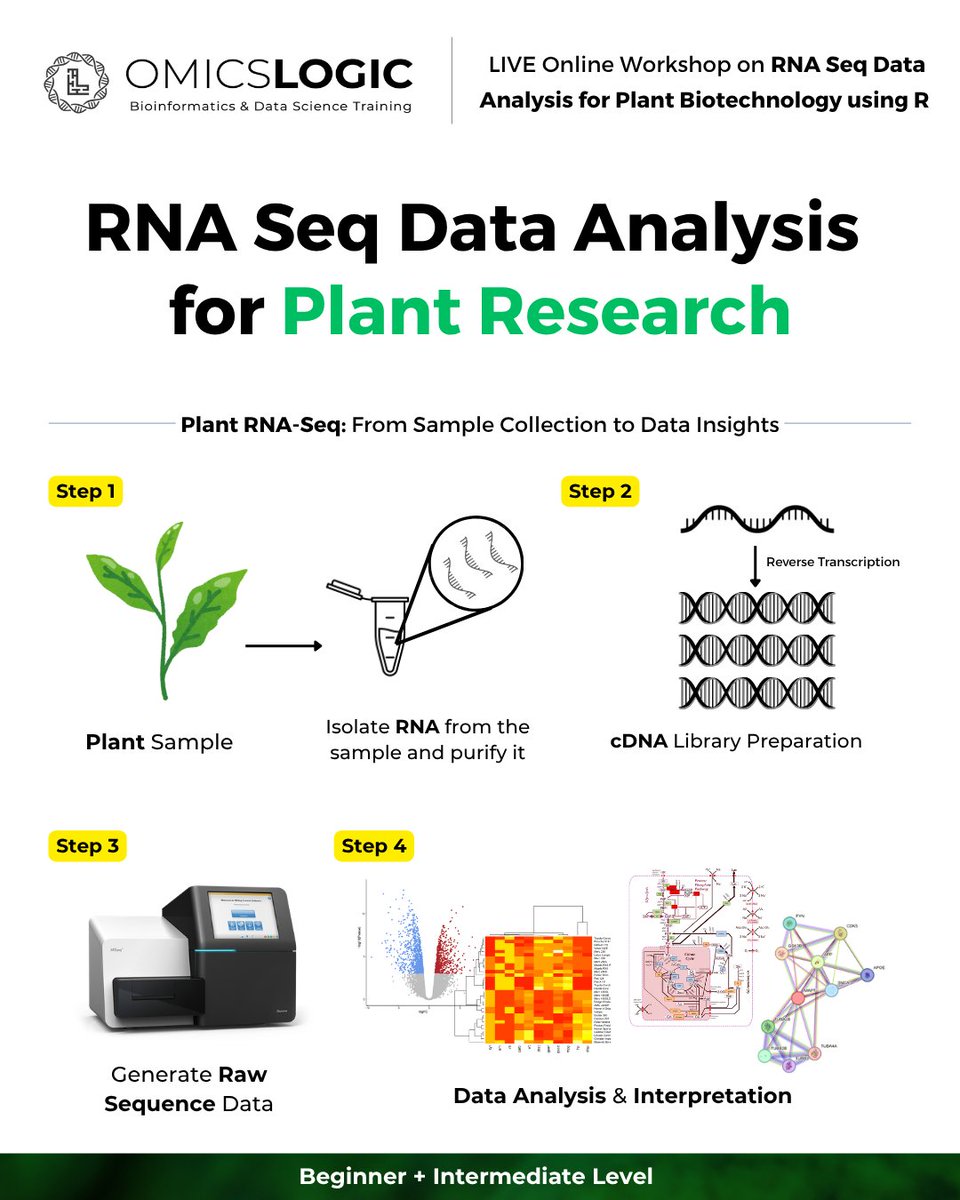
🌱 Unlock plant transcriptomics! Join our 4-day live workshop on Plant RNA-Seq Data Analysis with R Programming to master end-to-end workflows for plant stress research.
🔗 Register: forms.gle/4bSsNJhZSLhVKsWG7
#Bioinformatics #RNASeq #PlantScience #RProgramming
1
2
35
Jun 11
🌱 Master Plant RNA-Seq! Join our 4-day live workshop (July 20–23) to analyze plant stress data using R programming, DESeq2, edgeR, and pathway enrichment.
🔗 Register: forms.gle/4bSsNJhZSLhVKsWG7
#Bioinformatics #RNASeq #PlantScience #RProgramming

1
36
Jun 10
🚀 Master Bioinformatics with the OmicsLogic Biomedical Data Science Using R Program! 🧬📊
From data visualization to Machine Learning & Single-Cell RNA-seq, gain hands-on skills for modern research.💻
🔗 Register now: forms.gle/Bz6HndM8pXyZvBvs9
#Bioinformatics #RProgramming

1
1
41
Jun 8
💬 Which bioinformatics topic would you like us to cover next?
#OmicsLogic #Bioinformatics #Genomics #Proteomics #ComputationalBiology #DataScience #MachineLearning #ArtificialIntelligence #ClinicalResearch #LifeSciences #RProgramming #Research
17

Jun 6
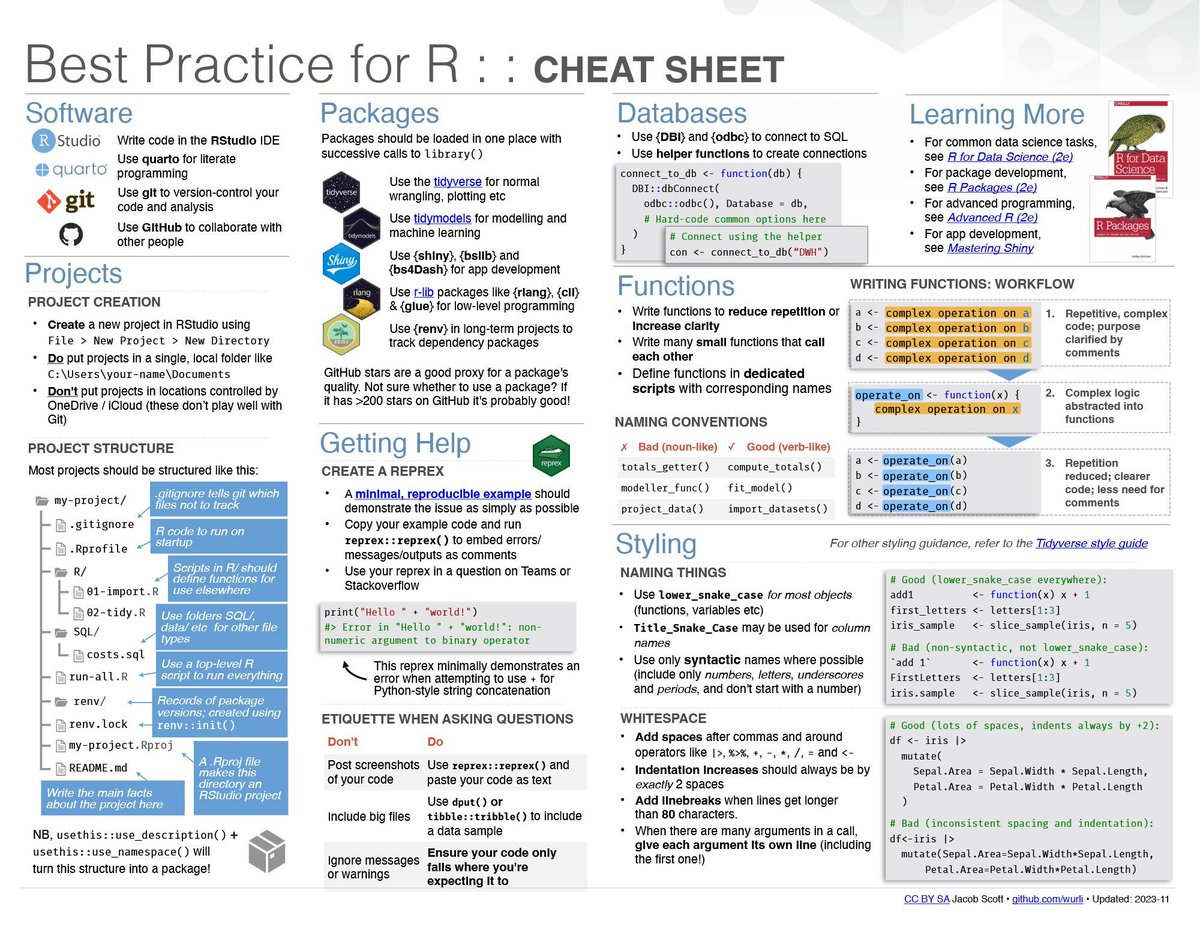
Recently found this excellent R best practices cheat sheet by Jacob Scott.
It provides a very practical overview of how to write cleaner, more reproducible, and more maintainable R code, including topics such as:
🔹 Project structure
🔹 Package management
🔹 Reproducible examples
🔹 Function workflows
🔹 Naming conventions
🔹 Styling guidelines
🔹 Database connections
🔹 Git & version control
You can find the original cheat sheet here: github.com/wurli/r-best-prac…
I have also recently published a new module in the Statistics Globe Hub on practical best practices in R programming. In this module, I cover topics such as reproducibility, script organization, pipelines, vectorized programming, and writing reusable functions in R.
The Statistics Globe Hub is an ongoing learning program on statistics, data science, AI, and programming with R and Python, with new hands-on modules released every Monday.
More info: statisticsglobe.com/hub
#rstats #datascience #programming #statistics #rprogramming #statisticsglobehub
4
30
142
4,122

Jun 2
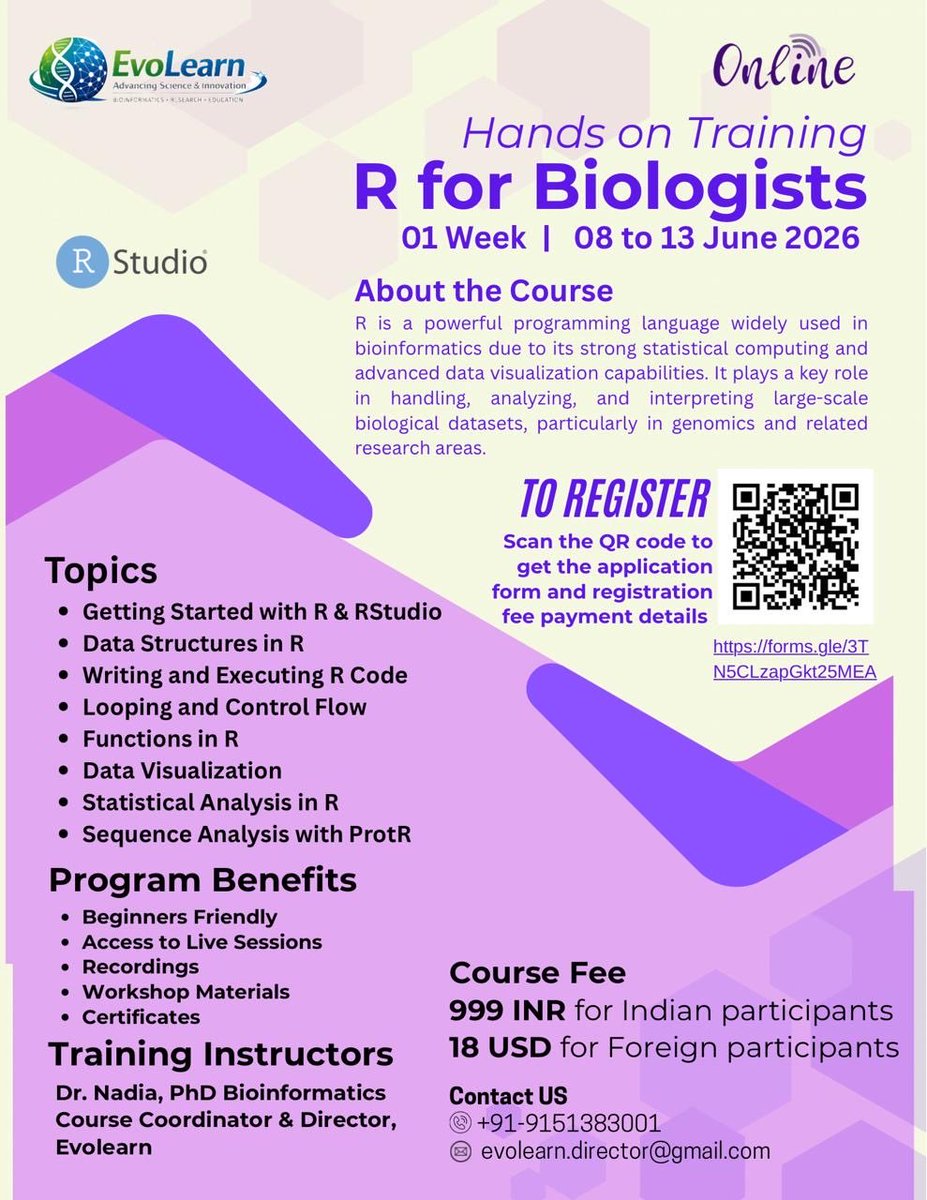
📢 Online Hands-on Training: R for Biologists 🧬
📅 Dates: 08 – 13 June 2026
🌐 Mode: Online
💰 Course Fee:
🇮🇳 999 INR (Indian participants)
🌍 18 USD (International participants
Scan the QR code or register here:
lnkd.in/gek8pBnP
#RProgramming #Bioinformatics #EvoLearn
4
10
253

🚀 Inicia en el mundo del análisis y visualización de datos con R.
Participa en el taller:
📊 “Análisis de datos y creación de gráficos en R para principiantes”
🔗 nnb.unam.mx/EBM2026/analisis…
#EBM2026 #RProgramming
@ccg_unam @lcgunam @RLadiesCuerna @RBioinformatica

4
24
878

May 22
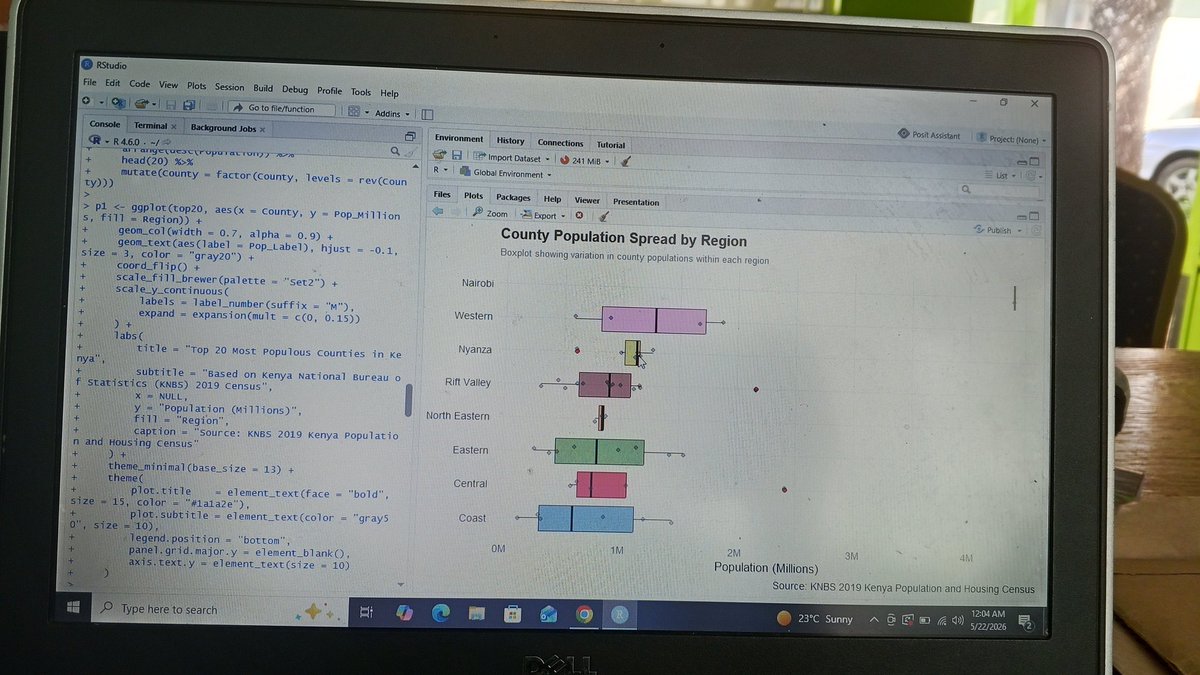
Cracking open Kenya's regional population data with R.Some are tightly packed while others have a massive spread #RProgramming #DataScience census data of 2019

4
38
May 20
The Grammar of Graphics is the core idea behind ggplot2 in R.
Instead of creating plots in one step, ggplot2 builds visualizations layer by layer.
This makes charts easier to customize, understand, and extend.
I have just released a new module on the Grammar of Graphics using ggplot2 in the Statistics Globe Hub: statisticsglobe.com/hub
#rstats #ggplot2 #datascience #statistics #rprogramming #datavisualization #statisticsglobehub
2
36
1,375

Master Machine Learning with Python & R: A Deep Dive into Udemy’s Bestselling Course
👉 Daftar sekarang: [newonlinecourse.blogspot.com…]
#MachineLearning #Python #RProgramming #DataScience #Udemy #BelajarCoding #Tech

1
2
35

📢 NDDI Africa is looking for a skilled African R Facilitator for the YANS Fellowship!
✨ Stipend available
📌 Rolling applications
🔗 Apply here: lnkd.in/eV6NsY69
#NDDIAfrica #YANSFellowship #RProgramming #DataScience #opportunity

3
2
247

May 3
Learn #RStats in just 39 minutes! 📊 Perfect for beginners & data pros alike. 🎥 Watch now: youtu.be/yZ0bV2Afkjc?... #DataScience #RProgramming #LearnR #RStats
22
92
7,895

Apr 28
10,000 Scholars & Students ka Trust!
Master R for Data Analysis in Agriculture & Plant Sciences. Fundamental to Advanced Course 9-20 May 2026 |
Fee: ₹1199 | $40 Last date: 8 May 2026 Register: cropinfotech.in
#RProgramming #DataAnalysis #Agriculture #PlantBreeding

1
2
156

🚀 Just open-sourced my second R package: llmcoder — LLM-powered code generation directly in RStudio
Write a comment in RStudio, hit a shortcut, and get production-ready R code instantly.
youtube.com/watch?v=zP-RuCN3…
#RStats #RProgramming #RStudio #DataScience #MachineLearning #AI
1
1
64

Apr 12
Tuberculosis remains one of the leading causes of death in Ghana, continuing to pose a major public health challenge.
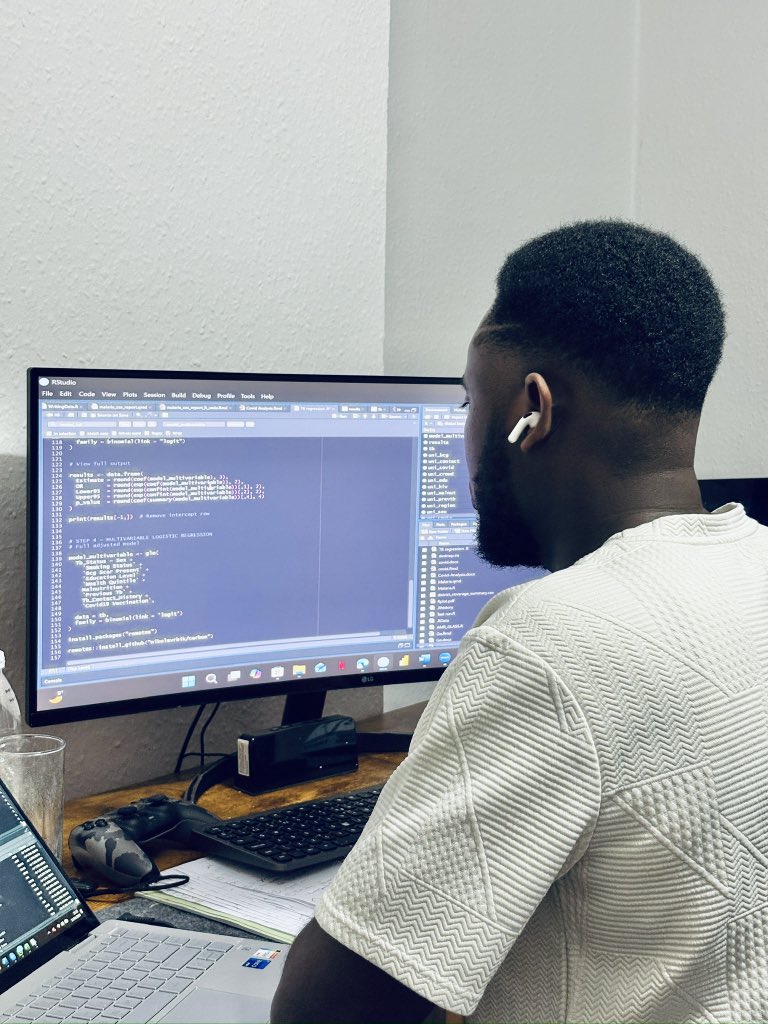
In my current data analytics project, I am developing a logistic regression model to assess the effectiveness of the BCG tuberculosis vaccine in preventing TB infection.
The analysis examines two perspectives:
• The crude effect of the vaccine (without considering other factors)
• The adjusted effect after accounting for other risk factors that may influence TB infection
Understanding these relationships through data can help inform better prevention strategies and strengthen public health interventions.
#Data #Statisticalanalysis #Rprogramming
1
5
100
Apr 12
Tuberculosis remains one of the leading causes of death in Ghana, continuing to pose a major public health challenge.
In my current data analytics project, I am developing a logistic regression model to assess the effectiveness of the BCG tuberculosis vaccine in preventing TB infection.
The analysis examines two perspectives:
• The crude effect of the vaccine (without considering other factors)
• The adjusted effect after accounting for other risk factors that may influence TB infection
Understanding these relationships through data can help inform better prevention strategies and strengthen public health interventions.
#Data #Statisticalanalysis #Rprogramming

1
2
9
6,798

Apr 8
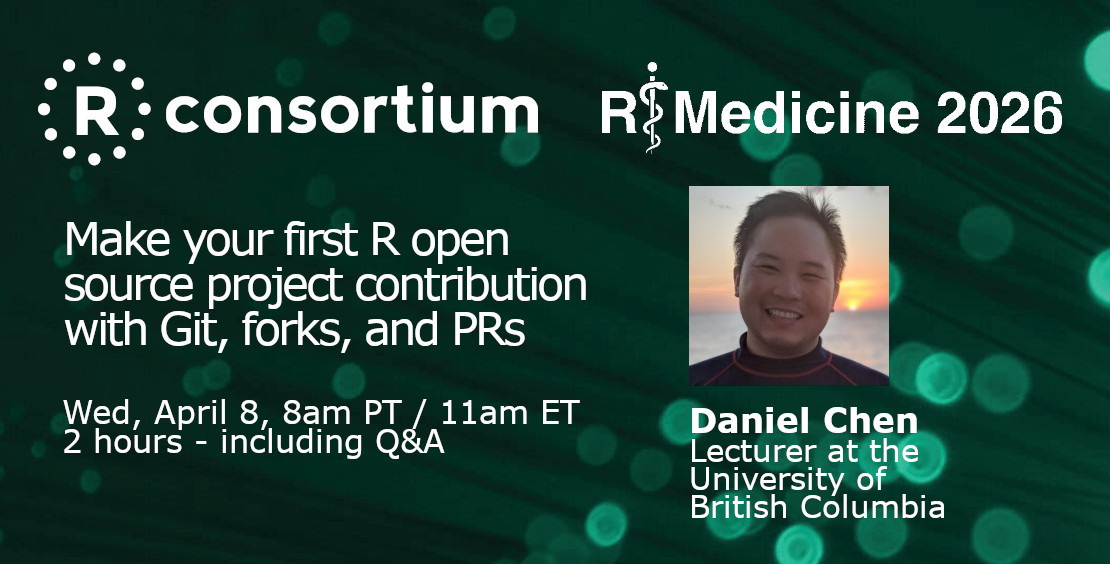
Starting in less than an hour!
Make your first R open source project contribution with git, forks, and PRs
r-consortium.org/webinars/ma…
#rstats #rprogramming #github
1
6
695
Apr 6
📊My latest Project
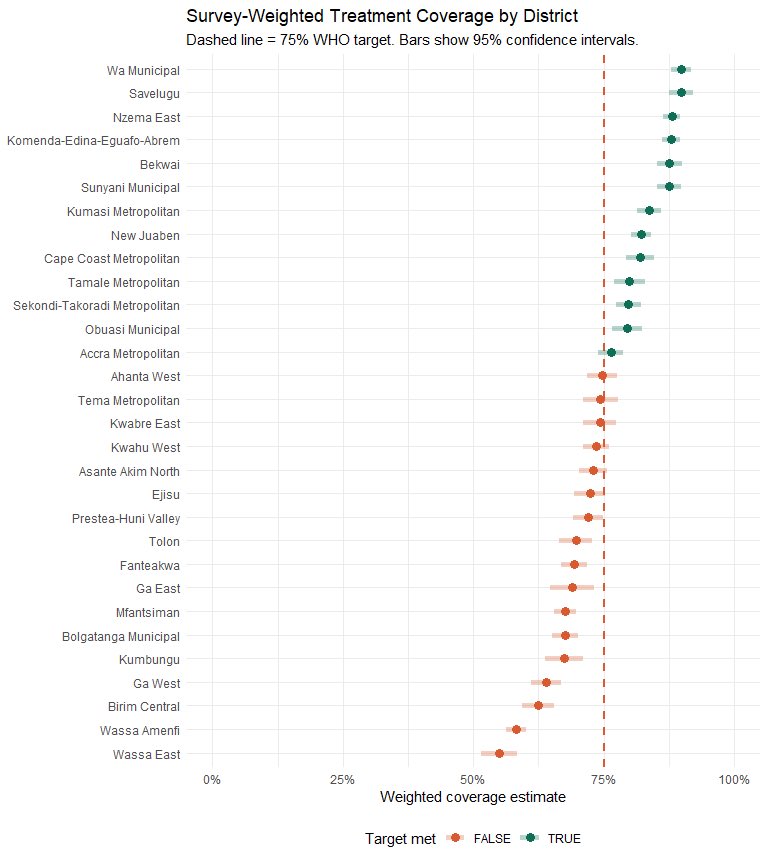
How do you know if a health campaign actually worked? You don’t just trust the paperwork. You send independent surveyors door to door to verify whether treatment actually reached people. That’s called a Coverage Evaluation Survey and I recently built a full analysis pipeline in R across 12,000 households and 30 districts in Ghana.
On paper, the national coverage was 75%, which sounds like a pass. But when you break it down district by district, 17 out of 30 areas missed the target entirely. In the worst performing district, nearly 1 in 2 people who should have received treatment didn’t get it. Averages hide the truth.
District-level data is what tells programme managers exactly where to go back and reach the people who were missed before the next outbreak, before the next round, before it’s too late. This is the kind of analysis that sits behind real public health decisions.
#RStats #RProgramming #PublicHealth


4
169
Apr 6
📊My latest Project
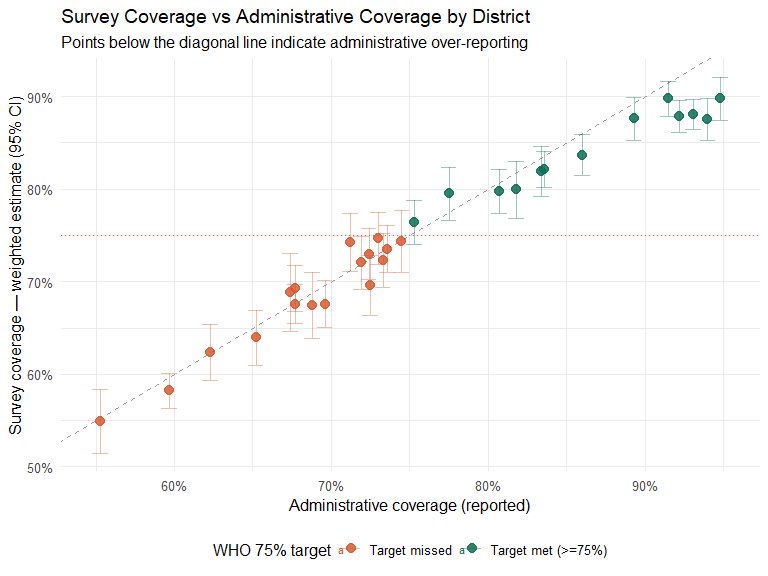
How do you know if a health campaign actually worked? You don’t just trust the paperwork. You send independent surveyors door to door to verify whether treatment actually reached people. That’s called a Coverage Evaluation Survey and I recently built a full analysis pipeline in R across 12,000 households and 30 districts in Ghana.
On paper, the national coverage was 75%, which sounds like a pass. But when you break it down district by district, 17 out of 30 areas missed the target entirely. In the worst performing district, nearly 1 in 2 people who should have received treatment didn’t get it. Averages hide the truth.
District-level data is what tells programme managers exactly where to go back and reach the people who were missed before the next outbreak, before the next round, before it’s too late. This is the kind of analysis that sits behind real public health decisions.
#RStats #RProgramming #PublicHealth
1
3
55