

📌 The market is changing, and so is my strategy
👇 Real-time signals
1
12

He is not showing the 1970s. SPX/Gold ratio has long term bearish signals. That is when gold outperforms and does well. In 1980-2000 and 2011-2022 this ratio was in a bear market. That explains why his signals are bearish.

2
82

I’m a subscriber but I’ve never seen this before. How do we get to this page?
12

Jun 14
Thanks for your input, just gave you a follow! Great work.
1
30

In the follow-up piece from 2018, we generated the following price target re-posted here in 2020.
All targets achieved so far.
1 Sep 2020

Falling interest rates...oh wait...not an option any more. Then when rates rise gold will boom.
Preliminary targets are from $4,500-$6,700 if rates can climb.
newlowobserver.com/2018/02/p…
1
1
71
We've covered this topic in extensive detail from 1924 to 2001.
newlowobserver.com/2018/02/t…
1
1
30

Jun 13
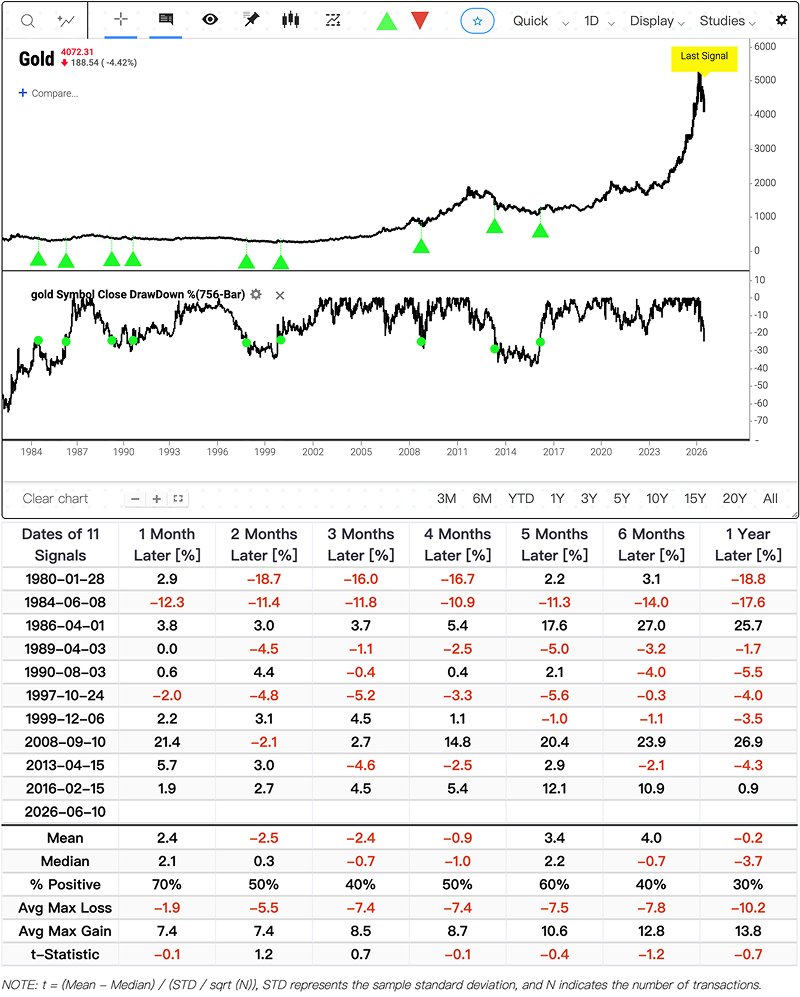
Two conclusions from the post below by @sentimentrader:
1) Mean reversion (dead cat bounce) in the short term.
2) Trend continuation (bad performance after one year) in the long term.
As an aside, the Dow Theory signaled the trend for gold as bearish on 6/9/36.
Trends tend to persist.
Jun 12

Gold was part of the liquidation.
The metal is now down 24% from its high. Since 1980, similar drawdowns showed a 70% one-month win rate, but only 30% were higher a year later.
Relief was not repair.
2
6
2,025
Jun 13
It clearly shows:
1) Mean reversion (dead cat bounce) in the short term.
2) Trend continuation (bad performance after one year) in the long term.
1
121

Jun 13
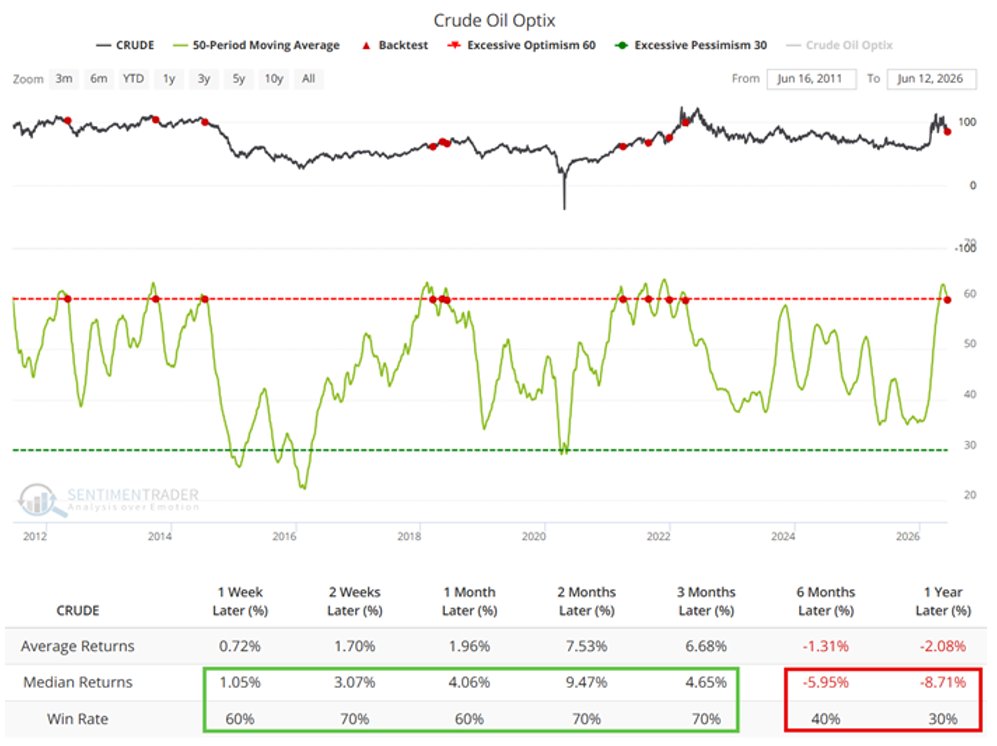
Could Crude Oil drift higher in the months ahead? Of course. BUT FWIW, our Crude Oil sentiment indicator suggests lower prices 6-12 months from now. @sentimentrader
1
7
52
4,621
Jun 13
International vs. U.S. stocks. Int'l:
a) Broke out to the upside
b) Pulled back
c) Tested 50-week ratio MA
d) Ticked higher
No predictions, just note that trends in this relationship typically last for years.
NOW is the time to pay attention to this relationship.
@sentimentrader

10
74
4,634
Andreas Wolf retweeted

Jun 13
Weekly Market Snapshot (June 8–12, 2026)
Key signals from this week's SentimenTrader research.

3
2
19
9,025

No. There is a window here where curve & bond market can apply some pressure, but it's temporary. Much of it has already been discounted too.
1
150
Luis Alberto Luengo 🇨🇱 retweeted
Jun 12
Payroll beats above 87k have a gold aftershock.
Gold was positive 79% of the time six months later after similar beats.
Bonds took the release-day hit. Gold showed up later.
A limited-time offer is coming soon. Stay tuned: sentimentrader.com/pricing

3
1
18
7,003
Jun 13
Gotcha, appreciate the response. Are you worried about bonds / yields dampening or killing the Bull markets
1
2
234
ZRL retweeted
May 22
SentimenTrader Light Data API: overwhelmed by 30,000 indicators?
Focus on what matters.
Get your guided starting kit

7
59
612,164

Jun 12
What do you think? If you could get 1000 Silver ounces or 1 Bitcoin today and you HAD to sell it in a year, which would you choose? Heck, I'll do a poll.
Jun 12

if you could get 1000 ounces of Silver or 1 Bitcoin tomorrow but you HAD to sell it in a year, which would you choose?
105
Jun 12
How do you determine the difference between the two in real time? Whats your mental model for it?
2
2
437
