
Pinguzo is featured on #10words today! Check it out to upvote and help us spread the word 10words.io via @10words_io
#Pinguzo #ServerMonitoring #WebsiteMonitoring #SAAS #realtime #alerts
1
5

The Most Important Employee Never Takes a Day Off.
But what happens when it stops?
📞 91 9571129852
🌐 palsanainfosystem.in
.
#ServerManagement #ServerMaintenance #ITInfrastructure #ServerSolutions #ServerMonitoring

ALT A professional Palsana Infosystems promotional graphic featuring enterprise server racks with the headline "The Most Important Employee Never Takes a Day Off." The design highlights server setup and maintenance services, including proactive monitoring, performance optimization, security management, and technical support. The graphic emphasizes business uptime, infrastructure reliability, and IT support services with contact information and company branding.
1
9

Jun 8
Complete Guide to API Monitoring
seanergy.app/complete-guide-…
#ServerMonitoring #InfrastructureMonitoring #NetworkMonitoring #UptimeMonitoring #CyberSecurity #CloudMonitoring #RealtimeAnalytics #SystemMonitoring #MonitoringSystem #SaaSPlatform #Uptime #SSL #API #APIMonitoring

2
2
5

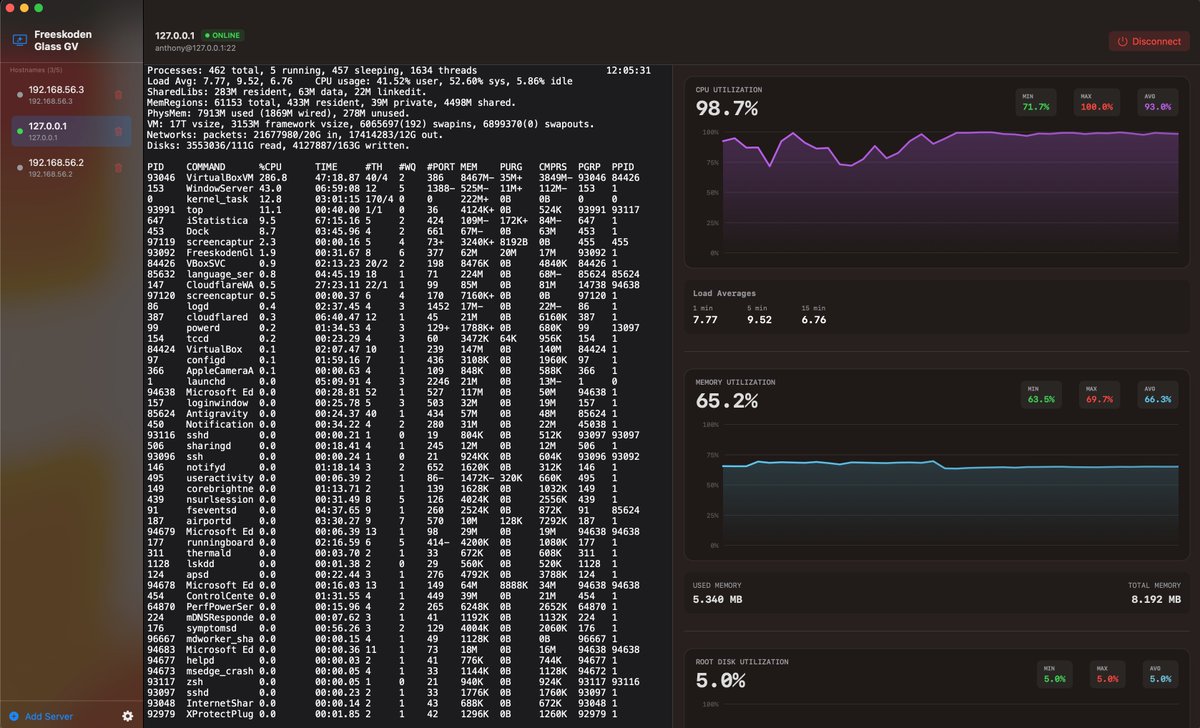
Tampilan FREESKODEN GLASS GV yaitu SSH client dengan grafis CPU, RAM, diskspace dll. Freeware. 🔗 freeskoden.com/id
@PHP_Indonesia
#LinuxIndonesia #ServerMonitoring #SysAdminIndonesia #DevOps #DeveloperIndonesia
46
Jun 5
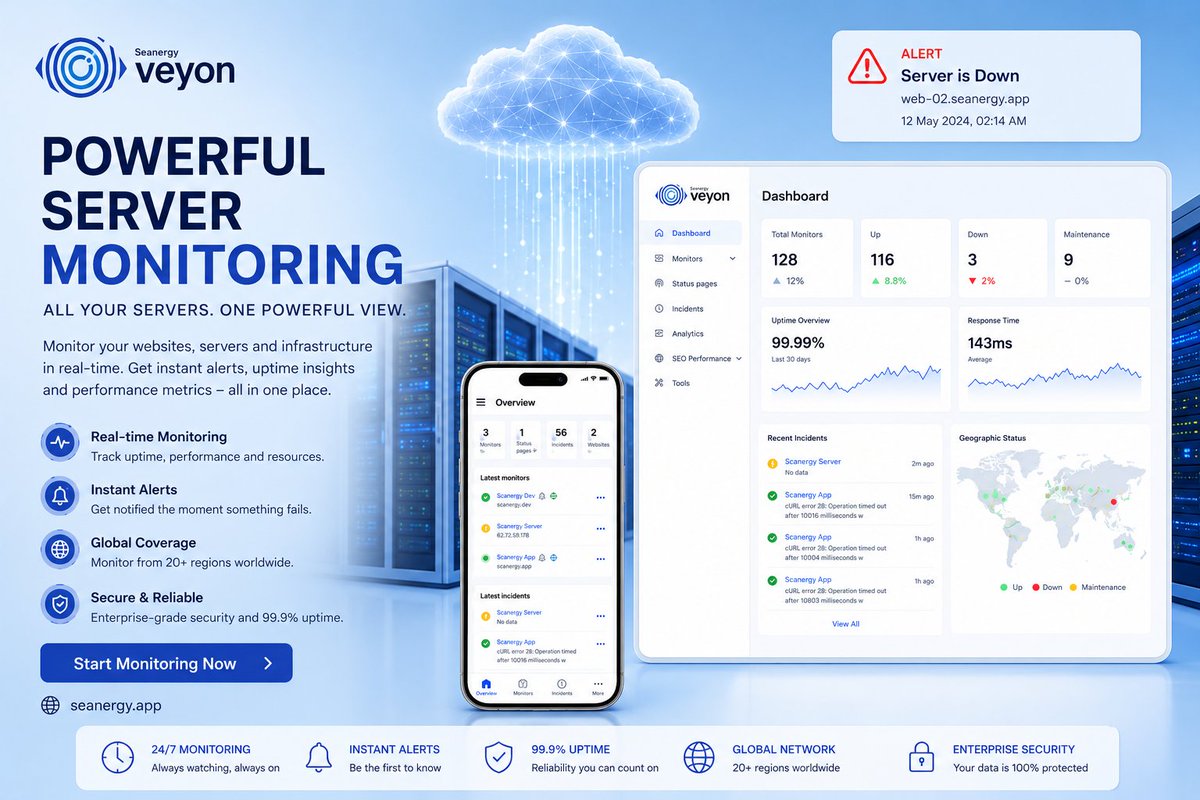
🚀 Monitor smarter. Analyze deeper. Grow faster.
𝗩𝗲𝘆𝗼𝗻 gives you real-time website monitoring, server analytics, uptime tracking, SEO insights, and instant alerts — all in one powerful platform. ⚡📊☁️
#Veyon #WebsiteMonitoring #SEOAnalytics #ServerMonitoring #Uptime

1
2
3
11
Jun 1
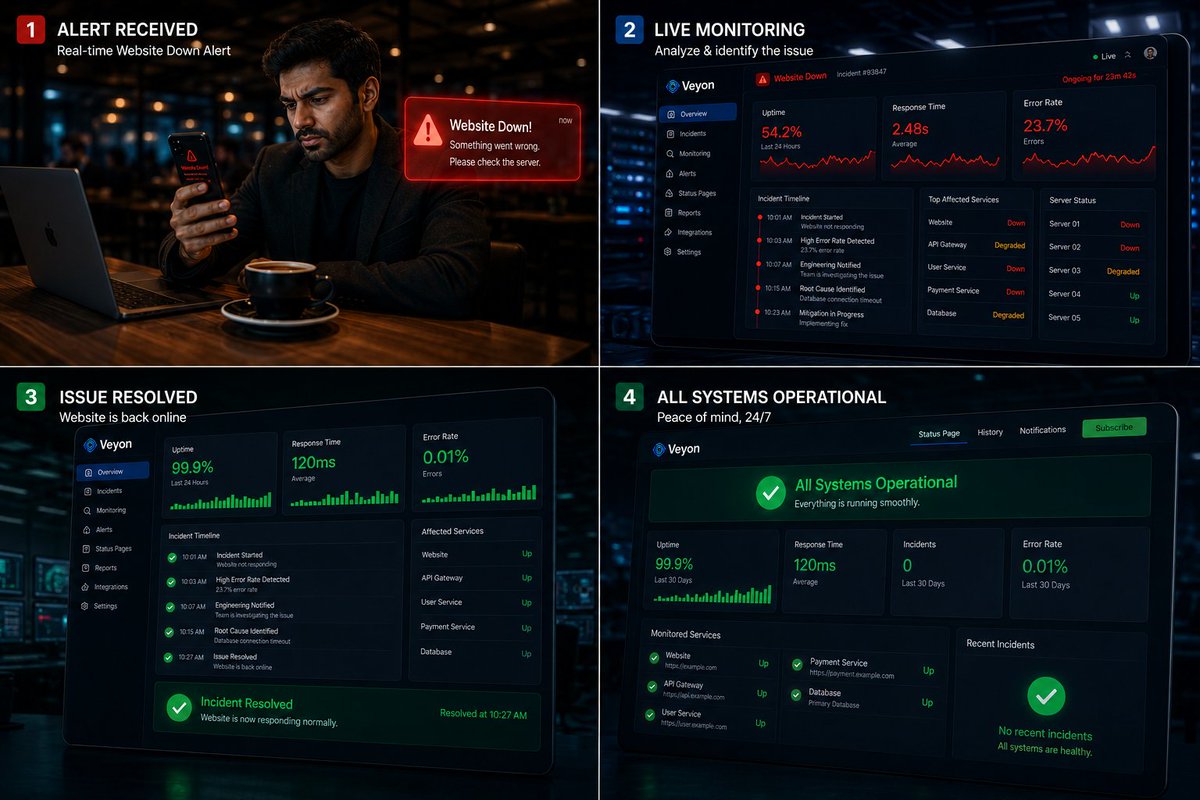
🚨Don’t let downtime cost your business.
𝗩𝗲𝘆𝗼𝗻 keeps your website online with real-time monitoring, instant alerts, and smart uptime analytics — anytime, anywhere. 🌐⚡
#Veyon #WebsiteMonitoring #DowntimeAlerts #UptimeMonitoring #ServerMonitoring #WebsiteSecurity #Uptime

1
3
3
9

🧹 We're doing a major cleanup on Zuzia.app!
Over the next few weeks we're rolling out a lot of improvements:
✅ Notifications are getting a complete overhaul with new categories
✅ Push notifications directly to your phone
✅ Per-host notification preferences (choose exactly how and when each host alerts you)
✅ A refreshed landing page with new copy
✅ A brand-new hero video
The goal is simple: make monitoring faster, cleaner, and less noisy.
More updates are on the way. 🚀
#DevOps #SysAdmin #Linux #Monitoring #SaaS #ServerMonitoring #WebHosting #CloudComputing #ZuziaApp
1
6
45
May 26
Monitor everything in real time with 𝗩𝗲𝘆𝗼𝗻⚡
Track uptime, server health, incidents, and performance from one smart dashboard.
Get instant alerts, powerful analytics, and secure monitoring to keep your business running 24/7.
#Veyon #ServerMonitoring #UptimeMonitoring #AI

3
15
May 25
Monitor servers smarter with 𝗩𝗲𝘆𝗼𝗻⚡
Real-time uptime tracking, instant alerts, and secure performance monitoring — all in one powerful dashboard — 𝗦𝗲𝗮𝗻𝗲𝗿𝗴𝘆 𝗩𝗲𝘆𝗼𝗻
#Veyon #uptimemonitoring #ServerMonitoring #AI #MonitoringTools
veyon.app/
3
6

May 22
Stop the lag! 🛑🐌 Find the real bottleneck in your server infrastructure.
Before you upgrade your plan, learn how to diagnose CPU, RAM, and Disk issues using standard Linux tools. Our latest guide shows you exactly where to look.
🔗 Full Analysis: mivocloud.com/blog/Why-is-Yo…
#Linux #SysAdmin #DevOps #ServerMonitoring #PerformanceTips #CloudComputing

3
4
147
May 19
Monitor. Detect. Resolve. 🚀
Stay ahead of downtime with 𝗩𝗲𝘆𝗼𝗻 real-time monitoring, instant alerts, incident management, and operational dashboards.
Keep your business online 24/7 with smart infrastructure monitoring.
#WebsiteMonitoring #ServerMonitoring #CyberSecurity
3
12

Mar 24
📖 New Post on RackNerd: ✅ Exploring Prometheus and Grafana: A Guide for Server Monitoring 💻🌐 Learn more: blog.racknerd.com/exploring-…
🛒 ORDER VPS HOSTING: racknerd.com/kvm-vps
#RackNerd #Prometheus #Grafana #ServerMonitoring #DevOpsTools #VPSHosting #InfrastructureMonitor

2
182

Mar 24
🛡️ Ever felt that uneasy “who the hell just touched my server?” moment?
Good news: a killer guide just dropped on Habr showing exactly how to automate full user activity logging on any Linux server — and get instant Telegram alerts when something sketchy happens.
We’re talking auditd (Linux Audit Daemon) a clean Python script that turns your server into a silent, always-on security camera.
Here’s what it actually solves for you:
➡ Unauthorized access — exactly who ran sudo and when
➡ Suspicious commands — rm -rf, chmod, file access, permission changes… you’ll know instantly
➡ Incident forensics — what happened right before the server went down or got breached
➡ Corporate compliance — bulletproof logs for audits and standards
Quick reminder: auditd is the native RedHat tool that lives deep in the kernel. It watches every syscall — reads, writes, executes, permission changes — basically everything happening on your Linux box. No extra agents, no bloat, just pure kernel-level visibility.
With the right config that Python automation, it becomes one of the most powerful (and free) weapons in your DevOps security arsenal.
Full step-by-step guide (seriously worth the read):
habr.com/ru/articles/925962/
#Linux #auditd #DevOps #SysAdmin #CyberSecurity #Python #LinuxSecurity #ServerMonitoring #ThreatDetection #InfoSec
1
2
12
1,254
Jan 29
📖 New Post on RackNerd: ✅ How to Set Up Real-Time Alerts for Server Failures with Grafana. 💻🌐 Learn more: blog.racknerd.com/how-to-set…
🛒 ORDER VPS HOSTING: racknerd.com/kvm-vps
#Grafana #ServerMonitoring #DevOps #UptimeMonitoring #ServerAlerts #InfrastructureMonitoring
1
2
218

寒い朝、出社やログインを果たした自分を褒めたい。
どんなに冷え込んでも、裏側でパケットを流し続けるのが僕らの仕事。
さて、まずは温かいコーヒー☕️を片手に生存確認から。今日も一日、安定稼働でいきましょう!
#インフラエンジニア #駆け出しエンジニアと繋がりたい #ServerMonitoring
1
15
117
🚀 New feature alert!
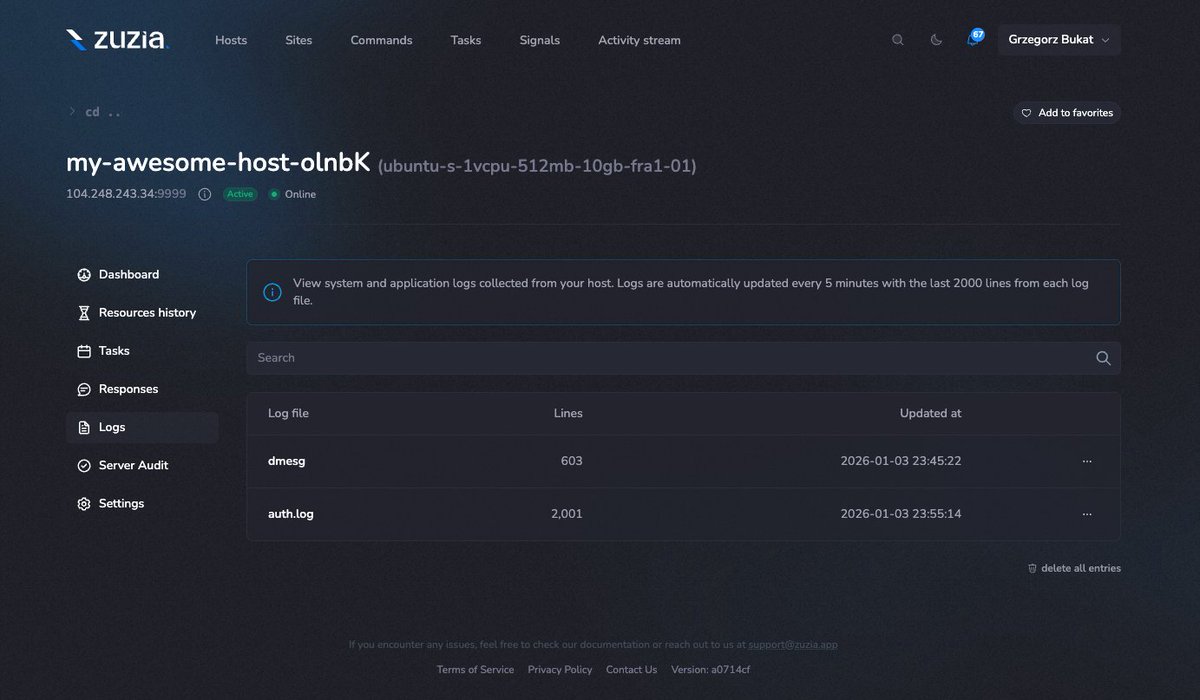
I've been away for a while, with the holidays, New Year, household chores, and laziness. Today I'm releasing a new feature on zuzia.app to kick things off in the new year.
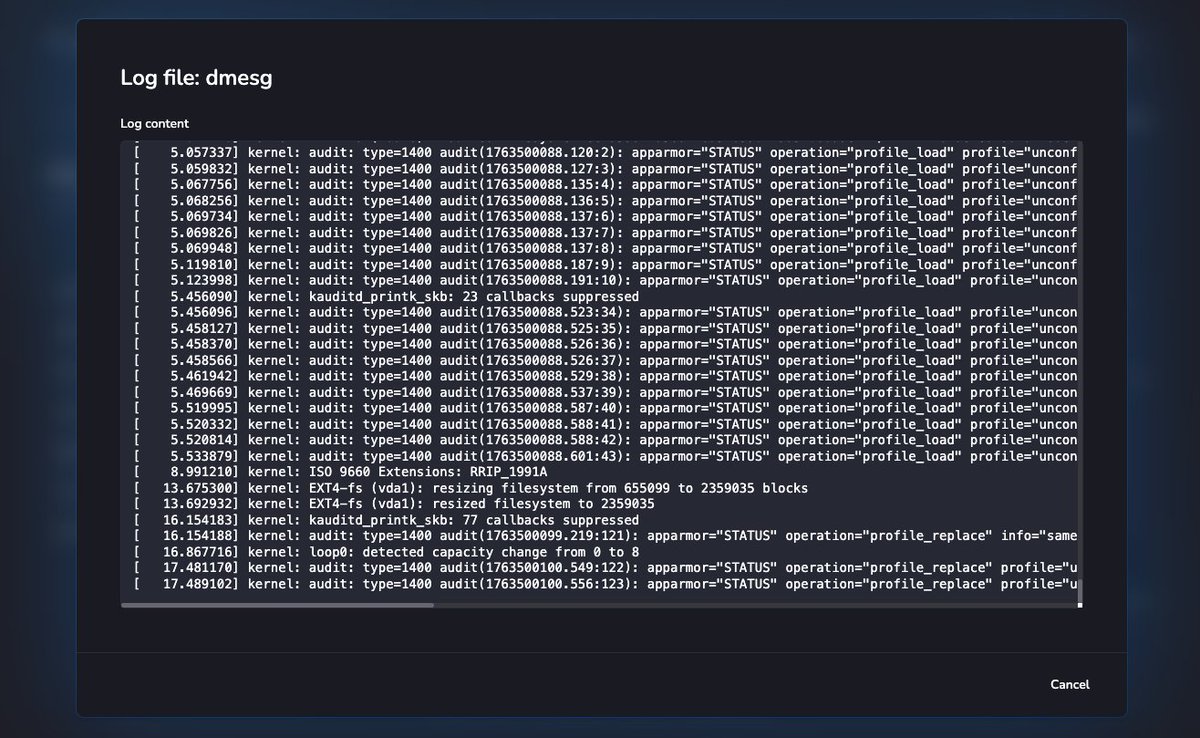
We just launched automated log collection for your servers on zuzia.app!
📊 We now support 50 log types, including:
Web servers (Nginx, Apache, Caddy, Traefik)
Databases (MySQL, PostgreSQL, MongoDB, Redis)
System logs (Ubuntu/Debian, CentOS/RHEL)
Containers (Docker, Kubernetes)
CI/CD (Jenkins, GitLab)
And 40 more!
This is just the beginning 🎯
What log feature would you want next?
→ Real-time alerts?
→ Log aggregation across servers?
→ AI-powered anomaly detection?
→ Something else?
Drop your ideas below! 👇
#DevOps #ServerMonitoring #LogManagement
1
6
90
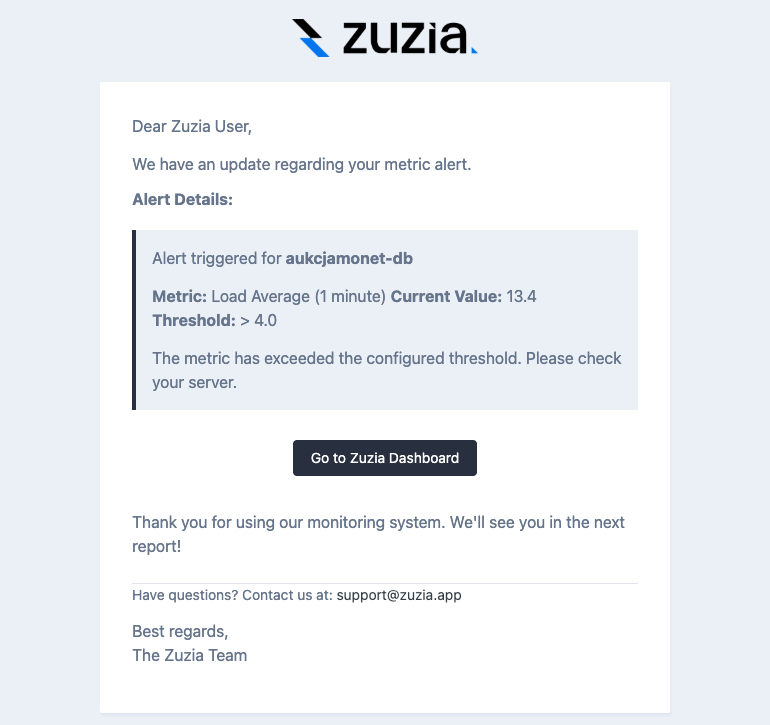
🚨 High-stakes auction incoming.
My client is about to list items with a starting price of 300,000 PLN (~$75,000 USD).
That’s when traffic, bids, and emotions explode — and servers either survive… or don’t.
I’m genuinely curious how the database & infrastructure load will look when real money hits the system 💥📈
This isn’t a demo. This is production. With real users and real pressure.
This is exactly why I built zuzia.app —
to watch, alert, and react before things go down.
If your business has peak moments you can’t afford to lose — you should be watching them too.
#buildinpublic #servermonitoring #scaling #auction #saas #devops #laravel #uptime
3
60

16 Nov 2025
Would any of these tools send me a dessert when I manage to have 0 alerts for a day? 🍰
Source: topdealsnet.com/blog/best-se…
#SystemUptime #PerformanceMonitoring #DigitalTransformation #TechTools #servermonitoring #monitoring

5
25

11 Nov 2025
Just like a thermometer helps you spot a fever early 👶🌡️, Netwatch.ai detects rising server temps ⚙️🔥 before downtime hits.
Real-time alerts = early action.
Because prevention saves the day—for kids and servers. 💪 #TechTip #ServerMonitoring #AI #ITOps #NetwatchAI

3
35

28 Oct 2025
Want a live dashboard for your Proxmox VE environment? Follow our new step-by-step tutorial by Paolo Valsecchi @NoLabNoPartY for #StarWind to connect InfluxDB and Grafana and get real-time insights into CPU, memory, and disk usage.
Read more here: starwind.com/s/z4
#StarWind_how_to #Proxmox #ProxmoxVE #Grafana #InfluxDB #ServerMonitoring #DataCenter

7
10
521