
#AI agents are quietly generating chaos engineering failures enterprises don’t track yet - buff.ly/1Jocqbq #AIagents #agenticAI #IT #tech #networkmonitoring

9

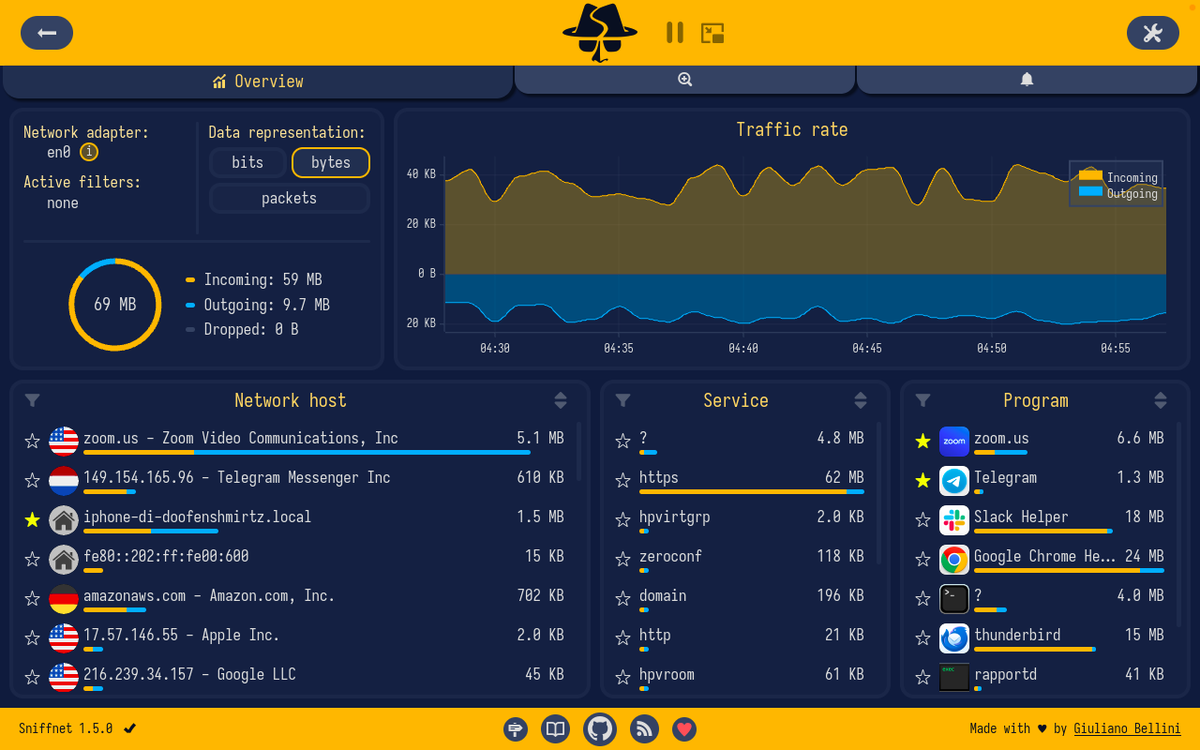
Sniffnet: A Modern Open-Source Network Traffic Monitoring Tool for Security Professionals
🌐 Sniffnet — Monitor Your Network Traffic with Ease
A modern, cross-platform network monitoring tool that lets you visualize real-time traffic, inspect connections, identify applications generating traffic, analyze hosts, and export captures in PCAP format through an intuitive interface.
🔗 github.com/GyulyVGC/sniffnet
#CyberSecurity #Networking #NetworkMonitoring #PacketAnalysis #PCAP #OpenSource #Linux #Windows #Infosec

11
45
1,403

A 4-hour network outage costs Tampa Bay businesses $8,400 in lost productivity. Yet most avoid monitoring because they think it's expensive. Here are 7 budget tools that actually work: 🧵 #NetworkMonitoring #TampaBayBusiness #ClearwaterIT

8

Jun 12
19

Jun 12
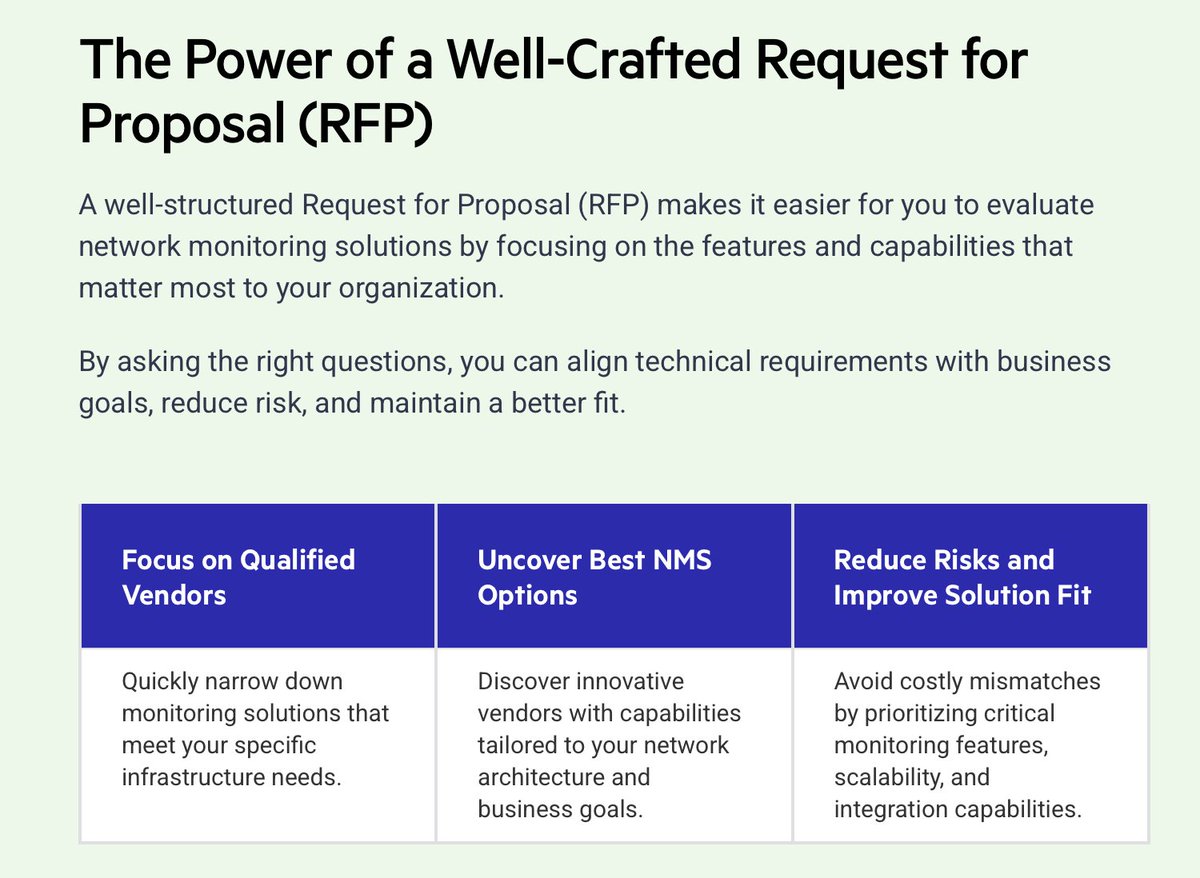
Evaluating network monitoring tools can be complex - especially without a clear RFP.
That’s why we’re offering a free Network Monitoring RFP Template to guide your decision ➡️ prgress.co/4ef00Y2
#ProgressWhatsUpGold #NetworkMonitoring
1
9

Stop downtime before it starts.
Proactive IT support and monitoring keep your business running smoothly.
#ITSupport #ManagedServices #BusinessContinuity #NetworkMonitoring

1

Jun 11
ManageEngine has added real-time telemetry and SOAR to its tools, aiming to help teams spot brief outages faster and reduce handoffs between network monitoring and security response. #NetworkMonitoring #SOAR #CyberSecurity techday.com.au/story/managee…
1
15

Network Experience Management helps IT teams measure, diagnose, and improve network performance from the user perspective across remote workers, branches, Wi-Fi, VPN, SASE, UCaaS, SaaS, and cloud applications. hubs.ly/Q04kWpxZ0 #networkmonitoring #networkengineering #IT
21

Jun 10
GlassWire charges $29–$99/year to show you what's happening
on your own network.
Wireshark is free — but built for network engineers with
patience and a manual.
@GyulyVGC built the third option.
sniffnet — free, beautiful, built for everyone.
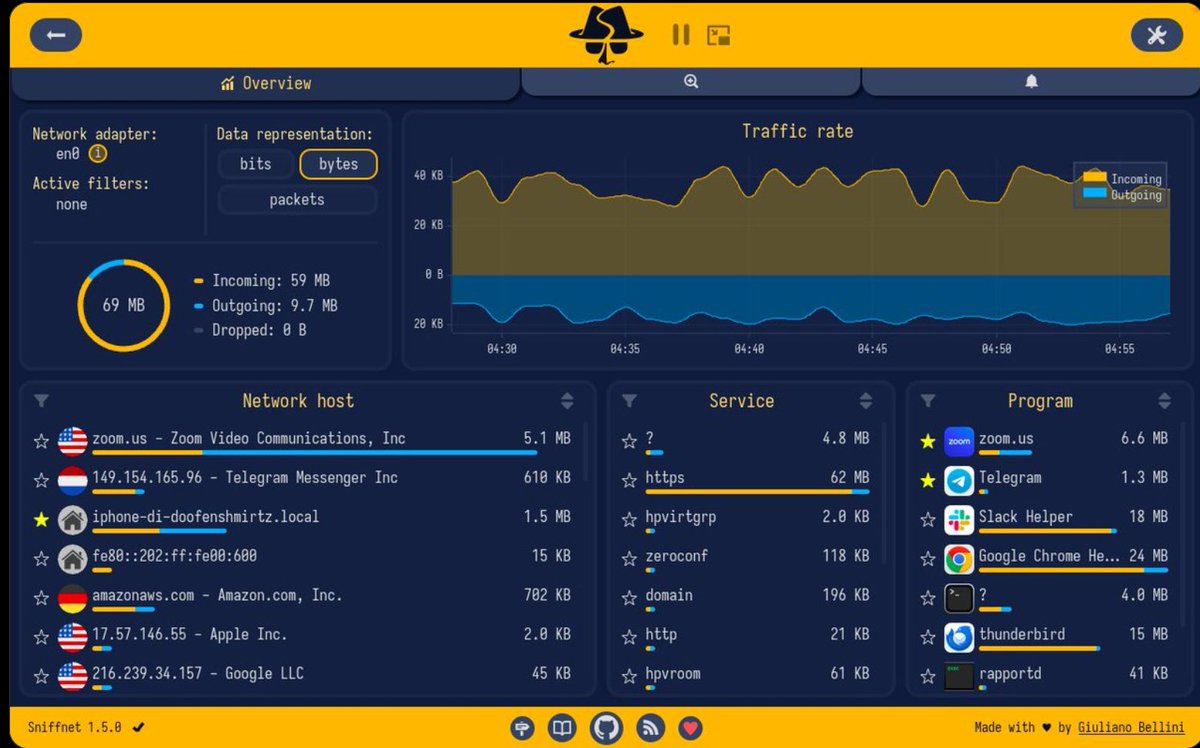
38,100 GitHub stars. 401,000 downloads. Built in Rust by one developer.
Here's what it shows you in seconds:
→ Real-time traffic rate chart — incoming and outgoing,
last 30 seconds, live
→ Network hosts dashboard — hostname resolution, not just raw IPs
→ Service and protocol breakdown — see exactly what's talking
and where it's going
→ Filter by adapter, protocol, IP, and port — drill into anything
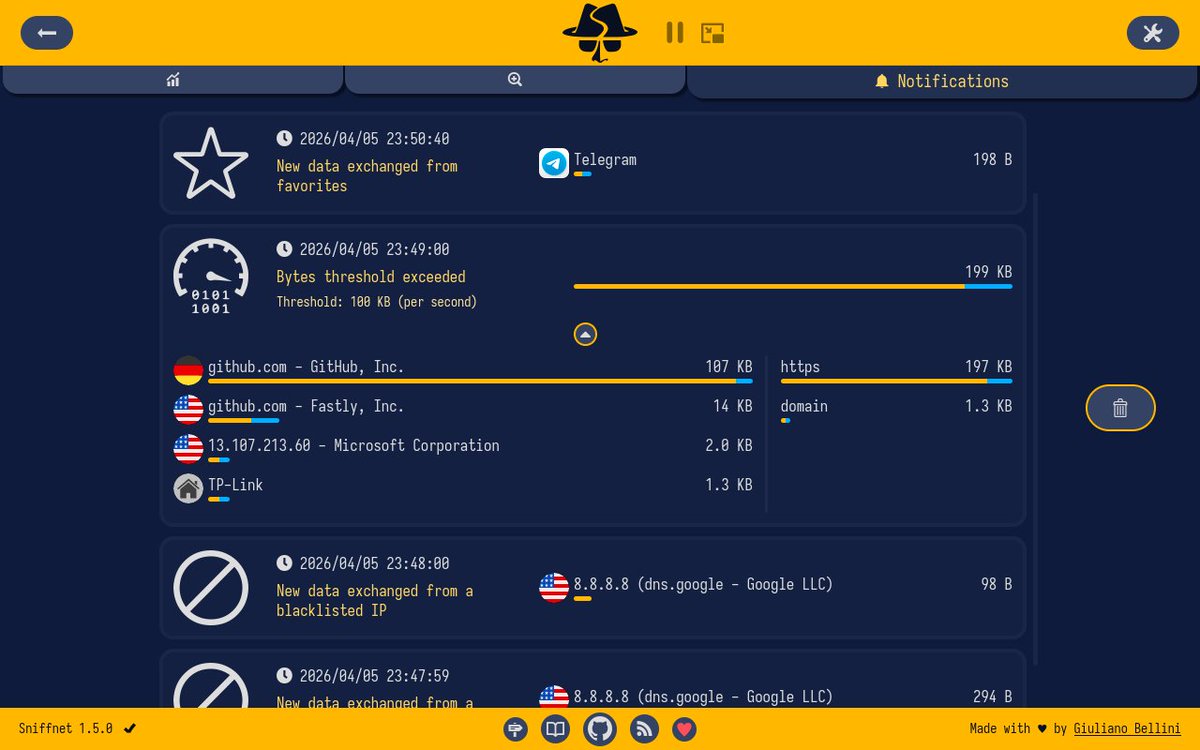
→ IP blacklist monitoring — get alerted when blacklisted IPs connect
→ Custom notifications — data threshold exceeded, new favorites
activity, blacklisted IP detected — with alert sounds
→ Remote notifications via webhook — integrate with any system
→ PCAP export and import — full capture reports, standard format
→ Pause and resume packet captures — without losing your session
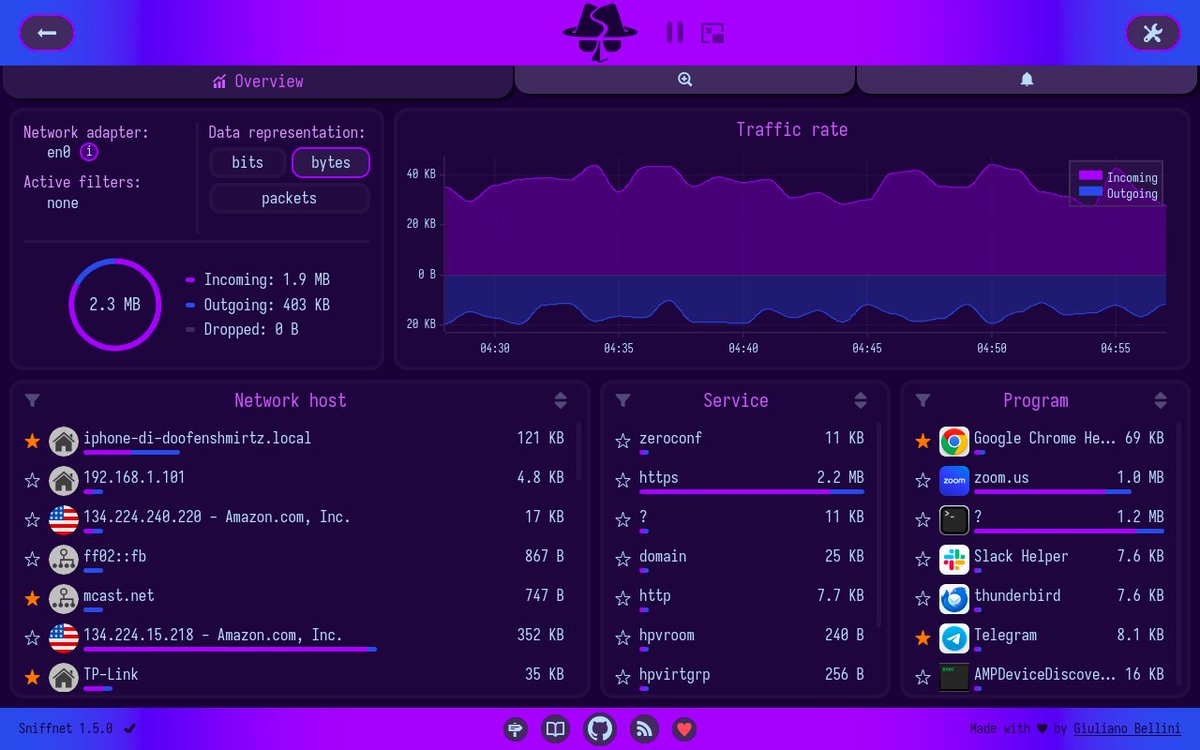
→ Custom themes — TOML-based, plus Dracula, Gruvbox, Nord, Solarized
→ Windows (x64 ARM64), macOS, Linux (AppImage, DEB, RPM)
→ GPL-3.0 licensed — 1,600 forks, v1.4.2 shipped April 2026
You deserve to know what your computer is sending.
Sniffnet makes that knowledge comfortable.
Discovered on OSSphere : ossphere.dev/GyulyVGC/sniffn…
Do you actively monitor your network traffic — or do you just
hope for the best? Drop it below 👇
#Sniffnet #OpenSource #NetworkMonitoring #Privacy #BuildInPublic #Rust #CyberSecurity
2
28

Network issues rarely start with a warning. Continuous network monitoring helps detect problems early, reduce downtime, improve performance, and keep your business running smoothly.
#NetworkMonitoring #CyberSecurity #MSP

2

Jun 10
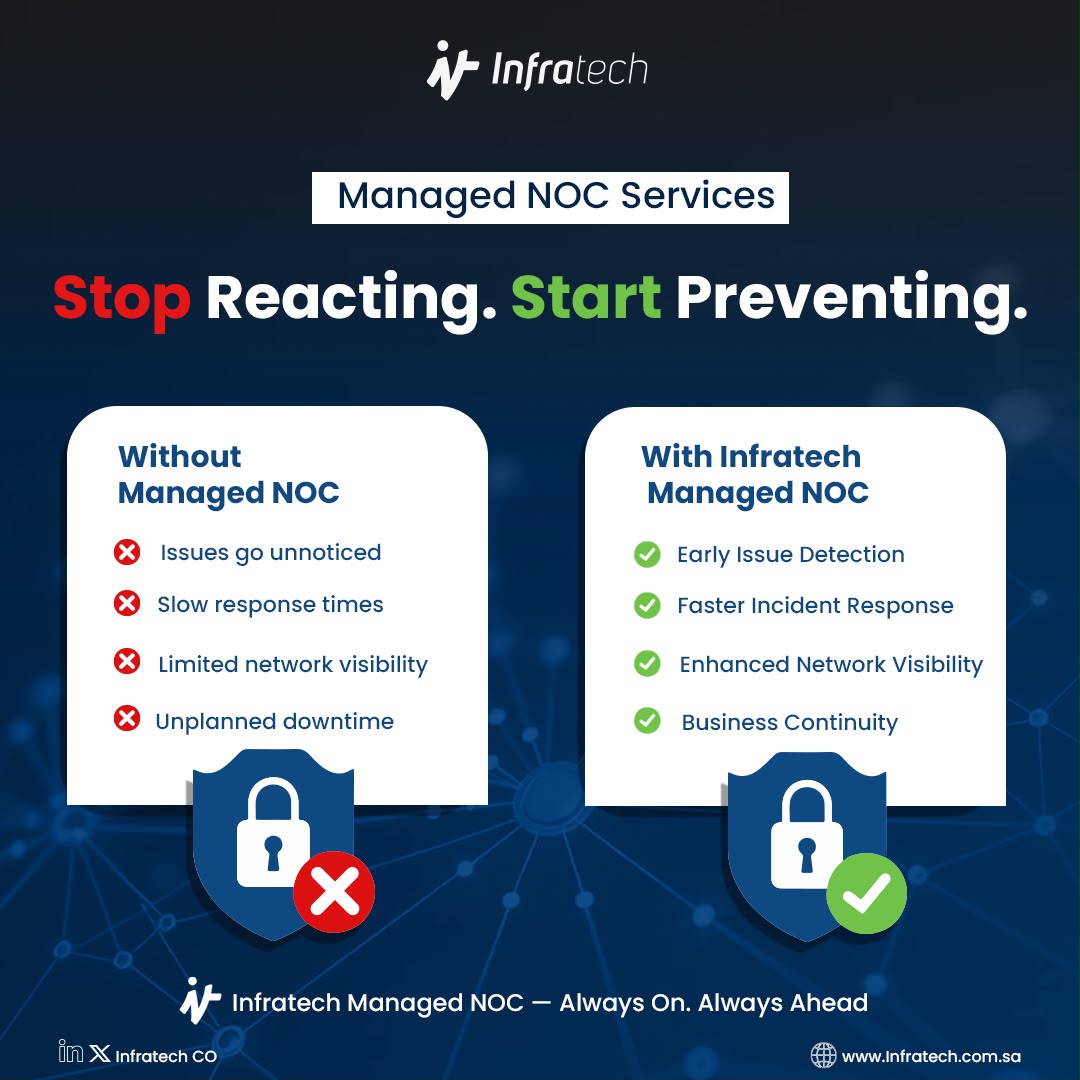
How much downtime can your business actually afford?
Here's the thing about outages: they rarely come out of nowhere. The warning signs were usually there for days. Nobody caught them.
That's what our Managed NOC team does. We watch your infrastructure around the clock, so small issues get fixed before they become expensive problems.
If you manage IT operations, infrastructure, or network performance, you know the difference between finding a problem and hearing about it from your users. One costs you a ticket. The other costs you trust.
Learn more: infratech.com.sa/infratech-m…
#NOC #NetworkMonitoring #ManagedServices #ITInfrastructure #DigitalTransformation
27

Jun 10
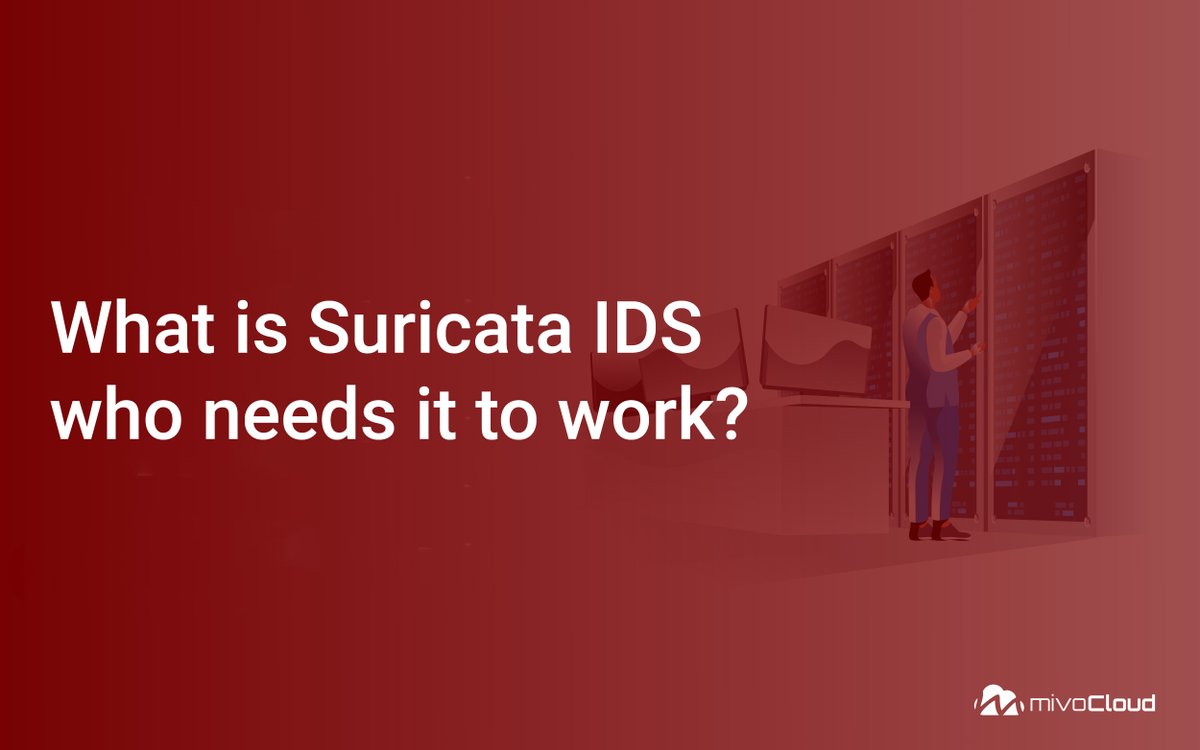
A standard firewall is no longer enough to protect your servers. 🧱❌
Automated botnets scan every IP around the clock. Learn how Suricata IDS/IPS goes beyond open ports to inspect the actual content of your network traffic and neutralize threats in real time.
🔗 Read the Full Breakdown: mivocloud.com/blog/What-is-S…
Why Suricata changes the game:
🔹 Multi-threaded processing for zero speed loss 🚀 🔹 Acts as both a passive alarm (IDS) & active shield (IPS) 🛡️
🔹 Rich JSON logging for seamless ELK / Grafana integration 📊
🔹 Catches SQL injections, Nmap scans, and exploit payloads 🔍
Get deeper visibility with @MivoCloud.
#MivoCloud #Suricata #CyberSecurity #InfoSec #DevOps #LinuxServer #NetworkMonitoring
1
12

We're live at Info-Tech LIVE Las Vegas!
See how NetCrunch delivers full-stack monitoring across metrics, logs, flows, topology, and events - all in one platform.
Stop by our booth and say hello! 👋
#InfoTechLIVE #NetCrunch #NetworkMonitoring

31

Big news: Devolutions is investing in @obkio_com, a network performance monitoring platform built for IT teams and MSPs.
Two Montreal founders. Eight years in orbit. 🎙️
Full story → youtu.be/CkkjqNSjGmI
📰 → devo-inc.net/4e7znUY
#ITManagement #NetworkMonitoring
1
1
381

What Are Network Security Threats and Solutions? bit.ly/4eb49MO #NetworkSecurity #CyberSecurity #CyberThreats #RansomwareProtection #PhishingAwareness #MalwareDefense #DDoSProtection #ZeroDayExploits #InsiderThreats #NetworkMonitoring #AttackSolutions

9

Unlock network insights with DDX: track assets, import data, and evaluate switch performance. Capture data directly from switch ports and ingest RSPAN for comprehensive visibility. #NetworkMonitoring #Cybersecurity
13

Your SD-WAN policies look good on paper - but are they actually working?
Learn how flow analytics validates traffic steering, path selection, application performance, and policy enforcement across your SD-WAN environment.
netflowlogic.com/sd-wan-vali…
#SDWAN #NetOps #NetworkMonitoring

5

Most outages don't start with a failure.
They start with:
❌ Blind spots
❌ Alert fatigue
❌ Too many tools
❌ Limited visibility
By the time users complain, it's already costing time, money, and trust.
What's your biggest network challenge?
1. Visibility
2. Downtime
3. Too Many Tools
4. Automation
Reply with a number
#NetworkManagement #EnterpriseIT #NetworkMonitoring #ITOps
48

Jun 8
Enfin, j’ai trouvé un outil open-source qui peut clairement remplacer Wireshark pour beaucoup d’utilisateurs.
Sniffnet, c’est un outil de surveillance réseau simple, lisible et beaucoup plus accessible. Avec plus de 37 000 étoiles sur GitHub, il rend l’analyse du trafic réseau compréhensible même pour ceux qui ne sont pas experts.
Soyons honnêtes : quand beaucoup de gens ouvrent Wireshark pour la première fois, leur réaction c’est souvent :
« Je ne comprends rien, je ferme. »
Sniffnet prend le chemin inverse.
Il affiche en temps réel :
📊 le trafic upload/download
🌐 les hôtes connectés
🔎 les domaines visités
📍 la localisation géographique des IP
🕵️ les logiciels qui communiquent en arrière-plan
📁 l’import/export PCAP
🖥️ la surveillance de plusieurs cartes réseau
Le gros point fort, c’est son interface.
Pas besoin de connaître les règles de capture de paquets.
Pas besoin d’apprendre des commandes complexes.
Tu l’ouvres, et tu vois directement avec qui ton ordinateur communique.
Beaucoup le voient déjà comme une alternative gratuite à GlassWire, surtout pour ceux qui veulent comprendre ce qui se passe sur leur réseau sans se prendre la tête.
Il est disponible sur Windows, macOS et Linux, écrit en Rust, léger, rapide et très peu gourmand en ressources.
Pour ceux qui bidouillent souvent avec des proxys, des NAS, Docker, des serveurs ou des réseaux domestiques, c’est clairement un outil à installer. 🧠⚡
#Sniffnet #Wireshark #OpenSource #Linux #Windows #MacOS #RustLang #NetworkMonitoring #CyberSecurity #Cybersécurité #Réseau #Networking #SysAdmin #DevOps #Docker #NAS #Homelab #Proxy #PCAP #Tech #Informatique #OutilsGratuits #GitHub #Privacy
71

Jun 8
Complete Guide to API Monitoring
seanergy.app/complete-guide-…
#ServerMonitoring #InfrastructureMonitoring #NetworkMonitoring #UptimeMonitoring #CyberSecurity #CloudMonitoring #RealtimeAnalytics #SystemMonitoring #MonitoringSystem #SaaSPlatform #Uptime #SSL #API #APIMonitoring

2
2
5