$BTC
Trend reversal attempt failed after double rejection at the $80K–$83K resistance zone (200 SMA). Losing both $75K and $70K shifted control back to sellers.
Price is now approaching the critical $60K support area, where previous demand emerged. This is the key level bulls must defend.
Holding $60K = relief bounce toward $65K (PT1) → $70K (PT2).
Failure below $60K = continuation of the broader downtrend.
Setup:
Buy zone: $60K
Stop loss: $57K
Targets: $65K → $70K
Support: $60K
Resistance: $75K → $80K
#BTC #Bitcoin #Crypto #SupportZone #Oversold #PriceAction

61
Lincoln Gale retweeted

Jun 2
GOLD BUY SETUP – SUPPORT
ZONE REBOUND
Entry Level: 4522, positioned above the identified SupportZone
Take-Profit Targets: 4530 (TP1), 4540 (TP2), 4550 (TP3) – scaling profit zones
Stop-Loss: 4512, placed below support for risk management
Risk-Reward Ratio: Approx. 1:1.8 (10-pip risk to 18-pip reward on first TP)

3
3
139

Jun 12
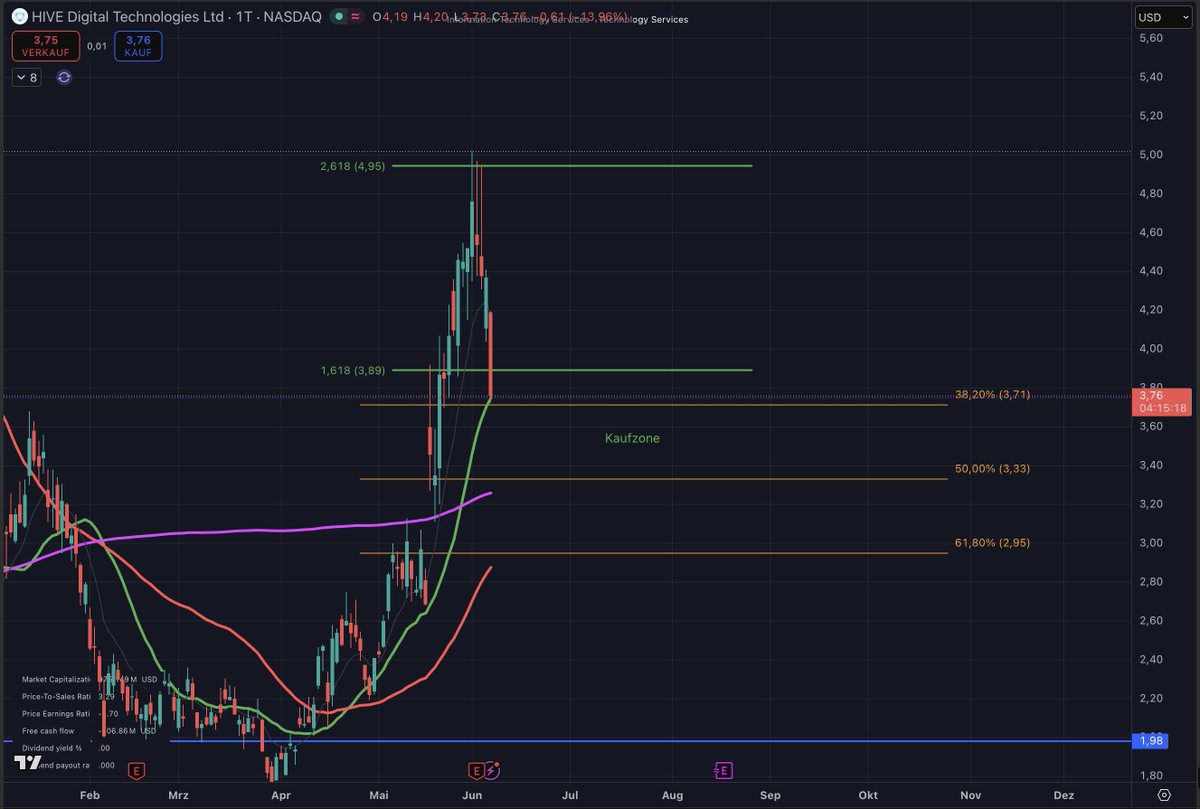
$HIVE: Korrektur läuft nach Plan. 👀
Im letzten Update war klar:
Nach dem erfolgreichen Anlauf an unser Wave-1-Ziel war eine Abkühlung völlig normal.
Genau das sehen wir jetzt.
$HIVE korrigiert nach dem starken Move sauber zurück und arbeitet aktuell an einer möglichen Wave 2. Besonders spannend bleibt der Bereich um das 0,5-Fibonacci-Level bei 3,33 USD.
Noch besser wäre natürlich ein sauberer Rücklauf in Richtung der 200-Tage-Linie bzw. der tieferen Supportzone - aber mal ehrlich: Wann gibt uns der Markt schon den perfekten Einstieg auf dem Silbertablett?
Wichtig ist jetzt, dass $HIVE in der Korrektur ein höheres Tief ausbildet und die Struktur nicht komplett bricht.
Die relevante Zone liegt weiterhin zwischen:
3,71 USD
3,33 USD
2,95 USD
Solange dort Käufer zurückkommen, bleibt das Setup konstruktiv.
Unsere Wave-3-Ziele bleiben gesetzt. Jetzt geht es darum, die Korrektur sauber auslaufen zu lassen und nicht dem Kurs hinterherzulaufen.
Kurz gesagt:
Wave 1 hat geliefert.
Wave 2 korrigiert wie gewünscht.
Die nächste spannende Zone liegt bei 3,33 USD.
Das Flugzeug wird gerade betankt - wir warten nur noch, ob der Markt uns noch einen günstigeren Sitzplatz gibt. 😉
Keine Finanzberatung. Nur persönliche Markteinschätzung.

Jun 5

$HIVE: Target getroffen - jetzt läuft die Abkühlung. 👀
$HIVE ist sauber an unserem Zielbereich bei 4,95 USD angekommen und dort direkt abgeprallt.
Genau das ist nach diesem starken Move erstmal völlig normal.
Die Aktie ist in kurzer Zeit sehr dynamisch gelaufen. Jetzt braucht der Chart wahrscheinlich eine gesunde Korrektur, bevor die nächste größere Bewegung nach oben starten kann.
Der erste wichtige Bereich liegt jetzt bei 3,71 USD. Dort befindet sich das 0,382-Fibonacci-Retracement und genau dort sehen wir aktuell die erste Reaktion.
Sollte diese Zone nicht halten, rücken darunter 3,33 USD und 2,95 USD als nächste mögliche Support- und Kaufbereiche in den Fokus.
Wichtig ist jetzt nicht, dem Move hinterherzulaufen. Wichtig ist, ob $HIVE in der Korrektur ein höheres Tief ausbilden kann.
Solange das passiert, bleibt die übergeordnete Struktur konstruktiv.
Kurz gesagt:
Ziel bei 4,95 USD getroffen.
Rejection bestätigt.
Jetzt läuft die Korrektur, damit der Chart später wieder sauber weitersteigen kann.
$HIVE hat geliefert - jetzt warten wir, bis der Markt wieder einen besseren Preis auf den Tisch legt. 😉
Keine Finanzberatung. Nur persönliche Markteinschätzung.
2
16
997

Jun 12
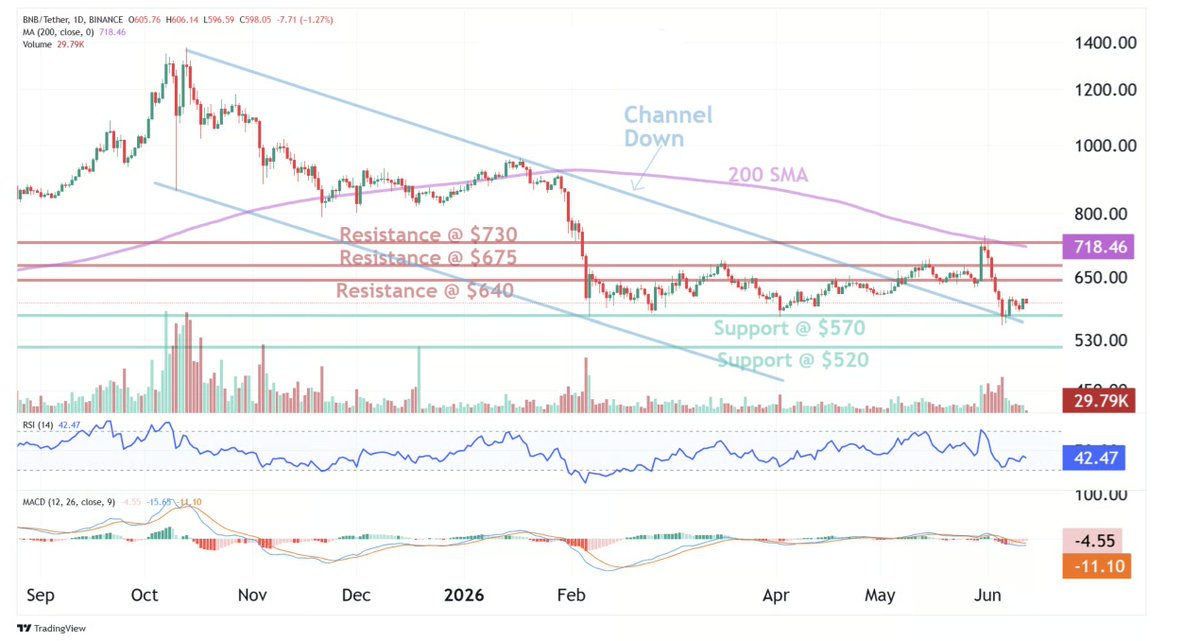
$BNB
Rejected at the major $730 resistance zone and 200 SMA, price has pulled back into a critical support area around $570.
Momentum is bearish but inflecting. Rising MACD histogram suggests downside pressure is fading, while the repeated defense of the $570 zone increases the odds of a relief bounce.
Holding above $570 = recovery toward $640 (PT).
Failure below $570 risks a move toward $520.
Support: $570 → $520
Resistance: $640 → $675
Setup:
Buy zone: $570
Stop loss: $550
Target: $640
#BNB #BinanceCoin #Crypto #SupportZone #BuyTheDip #PriceAction
53

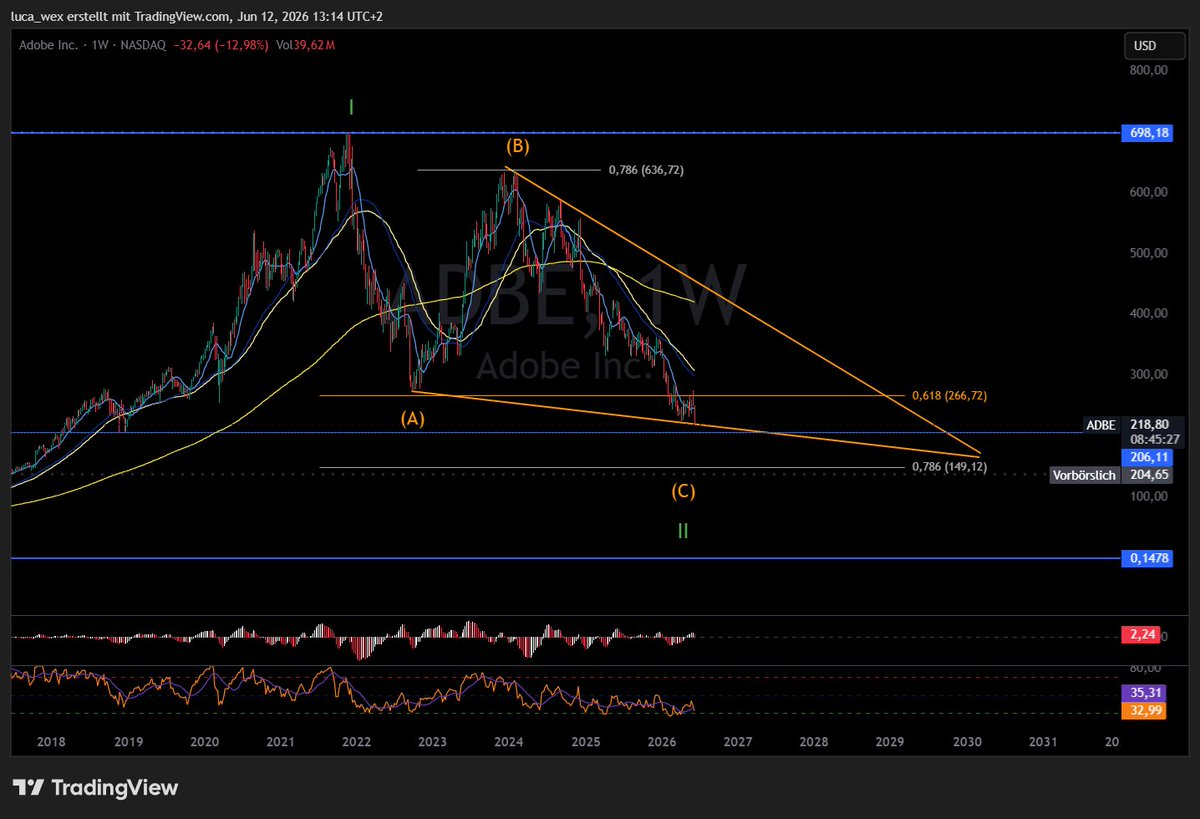
Nachdem $ADBE gestern starke Quartalszahlen präsentiert und den Ausblick angehoben hat, steht die Aktie dennoch rund -12% im Minus.
Aktuell notiert sie an einer wichtigen Supportzone bei $206. Sollte dieser Bereich nicht halten, sehen wir einen weiteren Rücksetzer in Richtung des 0,786 Fib bei $150 als wahrscheinlich an.
2
65
Jun 12
$BTC
Trend reversal has stalled after repeated rejection at the $80K–$83K resistance zone (200 SMA). Loss of $75K and $70K shifted momentum back in favor of bears.
Momentum is bearish but inflecting. Deeply oversold conditions near $60K increase the probability of a relief bounce.
Scenario:
Hold $60K = bounce toward $65K (PT1) → $70K (PT2)
Lose $60K = downside continuation below major support
Setup:
Buy zone: $60K
Stop loss: $57K
Support: $60K
Resistance: $75K → $80K
Oversold bounce likely, but broader trend remains bearish until BTC reclaims key resistance levels.
#BTC #Bitcoin #CryptoTA #Oversold #SupportZone #PriceAction

1
1
99

Jun 11
$SPY War anscheinend eine gute Supportzone. Mal schauen, ob wir heute noch bisschen squeezen können. Falls 7380 durchbrochen wird -> 7400 -> 7420 (Bonus).
$SPX #SP500 #Trading

Jun 11

📊SP500 Dealer Flow: Intraday Update.
Preis befindet sich in einer Supportzone. Mal schauen, ob wir wirklich noch mal die OVN Lows anlaufen. Opening Gap wurde geschlossen.
$SPY $SPX #Optionshandel #Optionen #Trading

3
571
Jun 11
📊SP500 Dealer Flow: Intraday Update.
Preis befindet sich in einer Supportzone. Mal schauen, ob wir wirklich noch mal die OVN Lows anlaufen. Opening Gap wurde geschlossen.
$SPY $SPX #Optionshandel #Optionen #Trading
Jun 11
📊SP500 Pre-Market Update
Über Nacht sind wir bisschen unter den 7240 Support geruscht, konnten diesen aber recht schnell wieder zurück gewinnen. Danach gab's ne schöne Rally Richtung 7300 nachdem wir den Major Strike bei 7290 (Main Pivot) durchbrochen haben.
7270/75 Sollte für die Cashsession ein schöner Support sein. Darrunter kommt das Ovn Low.
Über 7290 könnten wir nochmal versuchen den Widerstand bei 7340 anzulaufen.
Aber für Morgen ist aktuell der Major Node 7355.
$SPY $SPX #SP500 #Aktien #Börse #Stockmarket

6
766

Jun 11
Bei 65k liegt massiver Widerstand, Ziellevel bullischer Struktur, Unterkante der Bearflag verlorene Supportzone.
Neue bullische Struktur aktiv, die laut SK-System den Move in den Bereich 64,5–65,3k unterstützt.
BC-Korrekturlevel wird innerhalb dieses Setups entsprechend getradet & Long hochskaliert.
TP Long im Ziellevel, neue Short Limits im Zielbereich platziert. Danach 48K📉
Lehrbuch Setup.
Wichtig: Keine Anlageempfehlung!
#btc

57

@jakeclaverqfop retweeted

Jun 10
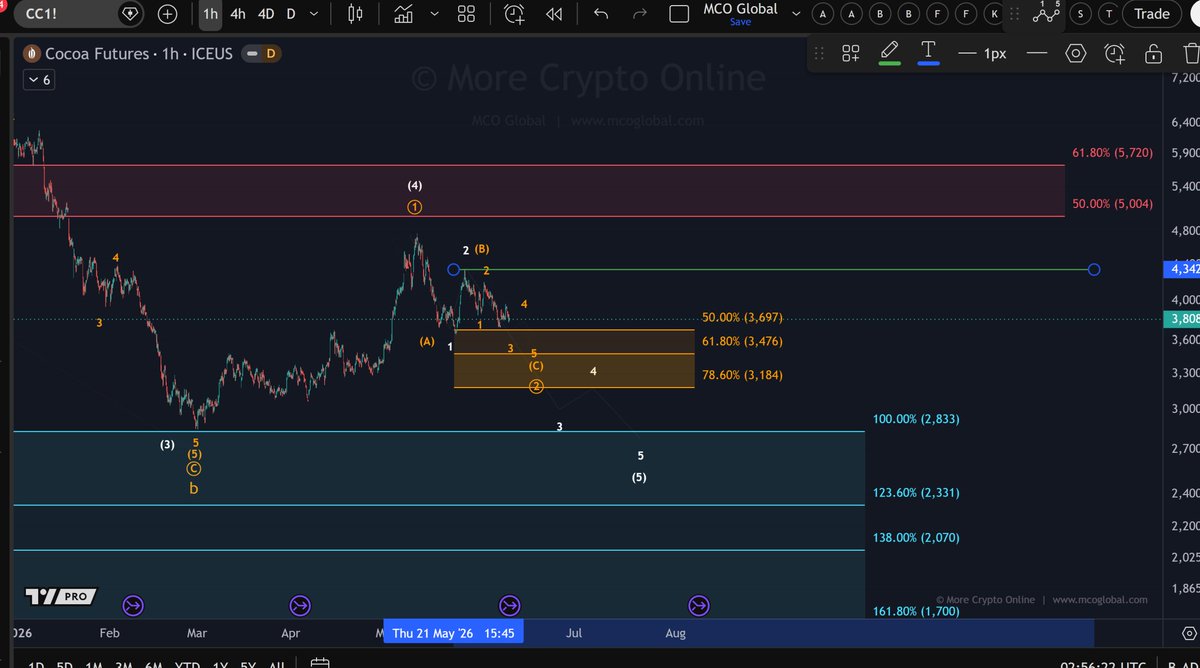
$CC1
Kakao handelt um 3.808 $, knapp über der orangefarbenen Fibonacci-Supportzone. Der Chart bleibt gespalten zwischen einer möglichen korrigierenden Welle 2, die sich in diesem Bereich hält, und der größeren bärischen Zählung, die das Maihoch als Welle (4) behandelt.
Führendes Szenario: Der bevorzugte bullische Weg ist ein mögliches 1-2 Setup, bei dem die Welle 2 in die Unterstützungszone zwischen 3.697 $ und 3.184 $ zurückkehrt. Eine Reaktion aus diesem Bereich kann die Struktur intakt halten, aber der Abprall muss sich noch mit einem anhaltenden Aufwärtsschub beweisen, bevor die nächste Aufwärtsbewegung bestätigt wird.
Risikoszenario: Wenn sich der Kurs nicht um die orangefarbene Zone halten kann und sich der Rückgang ausweitet, bleibt der größere Weg der Welle (5) gültig. Das würde die Wahrscheinlichkeit erhöhen, dass das Mai-Hoch bereits Welle (4) war und die Aufmerksamkeit auf den unteren blauen Verlängerungsbereich im Chart lenken.
Wichtige Supportlevels: 3.697 $ / 3.476 $ / 3.184 $ Wichtige Widerstandsniveaus: 5.004 $ / 5.720 $ Unterm Strich: Die Unterstützungszone ist der Entscheidungsbereich. Wenn sie gehalten wird, bleibt das 1-2 setup bestehen; ein Scheitern begünstigt die bärische Fortsetzung des Kurses.
2
11
1,302

Jun 10
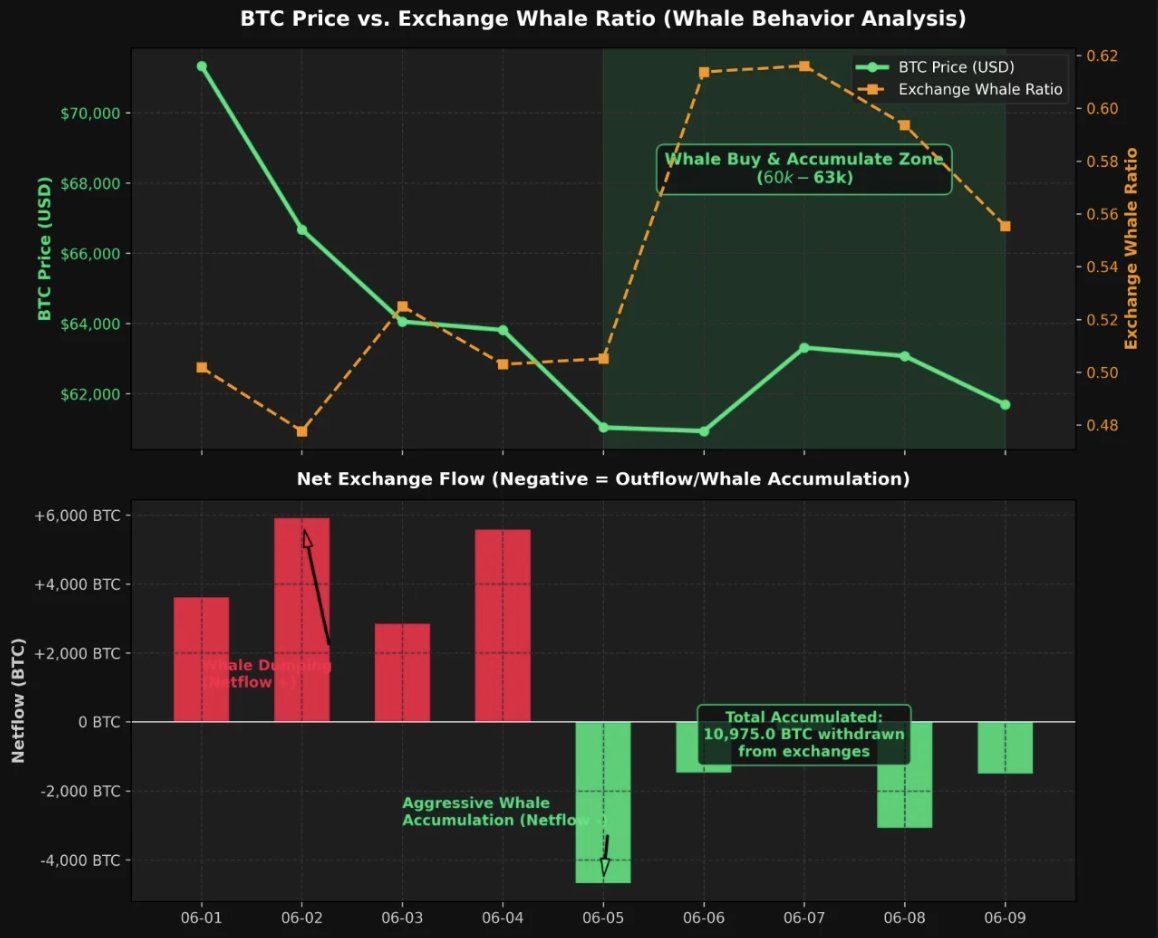
Whales kochten stilletjes de dip rond $60,000! 🚨
Terwijl veel kleine beleggers in paniek verkochten toen #Bitcoin rond $60,000 zakte, laten on-chain data zien dat grote investeerders juist hebben gekocht!
Door verkoopdruk van oudere wallets daalde de koers eerst hard van ongeveer $71,000 naar $60,000.
Maar rond de bodem ($60,000 - $61,000) kochten whales juist massaal in, waardoor zij het grootste deel van de verkoopdruk hebben opgevangen! 🚀
Dit maakt het een logische supportzone, zoals we ook al op de grafiek zagen! ⬇️
x.com/TimBitKamp/status/2064…
Jun 10

#BITCOIN MOET ZICH HIER GAAN BEWIJZEN! 🚨
Bitcoin is vanaf de range-top rond $64,000 teruggezakt naar de liquiditeitszone en 200-weekse moving average rond $62,000.
$BTC noteert daar nu onder, waardoor de laatste belangrijke support tussen $61,000 en $60,500 ligt. 📊
Hier moet een bounce volgen. Zo niet, dan verwacht ik een daling richting $59,000 of lager.
Dat blijft voor mij momenteel het meest waarschijnlijke scenario! 📉

2
58


Jun 8
Bedenke das die untere Supportzone des Power Law aktuell bei 56k ist. Sie kann unterschritten werden. Deine angepeilten 45k liegen jedoch noch einmal 24% unterhalb. Möglich ja aber mit sehr geringer Wahrscheinlichkeit.
2
3
144

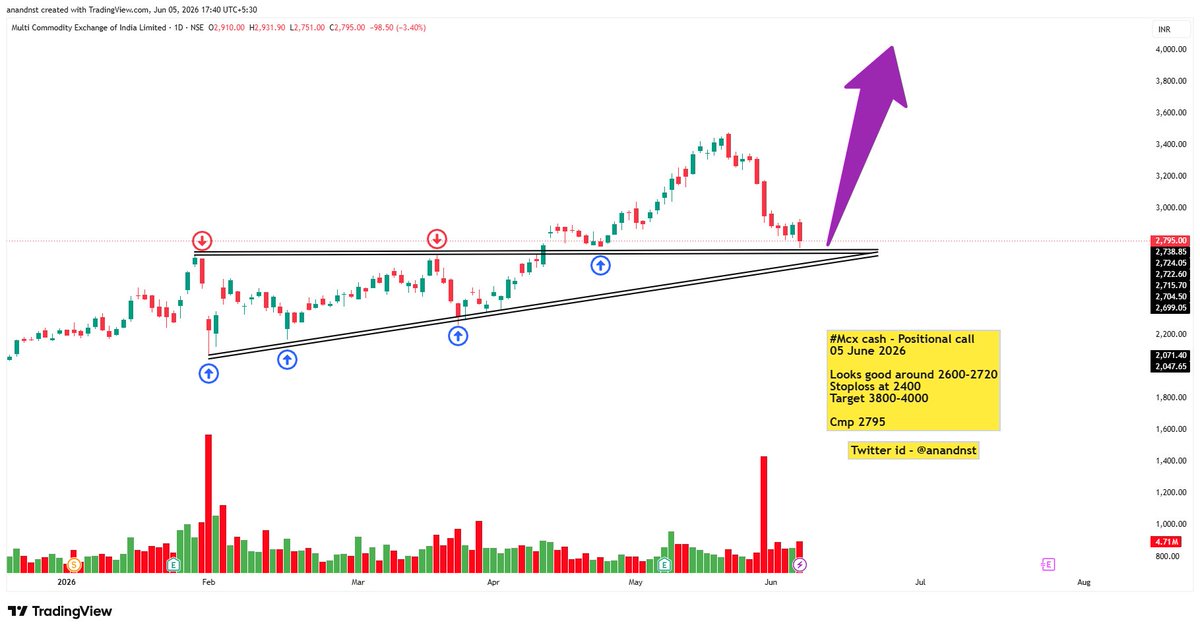
MCX AT A CRITICAL SUPPORT ZONE: IS THIS THE NEXT BIG WEALTH CREATION OPPORTUNITY?
Fundamental Strength No.1:
India’s Monopoly Exchange Business Model
Multi Commodity Exchange of India (MCX) continues to be one of the strongest financial infrastructure companies in India. As the country's leading commodity derivatives exchange, MCX enjoys a dominant position in commodity trading across precious metals, energy products and industrial commodities. Unlike manufacturing companies that face raw material risks, commodity exchanges benefit from increasing market participation and trading activity. Every trade executed on the platform generates transaction revenue, creating a scalable and asset light business model. As India's economy expands and financialization deepens, commodity hedging and speculative participation are expected to rise significantly. This gives MCX a long runway for growth. The company also benefits from strong entry barriers because setting up and operating an exchange requires regulatory approvals, advanced technology infrastructure and market trust. Such advantages make MCX a unique business that can potentially compound earnings over the long term while maintaining strong profitability and healthy cash generation.
x.com/anandnst/status/206287…
Fundamental Strength No.2:
Growth Drivers That Can Surprise Investors
Several long term catalysts support the growth story of MCX. Rising participation from retail investors, increasing institutional involvement and growing awareness of commodity hedging are driving higher volumes across the platform. The successful migration to its own technology platform has further strengthened operational efficiency and reduced dependency risks. As India becomes a larger consumer of gold, silver, crude oil and industrial metals, the need for risk management products is expected to increase. MCX stands to benefit directly from this trend. The company also remains debt free with a strong balance sheet and healthy reserves. Investors often underestimate the power of exchange businesses because revenue growth can accelerate rapidly during periods of high market activity. If commodity markets witness sustained volatility and participation continues to rise, MCX could see a significant boost in transaction income and profitability. These factors make the company fundamentally attractive for long term investors looking for exposure to India's growing financial ecosystem.
x.com/anandnst/status/206287…
Technical Analysis: Strong Support Zone Creating A High Reward Opportunity
From a technical perspective, the chart is displaying an interesting setup. MCX has corrected sharply from higher levels and is currently approaching a major support zone between ₹2600 and ₹2720. This area has historically acted as a strong resistance zone before eventually turning into support after the breakout. Multiple previous price reactions around this region indicate significant buying interest. The rising trendline connecting major swing lows further strengthens this support cluster. The recent correction appears to be testing investor conviction rather than damaging the long term trend structure. Volume activity has increased near the support area, suggesting that market participants are closely watching this zone. As long as the stock holds above the ₹2400 stop loss level, the broader bullish structure remains intact. If buyers successfully defend the current support range, the stock may attempt a fresh upward move toward previous highs and potentially challenge the ₹3800 to ₹4000 zone over the coming months.
x.com/anandnst/status/206287…
Technical Outlook: Risk Reward Appears Favorable
The current setup offers an attractive risk reward profile for positional investors. Buying near major support often provides better downside protection compared to chasing stocks near all time highs. The convergence of horizontal support and rising trendline support creates a technically significant demand area. A sustained hold above this zone could attract fresh institutional buying and improve market sentiment. Momentum indicators may remain weak in the short term due to the recent decline, but price structure remains constructive on the higher timeframe. Investors should continue monitoring volume behaviour and price action around support. A strong bullish reversal candle accompanied by rising volume could act as an early confirmation signal. The key factor now is whether buyers defend the support area and convert the correction into an accumulation phase.
x.com/anandnst/status/206287…
BOLD CONCLUSION
MCX appears to be standing at a decisive technical and fundamental crossroads. The company possesses a strong business model, leadership position and multiple long term growth drivers. With price approaching a historically important support zone, patient investors may find an attractive opportunity if the stock sustains above critical levels. Proper risk management remains essential, but the current setup suggests that MCX could be preparing for its next major wealth creation move toward the ₹3800 to ₹4000 region.
x.com/anandnst/status/206287…
Twitter: x.com/@anandnst
#MCX #MCXIndia #CommodityMarket #StockMarketIndia #IndianStocks #Investing #ValueInvesting #TechnicalAnalysis #FundamentalAnalysis #SwingTrading #PositionalTrading #StockMarket #ShareMarket #NSE #BSE #MarketAnalysis #TradingView #StockIdeas #WealthCreation #LongTermInvesting #MultibaggerStocks #IndianEconomy #FinancialMarkets #CommodityTrading #MarketTrends #PriceAction #SupportZone #BreakoutStocks #GrowthStocks #InvestmentIdeas #StockResearch #CapitalMarkets #TradingCommunity #InvestSmart #BullishStocks #MarketOpportunities #PortfolioBuilding #SmartInvesting #EquityMarket #TraderLife #InvestorsClub #StockEducation #FinancialFreedom #MoneyManagement #MarketPulse247

MCX AT A CRITICAL SUPPORT ZONE: IS THIS THE NEXT BIG WEALTH CREATION OPPORTUNITY?
Fundamental Strength No.1:
India’s Monopoly Exchange Business Model
Multi Commodity Exchange of India (MCX) continues to be one of the strongest financial infrastructure companies in India. As the country's leading commodity derivatives exchange, MCX enjoys a dominant position in commodity trading across precious metals, energy products and industrial commodities. Unlike manufacturing companies that face raw material risks, commodity exchanges benefit from increasing market participation and trading activity. Every trade executed on the platform generates transaction revenue, creating a scalable and asset light business model. As India's economy expands and financialization deepens, commodity hedging and speculative participation are expected to rise significantly. This gives MCX a long runway for growth. The company also benefits from strong entry barriers because setting up and operating an exchange requires regulatory approvals, advanced technology infrastructure and market trust. Such advantages make MCX a unique business that can potentially compound earnings over the long term while maintaining strong profitability and healthy cash generation.
Fundamental Strength No.2:
Growth Drivers That Can Surprise Investors
Several long term catalysts support the growth story of MCX. Rising participation from retail investors, increasing institutional involvement and growing awareness of commodity hedging are driving higher volumes across the platform. The successful migration to its own technology platform has further strengthened operational efficiency and reduced dependency risks. As India becomes a larger consumer of gold, silver, crude oil and industrial metals, the need for risk management products is expected to increase. MCX stands to benefit directly from this trend. The company also remains debt free with a strong balance sheet and healthy reserves. Investors often underestimate the power of exchange businesses because revenue growth can accelerate rapidly during periods of high market activity. If commodity markets witness sustained volatility and participation continues to rise, MCX could see a significant boost in transaction income and profitability. These factors make the company fundamentally attractive for long term investors looking for exposure to India's growing financial ecosystem.
Technical Analysis: Strong Support Zone Creating A High Reward Opportunity
From a technical perspective, the chart is displaying an interesting setup. MCX has corrected sharply from higher levels and is currently approaching a major support zone between ₹2600 and ₹2720. This area has historically acted as a strong resistance zone before eventually turning into support after the breakout. Multiple previous price reactions around this region indicate significant buying interest. The rising trendline connecting major swing lows further strengthens this support cluster. The recent correction appears to be testing investor conviction rather than damaging the long term trend structure. Volume activity has increased near the support area, suggesting that market participants are closely watching this zone. As long as the stock holds above the ₹2400 stop loss level, the broader bullish structure remains intact. If buyers successfully defend the current support range, the stock may attempt a fresh upward move toward previous highs and potentially challenge the ₹3800 to ₹4000 zone over the coming months.
Technical Outlook: Risk Reward Appears Favorable
The current setup offers an attractive risk reward profile for positional investors. Buying near major support often provides better downside protection compared to chasing stocks near all time highs. The convergence of horizontal support and rising trendline support creates a technically significant demand area. A sustained hold above this zone could attract fresh institutional buying and improve market sentiment. Momentum indicators may remain weak in the short term due to the recent decline, but price structure remains constructive on the higher timeframe. Investors should continue monitoring volume behaviour and price action around support. A strong bullish reversal candle accompanied by rising volume could act as an early confirmation signal. The key factor now is whether buyers defend the support area and convert the correction into an accumulation phase.
BOLD CONCLUSION
MCX appears to be standing at a decisive technical and fundamental crossroads. The company possesses a strong business model, leadership position and multiple long term growth drivers. With price approaching a historically important support zone, patient investors may find an attractive opportunity if the stock sustains above critical levels. Proper risk management remains essential, but the current setup suggests that MCX could be preparing for its next major wealth creation move toward the ₹3800 to ₹4000 region.
Twitter: x.com/@anandnst
#MCX #MCXIndia #CommodityMarket #StockMarketIndia #IndianStocks #Investing #ValueInvesting #TechnicalAnalysis #FundamentalAnalysis #SwingTrading #PositionalTrading #StockMarket #ShareMarket #NSE #BSE #MarketAnalysis #TradingView #StockIdeas #WealthCreation #LongTermInvesting #MultibaggerStocks #IndianEconomy #FinancialMarkets #CommodityTrading #MarketTrends #PriceAction #SupportZone #BreakoutStocks #GrowthStocks #InvestmentIdeas #StockResearch #CapitalMarkets #TradingCommunity #InvestSmart #BullishStocks #MarketOpportunities #PortfolioBuilding #SmartInvesting #EquityMarket #TraderLife #InvestorsClub #StockEducation #FinancialFreedom #MoneyManagement #MarketPulse247
8
787

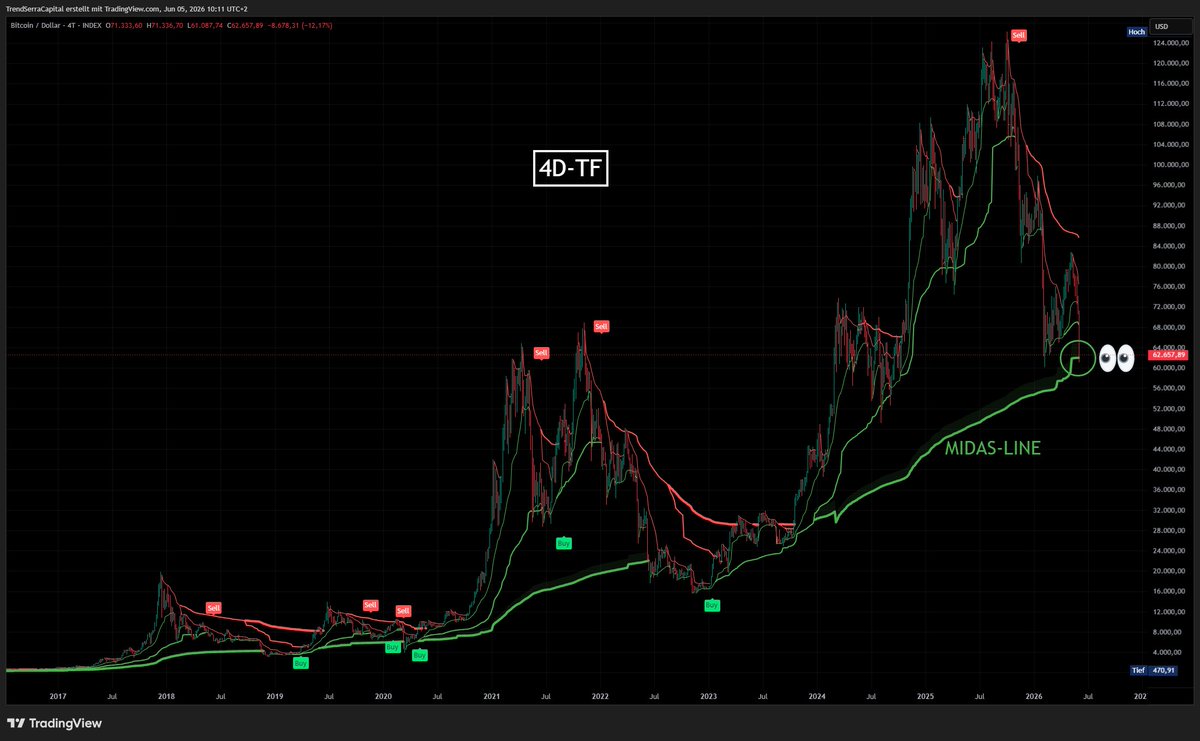
#Bitcoin testet im 4D-Timeframe eine zentrale MIDAS-VWAP-Supportzone. 👀
#BTC hat aktuell die grüne MIDAS VWAP erreicht.
Das ist aus meiner Sicht ein relevanter Bereich, weil dieser Indikator nicht wie ein klassischer gleitender Durchschnitt funktioniert.
Die MIDAS VWAP basiert auf einem volumen gewichteten Durchschnittspreis, der von relevanten Hoch- oder Tiefpunkten im Markt abgeleitet wird. Dadurch zeigt sie, wo über längere Zeiträume hinweg eine strukturelle Akkumulations- oder Distributionsbasis entstanden ist.
Im aktuellen Fall steht besonders die grüne MIDAS VWAP im Fokus.
Diese Linie hat bei $BTC in der Vergangenheit mehrfach als dynamische Supportzone fungiert und markierte häufig Bereiche, in denen der Markt zumindest temporär eine stärkere Reaktion ausbilden konnte.
Der entscheidende Punkt ist jetzt nicht der Kontakt mit der Linie selbst.
Entscheidend ist die Reaktion im 4D-Timeframe.
Solange Bitcoin diese MIDAS-VWAP-Zone verteidigt und eine sichtbare Stabilisierung ausbildet, steigt die Wahrscheinlichkeit für einen temporären Zwischenboden oder eben einen finalen Boden.
Ein nachhaltiger Bruch darunter wäre dagegen ein klares Warnsignal, dass die laufende Korrektur strukturell noch nicht abgeschlossen ist und weiteres Abwärtspotenzial freigesetzt werden könnte.
Auf geht`s💪
WISSEN IST VERMÖGEN.
TRENDS ERKENNEN.
VORAUSSCHAUEND HANDELN.
TSC | Trend Serra Capital.

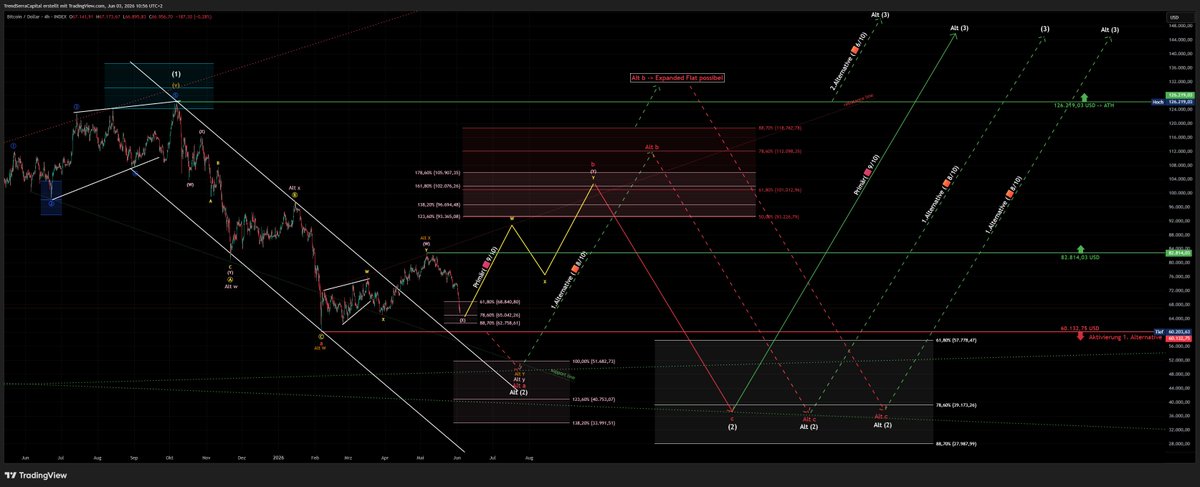
#Bitcoin bleibt unter Verkaufsdruck👀
$BTC handelt aktuell bei rund 67k$ und hat damit die kurzfristige Zielzone der Sub-Welle X (gelb) bei:
🎯 73.8k$ – 68.7k$
bereits unterboten.
Wichtig ist jetzt die Einordnung:
Das primäre Szenario ist dadurch noch nicht invalidiert. Vielmehr hat sich die interne Struktur verändert.
Statt eines möglichen Triple ZigZags rückt nun ein Double ZigZag mit den Wellen (W), (X) und (Y) in rosa in den Fokus.
Demnach befindet sich #BTC aktuell sehr wahrscheinlich in der Welle (X) rosa, die idealerweise im Bereich zwischen:
🎯 68.8k$ – 62.7k$
abgeschlossen werden sollte, um das primäre Szenario weiter zu bestätigen.
Anschließend würde die Welle (Y) rosa in den Fokus rücken. Diese dürfte sich wiederum aus den Sub-Wellen W, X und Y in gelb zusammensetzen und #Bitcoin im "bullischen" Verlauf wieder über 82.8k$ führen.
Solange #Bitcoin den Bereich um 60.1k$ nicht verliert, bleibt die laufende Bewegung weiterhin als korrektive Welle (X) rosa interpretierbar.
Erst ein Bruch unter 60.1k$ würde aus meiner Sicht die 1. Alternative aktivieren und das Risiko einer tieferen direkten Ausdehnung deutlich erhöhen.
Wie bereits seit Wochen angedeutet, liegen beide Szenarien inzwischen sehr eng beieinander:
Primäres Szenario: 9/10
1. Alternatives Szenario: 8/10
Das Setup bleibt angespannt, ist aber noch nicht endgültig gekippt.
Elliott-Wellen-Chart (mittelfristig)👇
s3.tradingview.com/snapshots…
Auf geht’s💪
WISSEN IST VERMÖGEN.
TRENDS ERKENNEN.
VORAUSSCHAUEND HANDELN.
TSC | Trend Serra Capital.
1
10
1,076