
🚨 TARGET DROPPED CHAOS RISING BOOSTER BUNDLES! 🚨
Our community was ready and secured orders instantly with alerts, early links & the PokeSlayerz extension. 🔥
💻 PokeSlayerz.io
💬 discord.gg/fNbUeBErb
#PokemonTCG #PokeSlayerz #TargetDrop #ChaosRising

1
35

NEW SKU LOADED
The online drop setup for the Destined Rivals Elite Trainer Box is officially moving.
If you wait until links are flying on the timeline… it’s already too late.
Don’t get caught off guard.
Refresh season is coming.
We are LOCKED IN. 🔴⚫
whop.com/tcgtracker/tcgtrack…
#PokemonTCG #DestinedRivals #PokemonCards #TargetDrop #PokemonRestock

2
4
16
5,281

May 16
Target Novato, CA
According to a submission, customers were waiting in line with “2 per item” signs posted…
Then one guy allegedly checked out a FULL cart of First Partner product while the manager rang him up 😳
Collectors calling favoritism 👀
#PokeStreetz #TargetDrop
63
27
383
73,627

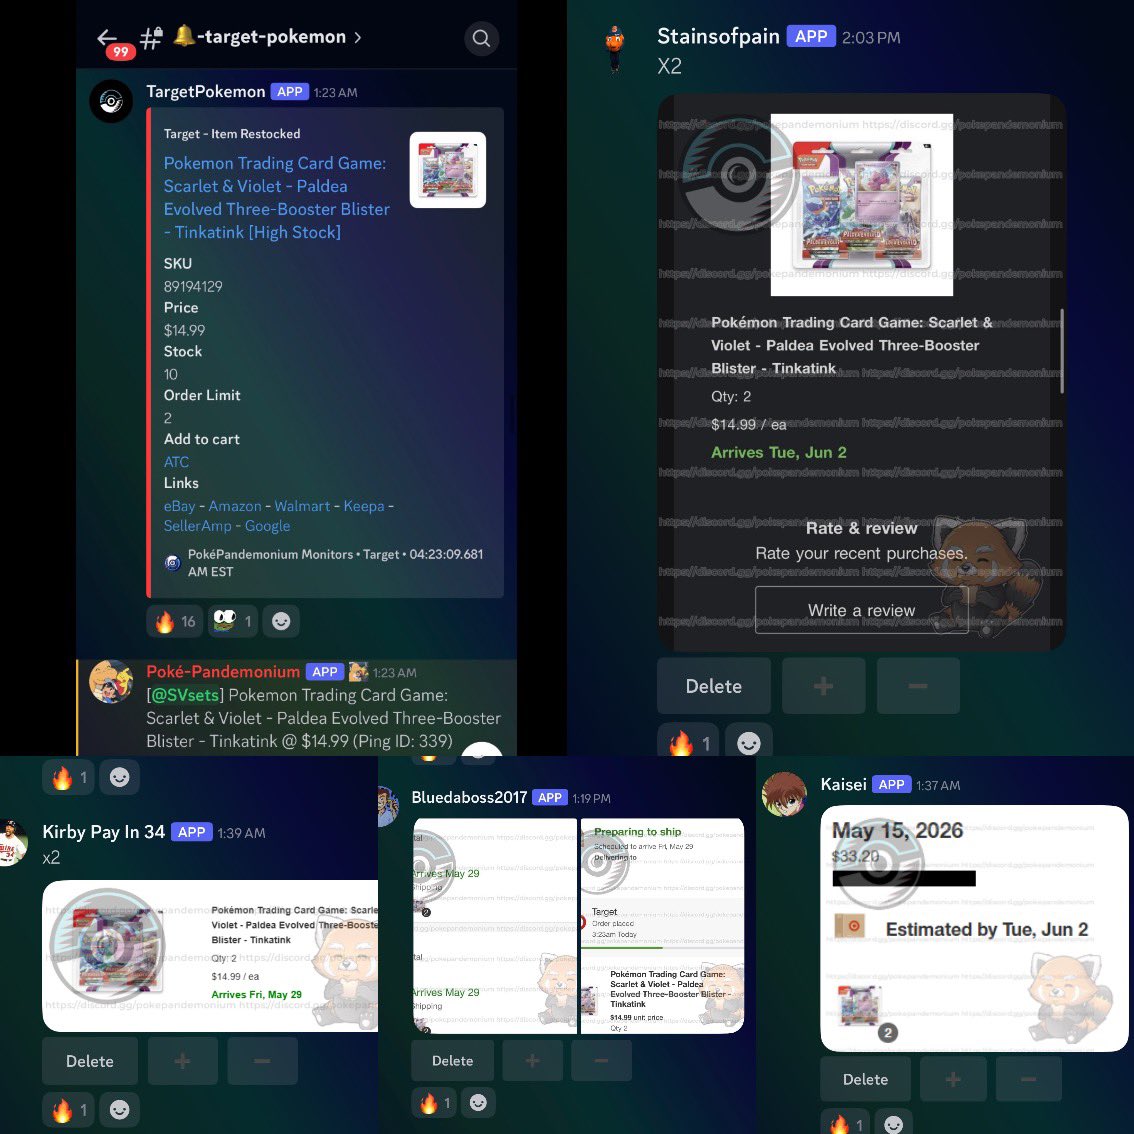
Other groups weren't even around yet when we added Paldea Evolved to our Target monitors.
It restocked last night at 1:23am PST. We pinged. They didn't. We had lots of easy checkouts with no competition.
Proof below.
Join the group that’s been around since 2021. Link in bio.
#Pokemon #PokemonTCG #PaldeaEvolved #TargetDrop
2
1
6
407

Apr 15
🚨 2025 Topps Chrome Football Target drop tonight!
Expected window: 1-3 AM EST
Value Box – $38
(7 packs / 28 cards – solid rookie & parallel chances exclusive retail inserts)
👉 mavely.app.link/2VlhOmdol2b
Hanger Box – $20
(1 big 20-card pack – heavy on refractors, ~3 rookies, Pulsar parallels & inserts)
👉 mavely.app.link/ebZR1jnol2b
Set your alarms! These usually go quick.
Who’s staying up for the drop? Value Box for volume or Hanger for the big pack vibe? 🔥
#ToppsChromeFootball #NFLCards #FootballCards #TargetDrop

4
403
Apr 10
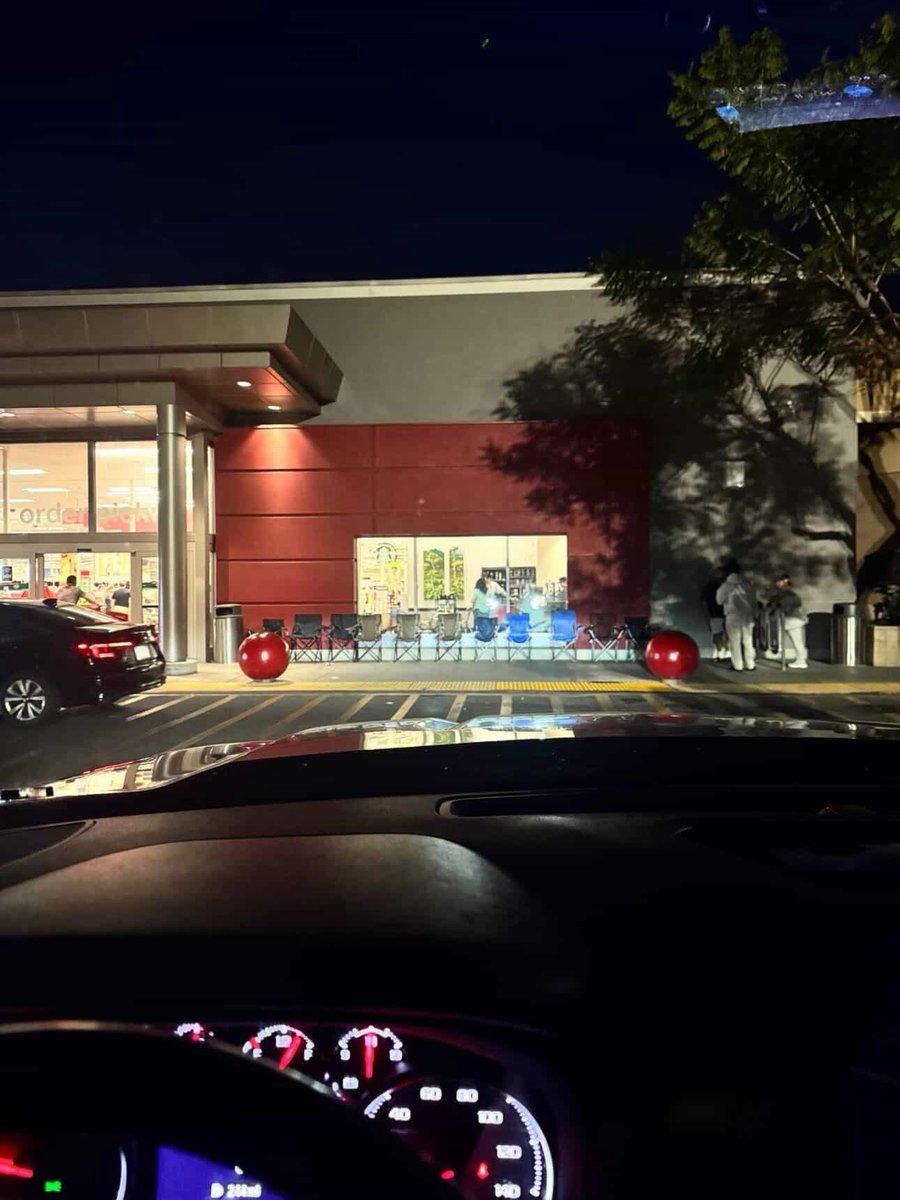
🚨 Ghost chairs already posted up at Target 😳
Riverside, CA — Tyler St (91 fwy). Chairs sitting outside before anyone’s even there… saving spots before the line even forms.
Same tactic, different city.
Valid or nah? 👀
#PokeStreetz #TargetDrop #GhostChairs
32
47
24,733
Mar 24
🚨 NEW ANGLE: Costa Mesa Target fight 😭
Grown men throwing hands over Pokémon cards… while a Starbucks cup gets launched like a Hydro Pump 💀
Same restock, different angle, still chaos.
Is this what the hobby turning into? 👀
#PokeStreetz #TargetDrop
🎥 @Faf_314
16
17
317
33,923
Mar 24
🚨 Costa Mesa Target restock turned into a full fight😳 WITH KIDS ON LINE
Tensions built up before packs even hit shelves… then it went left
People throwing hands over Pokémon cards like it’s nothing.
hobby getting outta control? 👀
#TargetDrop #RestockChaos #CaughtHands
91
67
1,207
114,837

Mar 20
🚨🔥 TARGET DROP TONIGHT 🔥🚨
THIS IS YOUR MOMENT… OR YOUR MISS 😤
⏰ 10PM PT / 1AM ET ⏰
💻 Be ready. Refreshing starts EARLY.
Target is LOADED… but so is everyone else 👀
━━━━━━━━━━━━━━━
🟢 HIGH STOCK (DON’T GET COMFORTABLE)
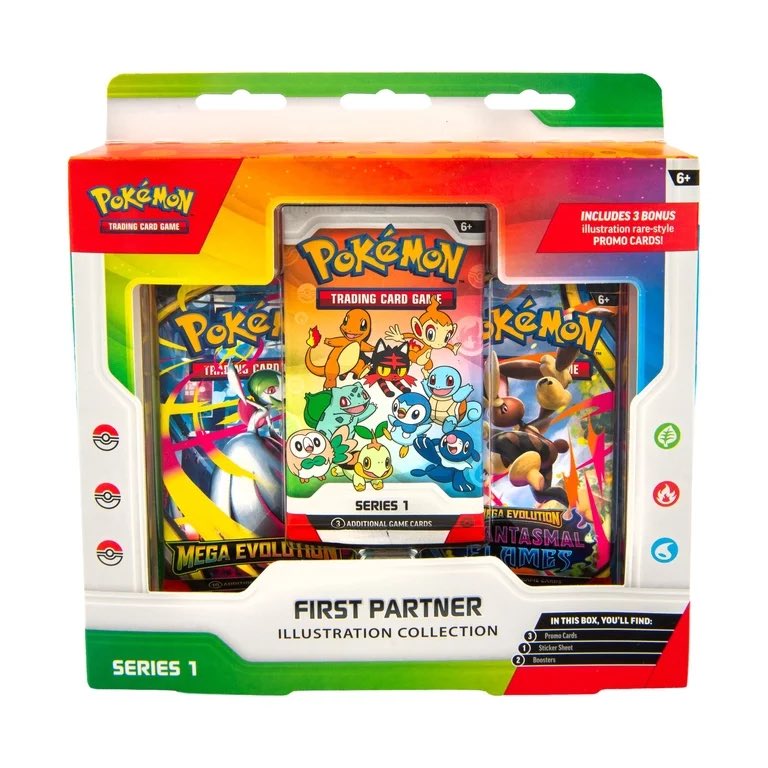
📦 First Partner Illustration Box (20K )
target.com/p/moo/A-95225595
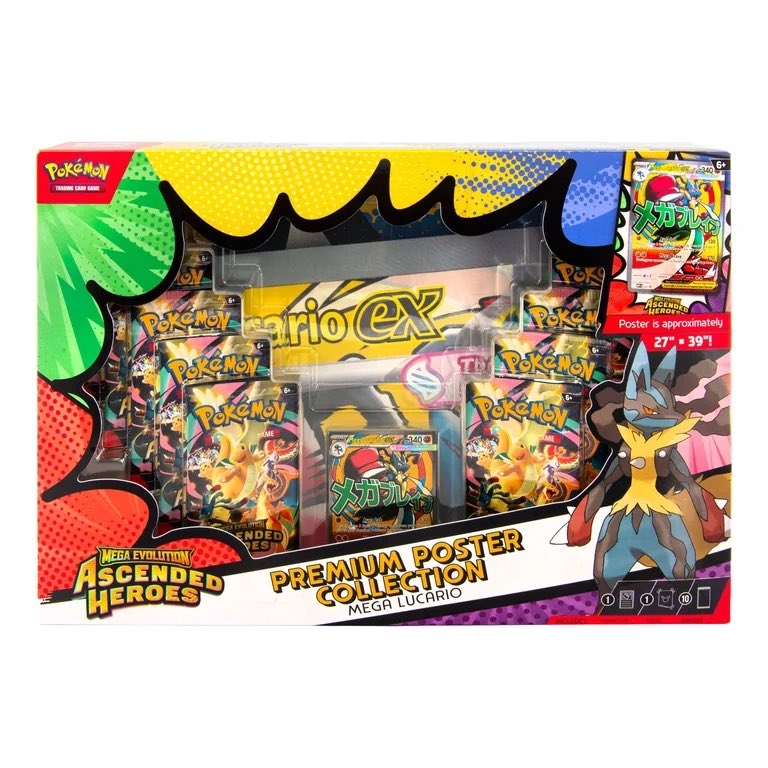
📦 Ascended Heroes Poster Collections (10K )
🟣 Gardevoir: target.com/p/moo/A-95093982
🔵 Lucario: target.com/p/moo/A-95093981
━━━━━━━━━━━━━━━
🔴 LOW STOCK = INSTANT SELL OUT
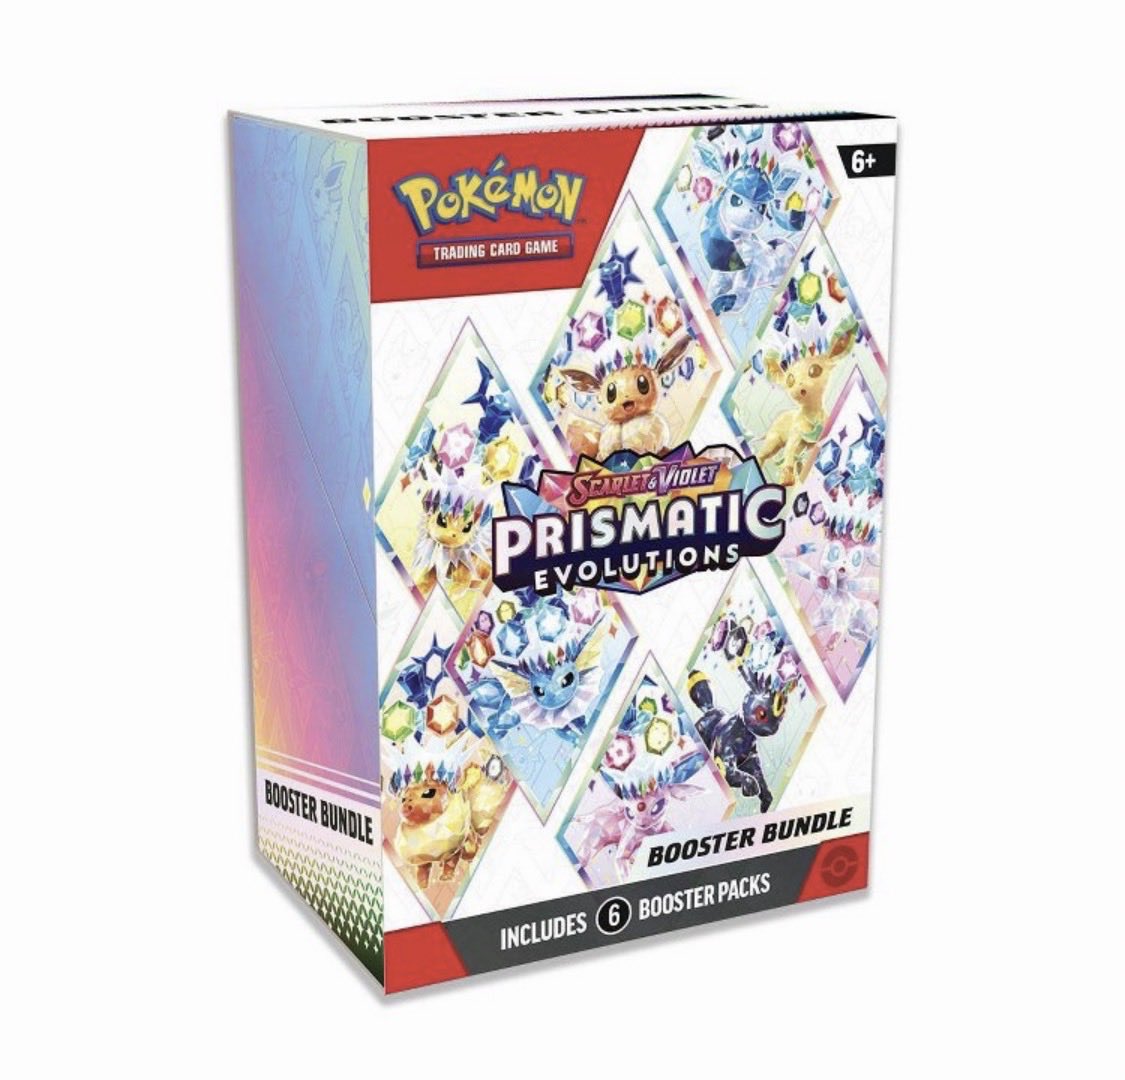
⚠️ Prismatic Evolutions Booster Bundle (<1K)
target.com/p/moo/A-93954446
💀 This is the ONE everyone is hunting… gone in SECONDS.
━━━━━━━━━━━━━━━
⚡️ Don’t get baited by “high stock”
⚡️ Carts will fail
⚡️ Checkout speed = EVERYTHING
👉 Be early
👉 Spam refresh
👉 Don’t hesitate
MISS THIS… and watch resale take over tomorrow 📈🔥
#Pokemon #PokemonTCG #TargetDrop #FOMO #RestockAlert
2
555
Mar 15
🚨 Target Enter Trick 🚨
1. Log in early. Save payment/shipping.
2. Go to product page. Refresh hard at drop time.
3. Click “Place Order” button area once.
4. Hold Enter key (don’t release) until order confirms, even through freezes.
#PokemonTCG #PokemonCards #TargetDrop #AscendedHeroes
3
346

📊 THE CHART: REALIZED PRICE LEVELS
MetricValue (Approx)Color on ChartBitcoin Current Price$67,000Black (price line)2-Year Realized Price$89,000Blue5-Month Realized Price$80,000YellowOverall Realized Price$54,000Black (horizontal)
The Relationship:
ComparisonStatusPrice vs 2Y RealizedBelow (-25%)Price vs 5M RealizedBelow (-16%)Price vs Overall RealizedAbove ( 24%)
🧠 WHAT "REALIZED PRICE" MEANS
TermDefinitionRealized PriceThe average price at which all currently held Bitcoin were last moved2-Year RealizedAverage cost basis of coins moved in last 2 years5-Month RealizedAverage cost basis of coins moved in last 5 months (short-term holders)Overall RealizedAverage cost basis of ALL coins (market's breakeven)
The Significance:
LevelMeaningAbove RealizedMarket in profitBelow RealizedMarket at a lossBelow 2Y/5M RealizedShort/medium-term holders underwater
📉 THE HISTORICAL PATTERN
PlanB's Observation:
"Historically, price drops under overall realized ($54k) before big rebounds."
CycleDrop Below RealizedSubsequent Rally2015Yes 10,000% 2018-2019Yes 300% 2020 (March)Yes 1,200% 2022Yes 200% (so far)2026Not yet (price > $54k)???
Current Position:
LevelStatusHistorical SignalBelow 2Y Realized ($89k)✅Bearish short-termBelow 5M Realized ($80k)✅Short-term holders capitulatingAbove Overall Realized ($54k)✅Long-term holders still in profit
We are in the "pain zone" for recent buyers, but long-term holders are still above water.
⚡ THE BIG QUESTION: "WILL THIS TIME BE DIFFERENT?"
Arguments for "Different":
FactorBear CaseMacro chaosOil at $102, Hormuz closed, war escalatingGlobal recession41% odds, Germany data crashingInflationCPI Wednesday could be hotFedCan't cut with inflationRisk-offAll assets bleeding
Arguments for "Same":
FactorBull CaseHistorical patternEvery dip below realized eventually reversedWhale accumulationLarge bids at $69k, $65kSupply crunch95% mined, 3-4M lostHalving cycle24-month peak window (now)Institutional adoptionPowell: "Core of system"
📊 THE TWO SCENARIOS
Scenario A: Capitulation Incoming
PathPrice TargetDrop to Overall Realized$54,000Overshoot$50,000 or lowerTimeframeWeeksThenHistoric rebound
Scenario B: Dip Buyers Loading
PathPrice TargetHold current levels$65-70k rangeWhale bids absorb$69k, $65k wallsCatalystCPI, Iran resolution, Fed pivotThenRecovery to $80k
🧠 THE PSYCHOLOGY PLAY
What Short-Term Holders Feel:
EmotionActionPanicSelling at $67k (below their cost)Regret"Should have sold at $80k"Fear"It's going to $50k"
What Long-Term Holders Feel:
EmotionActionCalm"Been here before"Greed"Accumulation zone"PatienceWaiting for rebound
What Whales Are Doing:
ActionSignalBids at $69k, $65k"We'll buy this dip"Accumulating"Long-term value"
📌 THE BOTTOM LINE
✅ Bitcoin at $67k – below 2Y realized ($89k) and 5M realized ($80k)
✅ Short/medium-term holders underwater
✅ Long-term holders still above overall realized ($54k)
✅ Historical pattern: drops below overall realized precede big rebounds
✅ We haven't reached that level yet
✅ Question: Will this time be different due to macro chaos?
✅ Two paths: capitulation to $54k or dip buyers hold $65-70k
The market is at a crossroads.
History says buy. Macro says wait.
🧠 YOUR TAKE
👇 Verdict: Capitulation or Dip Buyers?
☐ Capitulation to $54k
☐ Dip buyers hold $65-70k
☐ Somewhere in between
☐ This time IS different (lower)
☐ This time IS different (higher)
✅ Like if you follow on-chain metrics
🔄 Retweet so your followers see PlanB's analysis
➕ Follow @Divine_Cashflow for more data-driven insights
#Bitcoin #BTC #RealizedPrice #OnChain #PlanB #StockToFlow #Accumulation #Capitulation #Crypto
✅ VERIFIED: Bitcoin at $67k below 2Y realized ($89k) and 5M realized ($80k). Short-term holders underwater. Long-term holders above overall realized ($54k). Historical pattern: drops below overall realized precede big rebounds. Will this time be different?
4
1,622
🚨 Target Enter Trick 🚨
1. Log in early. Save payment/shipping.
2. Go to product page. Refresh hard at drop time.
3. Click “Place Order” button area once.
4. Hold Enter key (don’t release) until order confirms — even through freezes.
#PokemonTCG #PokemonCards #TargetDrop #AscendedHeroes
1
3
1,232
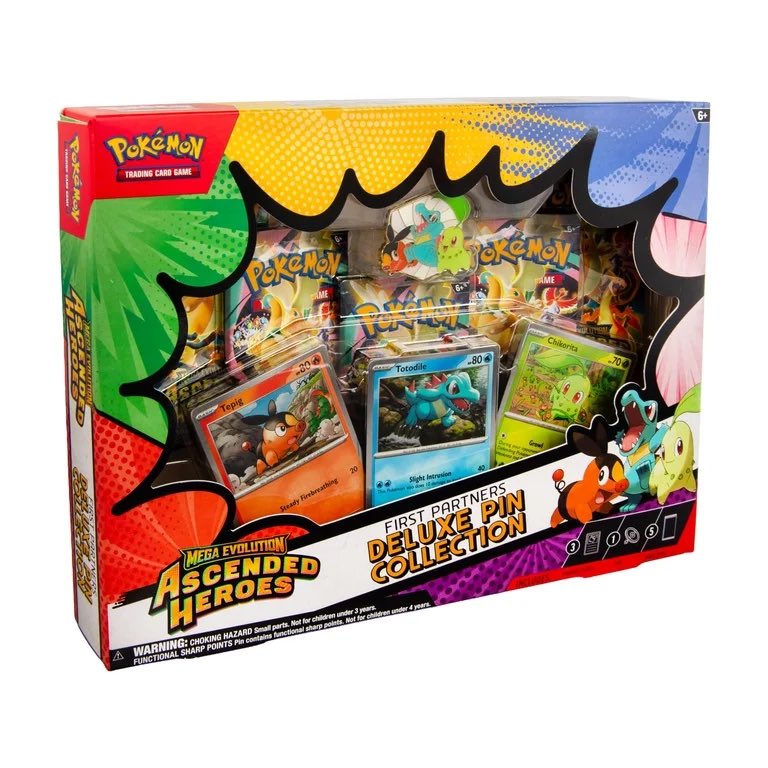
🚨 Target Drop Alert – Ascended Heroes 🚨
High chance drop: Tonight / Early AM (1-3 AM EST)
• Elite Trainer Box – $59.99
Stock: 20,000
🔗 target.com/p/moo/A-95082118
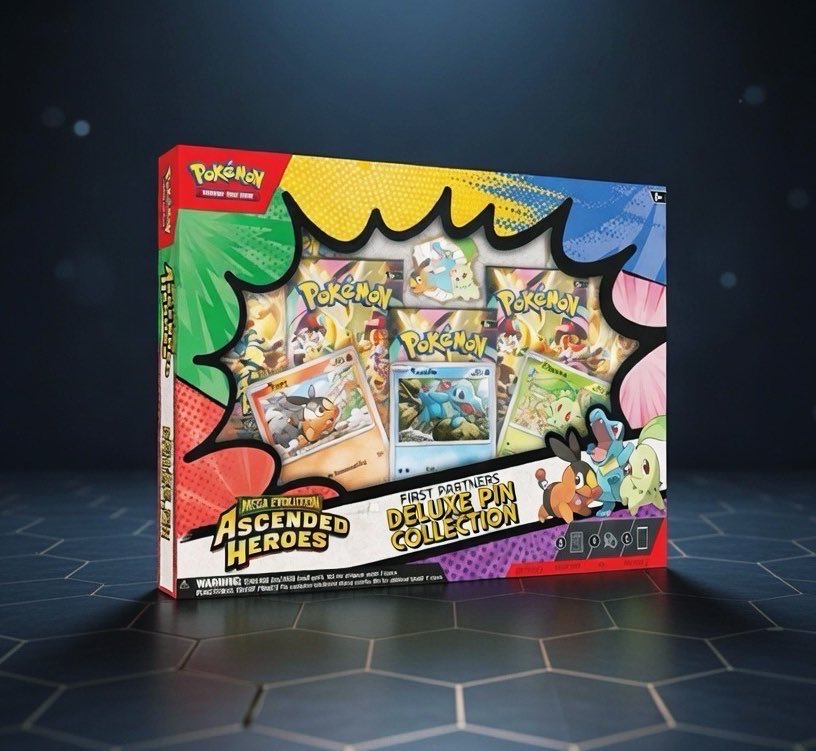
• First Partners Deluxe Pin Collection – $29.99
Stock: 5,000
🔗 target.com/p/moo/A-95093989
Set alarms • Refresh fast • Cart quick!
#PokemonTCG #PokemonCards #AscendedHeroes #TargetDrop #PokemonRestock
1
8
3,054

8 Aug 2022
[State ]
type = TargetDrop
trigger1 = 1
keepone = 0 NumTarget * 0
ignorehitpause = 1
という記述だと最後の位置にあるターゲットだけを一つ消すという処理になる模様
5


Thanks to @CardPurchaser for the quick updates this morning on the #targetdrop. Faster than the YouTube channel I was watching! 1 DP Celo, 2 DP Mega, 6 Chronicles Mega 1 Prestige mega, and 5 Absolute Baseball Blasters. Was hoping for Bowman but out of $$ ! hahaha
1
1
10

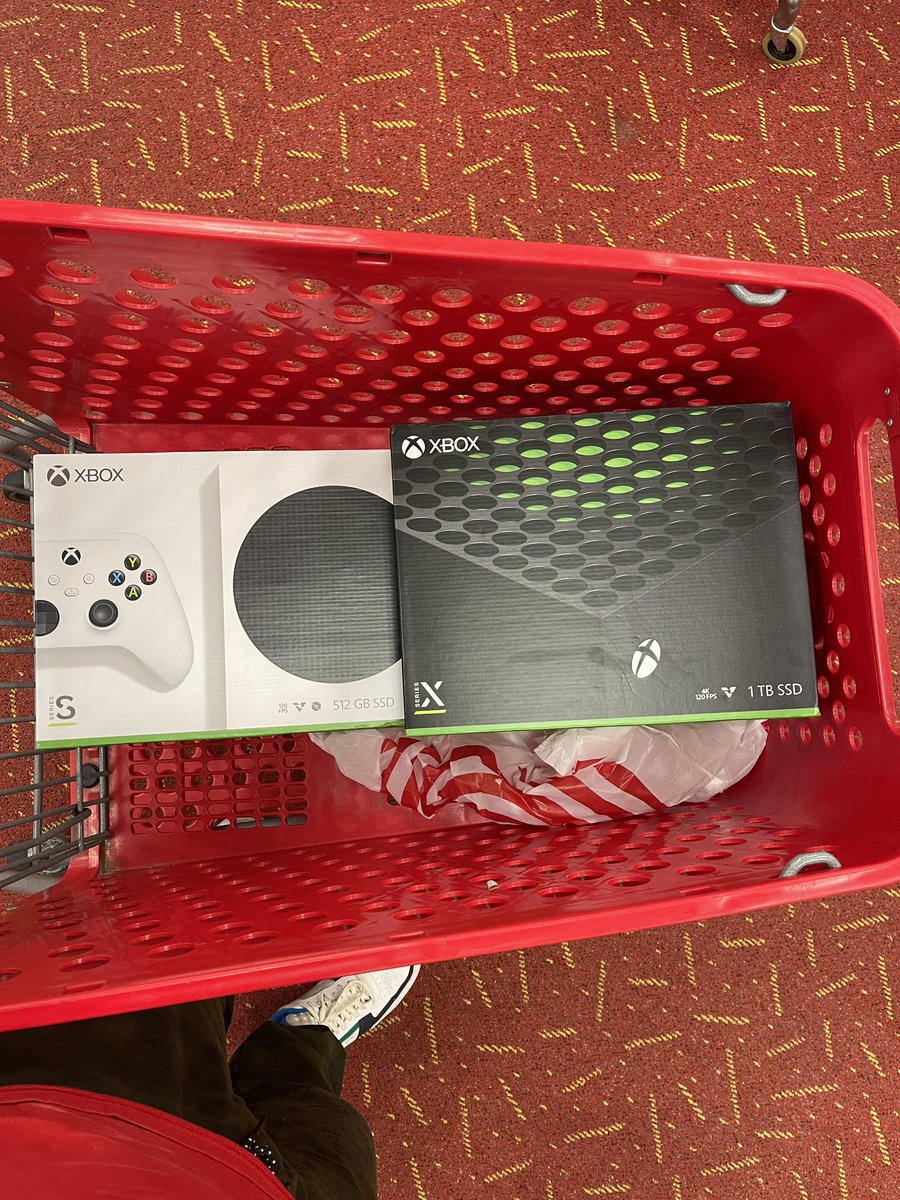
@ChitoGaminYT you the man!!! The final one I needed, now my two boys, brother, and myself are Next Gen gaming. #GSDrop #TargetDrop #WMDrop #AntonlineDrop

1
2

25 Feb 2021
Got the #PS5Disc & #PS5Digital at home so I had to cop the #XboxseriesS & #XboxseriesX too. 😈😈😈😈
#microsoft #Playstation #sony #TargetDrop @Target @Sony @Microsoft @Xbox
1
4

[Target Links] In case they drop. Pages no longer say "sold out" (drop has not happened yet)
PS5 Digital
target.com/p/playstation-5-d…
PS5 Disc
target.com/p/playstation-5-c…
Xbox Series X
target.com/p/xbox-series-…
#xboxseriesx #Targetrestock #ps5restock #ps5stock #targetdrop #ps5drop
11
4
41
[NOT A DROP] I’m up in case #Target drops the #ps5 or #XboxSeriesX .
I won’t tweet much so as to not cause many false alarms. If they drop i will let you know!
Notifications ON
#ps5drop #ps5stock #ps5restock #xboxdrop #xboxseries #xboxrestock #xboxseriesxrestock #targetdrop
19
1
81